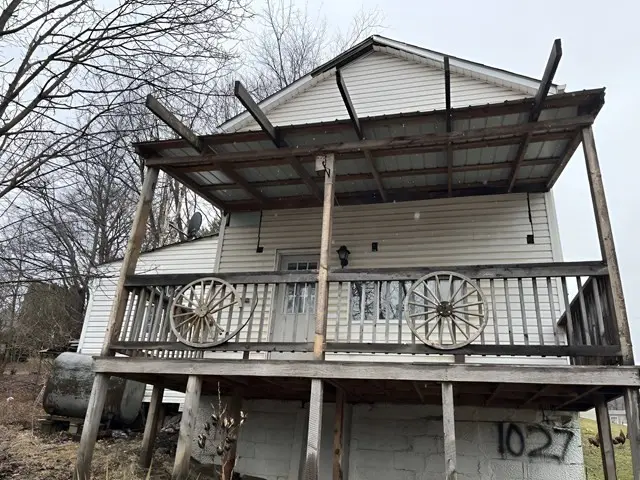
1027 Church St · Sagamore, PA
Flood risk 1/10 · Minimal
- FEMA flood zone
- X (unshaded)
- Chance of flooding over 30 yrs
- 0.0%
- Est. flood insurance / yr
- $507 – $1,088
Fire risk 1/10 · Minimal
- Est. fire insurance / yr
- $511 – $949
Heat risk 3/10 · Minor
- Hot days now (above 95°F)
- 7 days/yr
- Hot days in 30 yrs
- 18 days/yr
Wind risk 2/10 · Minimal
- Chance of severe wind over 30 yrs
- —
Air-quality risk 3/10 · Minor
- Unhealthy air days now
- 2 days/yr
- Unhealthy air days in 30 yrs
- 4 days/yr
Risk factors via First Street. Map © Google.
Why this score? — see what drove the D+ grade
The composite is a weighted blend of 9 inputs, each scored 0–100. Each bar is that input's sub-score; the figure is the points it added to the 100-point composite (weight × sub-score).
- Cash flow +15.0/30.0
- ARV discount +7.5/15.0
- 1% rule +5.0/10.0
- DSCR +5.0/10.0
- Appreciation +5.0/10.0
- Schools +4.0/10.0
- Rent growth +2.5/5.0
- Livability +2.5/5.0
- Condition / age +2.5/5.0
$24,500
🖨 Deal sheet 📄 Offer letter ✓ Due diligence
Listing remarks MLS
Tucked away on a Quiet Residential Street, this 3-bedroom, 1.5 bath home offers convenience and great value. Features spacious living areas and lots of natural light, this property would be ideal for a Handy Person or Investor. LOW Taxes keep your month costs affordable.
Key facts
- 6,751 sq ft lot
- Built 1900
- Listed 91 days
Neighborhood map
What this means for you Summary
Snapshot
- This is a 3-bed/1.5-bath single-family listed at $24k.
Deal economics
- At list price, monthly cash flow is $614 ($7k/yr) — positive.
- The deal already cash-flows at list — no discount required.
- Meets the 1% rule at list price ($1k rent vs $24k).
- Recommended offer: $22k (9.0% below list) — sets the bar for market timing.
Location & tenants
- Location reads: area grade D — affects rentability + tenant quality, not the cash-flow math above.
- Armstrong SD (rural): math 38% / reading 58% proficiency, ranked #233 of 539 in PA (top 43%) — families likely to look elsewhere, expect single-tenant / working-renter base with shorter leases.
- Market conditions: 1 active listings in the ZIP; 58 units permitted in Armstrong County in 2024 (20 in 5+ unit buildings).
Forward outlook
- In year one you build about $904 of equity ($169 loan paydown + $735 appreciation (3.0% local appreciation)).
- Armstrong County population projected at -27% by 2050 — secular population decline; favor cash flow + early exit over multi-decade hold.
- At projected returns (3.0% appreciation + 3.0% rent growth), your $7k cash investment doubles in ~1 year — after that, you're playing with house money.
Negotiation context
- It's been on market 91 days — a 9% lower offer ($22k) is reasonable based on typical stale-listing flexibility.
Risks & watch-outs
- Watch-outs: property tax is 2.9% of price; built in 1900 — expect roof / HVAC / electrical / plumbing capex.
Questions for the listing agent
- It's been on market 91 days. Have you received any prior offers? Is the seller open to a 9% concession, seller financing, or rate buy-down credit?
- Built in 1900 — when were the roof, HVAC, electrical panel, plumbing, and water heater last replaced?
- Property tax is high relative to price — has the assessment been appealed recently, and will the sale trigger a re-assessment?
- Why hasn't it sold? Are there any deal-killer items the seller is aware of (foundation, flood, title, zoning, code violations)?
- Is there a deadline driving the sale (1031 exchange, divorce, estate, relocation)? That informs how much negotiation room exists.
- The area grade is low — what's the realistic commute time and amenity access for the typical tenant pool here? Any planned neighborhood developments (good or bad) we should know about?
- What's the average days-on-market for RENTAL listings here right now (not sales)? A rising rental-DOM trend means longer vacancies and softer asking-rent achievability than the comps imply.
- What's the recent tenant-quality profile in this submarket — average credit score on applications, eviction rate, late-payment / NSF rate, and stable-employment percentage? A property-management company in the area should have these aggregated.
- How much new for-sale + rental construction is in the pipeline within 1–3 miles? Heavy new supply typically softens prices + rents 12–24 months out; constrained supply supports both.
Investment metrics
- 1% rule
- 4.19% ✓
- Cap rate
- 36.35%
- Cash-on-cash
- 107.34%
- DSCR
- 5.78
- GRM
- 2.0
CMA / ARV
- ARV (median comp)
- $133,098
- List price
- $24,500
- Delta
- -81.59%
- Verdict
- UNDERPRICED
- Comps
- 3 within 1.0 mi
Projected returns pro-forma
3.0% appreciation · 3.0% rent growth · sell at horizon
- IRR
- —
- Equity multiple
- 7.13×
- Total profit
- $42,067
- Equity at exit
- $11,016
- IRR
- —
- Equity multiple
- 14.85×
- Total profit
- $95,032
- Equity at exit
- $16,977
Cash invested: $6,860 (down + closing). Projections, not guarantees.
Landlord ↔ Tenant lean methodology
- Overall (STATE)
- 62 Landlord-Friendly
- State Pennsylvania
- 62 Landlord-Friendly · EVEN
- County
- — inherits STATE
- City
- — inherits STATE
ZIP-level market 16250
- Active inventory
- 1
- Price-to-rent
- 2.0×
Monthly cashflow live
- Estimated rent
- $1,028 medium interval (Pro) →
- Mortgage (P&I)
- −$128
- Tax from tax record
- −$60 /mo · $715/yr
- Insurance
- −$10
- HOA
- −$0
- Vacancy / Maint / Mgmt
- −$216
- Net cashflow
- $614
Break-even live
UW: 25.0% down · 7.5% · 30yr · 1.5% tax · 5.0% vac · 8.0% maint · 8.0% mgmt
Financing live
Cash to close
- Down payment
- $6,125
- Closing costs
- $735
- Reserves months
- —
- Total cash needed
- —
Loan-product check · same deal, 3 products live
Conventional
25% down · 7.5% · 30yr
- Down + closing
- —
- Monthly P&I
- —
- Monthly cashflow
- —
- DSCR
- —
- Eligible?
- —
Personal DTI + credit; lowest rate.
DSCR
20% down · 8.5% · 30yr
- Down + closing
- —
- Monthly P&I
- —
- Monthly cashflow
- —
- DSCR
- —
- Eligible?
- —
No personal income docs; deal must DSCR.
Hard money
10% down · 12.0% · 12mo
- Down + closing
- —
- Monthly P&I
- —
- Monthly cashflow
- —
- DSCR
- —
- Eligible?
- —
Short-term bridge; refi at stabilization.
Listing history 8 events
-
2026-06-07statusdays on market $24,500 Pending 91 DOM
-
2026-06-04days on market $24,500 Active 89 DOM
-
2026-06-02days on market $24,500 Active 88 DOM
-
2026-06-01days on market $24,500 Active 87 DOM
-
2026-05-31days on market $24,500 Active 86 DOM
-
2026-05-18price $24,500 271-char remark
Show marketing remark (271 chars)
Tucked away on a Quiet Residential Street, this 3-bedroom, 1.5 bath home offers convenience and great value. Features spacious living areas and lots of natural light, this property would be ideal for a Handy Person or Investor. LOW Taxes keep your month costs affordable.
-
2026-04-09price $28,500 271-char remark
Show marketing remark (271 chars)
Tucked away on a Quiet Residential Street, this 3-bedroom, 1.5 bath home offers convenience and great value. Features spacious living areas and lots of natural light, this property would be ideal for a Handy Person or Investor. LOW Taxes keep your month costs affordable.
-
2026-03-06$34,900 Active 271-char remark
Show marketing remark (271 chars)
Tucked away on a Quiet Residential Street, this 3-bedroom, 1.5 bath home offers convenience and great value. Features spacious living areas and lots of natural light, this property would be ideal for a Handy Person or Investor. LOW Taxes keep your month costs affordable.
ⓘ Source: listings_history table (triggers on properties + properties_extension) + one-shot
backfill from property_details.listing_events for pre-trigger history.
Tax reassessment forecast PA · Partial reset (capped growth)
- Current annual tax
- $715 · $60/mo
- Projected year-2 tax
- $715 · $60/mo
- Expected delta
- $0/yr ($0/mo · 0.0%)
ⓘ Screening estimate from a state-policy table — verify with the county assessor before closing.
Climate risk First Street
- Flood 1/10 Low FEMA zone X (unshaded) · 0% chance over 30 yrs
- Wildfire 1/10 Low
- Heat 3/10 Moderate 7 d/yr ≥95°F today · 18 d/yr by 30 yrs out
- Wind 2/10 Low
- Air quality 3/10 Moderate 2 unhealthy d/yr today · 4 by 30 yrs out
Nearby sold comps map
Loading sold comps map…
Walkable amenities ~0.75 mi
Loading nearby amenities…
Taxation est. · year 1
- Rental income
- $12,332
- − Mortgage interest
- −$1,372
- − Property taxes
- −$715
- − Insurance
- −$122
- − Repairs & maintenance
- −$987
- − Management
- −$987
- − Depreciation
- −$713
- Taxable income
- $7,437
- Est. tax owed @ 24.0%
- −$1,785
- After-tax cash flow
- $5,579/yr
For passive investors: Depreciation is non-cash, so a rental often shows a tax loss while cash-flowing — sheltering income. Rental losses are passive: they offset passive income freely, and up to $25,000/yr can offset ordinary (W-2) income if you actively participate and your MAGI is under $100k (phasing out to $0 by $150k); unused losses carry forward. On sale, claimed depreciation is recaptured at up to 25%, and gains may owe capital-gains tax (a 1031 exchange can defer both). Figures are a year-1 estimate at your 24.0% rate — not tax advice; consult a CPA.
Schools (NCES district)
- District
- Armstrong SD
- NCES district ID
- 4202590
- Math proficiency
- 38% ▼ -13.00%
- Reading proficiency
- 58% ▼ -6.00%
- Median HH income
- $43,333
- Composite
- 40.41/100
- National rank
- #3729
- State rank
- #233 of 539 in PA
Livability — Sagamore
No livability data for this city. (Only ~50 U.S. cities are tracked.)
Census & demographics
- Census place
- Sagamore, PA
- Population (ZIP)
- 238
Population outlook (Armstrong County) Hauer SSP2
- Today (2025)
- 62,513 people
- By 2030
- 59,579 · -4.7%
- By 2040
- 52,890 · -15.4%
- By 2050
- 45,904 · -26.6%
- By 2075
- 32,023 · -48.8%
- By 2100
- 20,415 · -67.3%
Race, ethnicity, and origin ACS 2023
- Neighborhood character
- Predominantly White (97%)
- Race & ethnicity
- White 97% Two or more races 3%
- Common ancestry
- Iranian 13% Slovak 5%
- Languages at home
- 86% English-only · German/W. Germanic 14%
Political lean MEDSL · Armstrong
- 2024 margin
- Solid R (+53.2) · D 23.0% · R 76.2%
- 2008→2024 swing
- -28.6pp toward R · 2008: -24.6pp · 2024: -53.2pp
- All cycles
- 2024: R+53.2 2020: R+52.3 2016: R+52.0 2012: R+37.2 2008: R+24.6
Not yet ingested
- Civics
- —
Market trends
- HPI YoY
- —
- Current HPI
- —
- Rent YoY
- —
- Metro
- —
- State GDP YoY
- ▲ 1.68%
- F500 in state
- 34
Industry mix (Fortune 500 HQ in PA)
| Industry | F500 HQs | Revenue |
|---|---|---|
| Healthcare | 2 | $309B |
|
||
| Insurance | 2 | $27B |
|
||
| Telecommunications / Media | 1 | $124B |
|
||
| Industrial Distribution | 1 | $22B |
|
||
| Financial Services | 1 | $20B |
|
||
| Chemicals / Materials | 1 | $18B |
|
||
Price history
-29.8% since first listed3 events — show timeline
- 2026-05-18 Price Changed $24,500 West Penn MLS
- 2026-04-09 Price Changed $28,500 West Penn MLS
- 2026-03-06 Listed $34,900 West Penn MLS
Property tax history
+0.6%/yrLatest (2026): $715 · +0.0% YoY. Source: county tax records.
Cash-flow waterfall
monthlySold comps — $/sqft
last 12 mo · ≤1 miLoading sold comps…