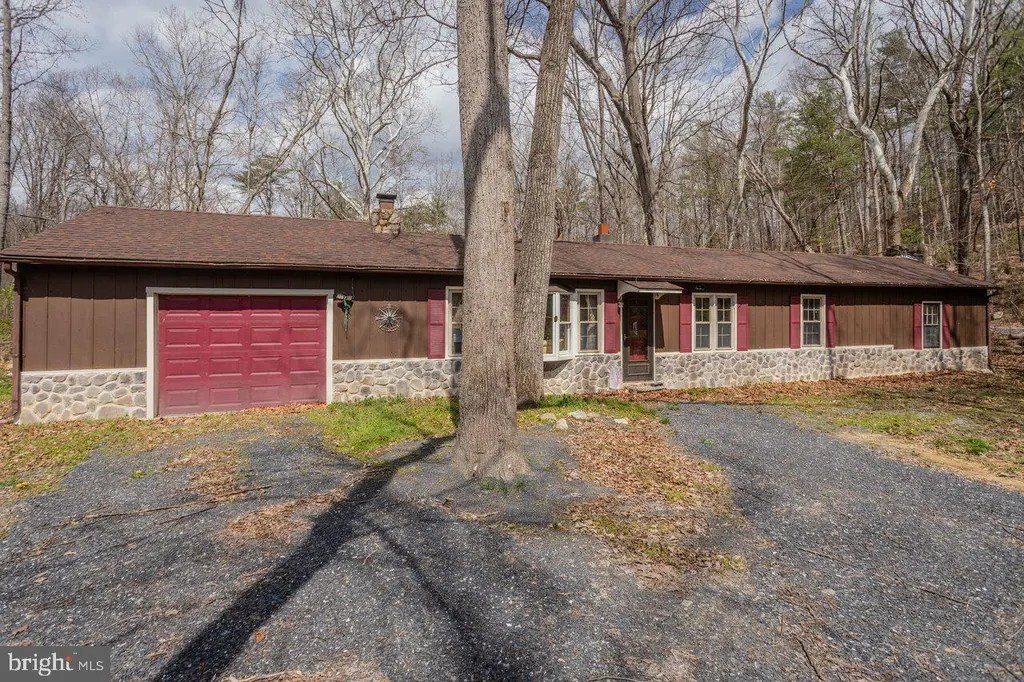
191 Hideaway Farms Rd · Edinburg, VA
Flood risk 10/10 · Severe
- FEMA flood zone
- X (unshaded)
- Chance of flooding over 30 yrs
- 0.99%
- Est. flood insurance / yr
- $473 – $860
Fire risk 5/10 · Moderate
- Est. fire insurance / yr
- $666 – $1,236
Heat risk 5/10 · Moderate
- Hot days now (above 97°F)
- 8 days/yr
- Hot days in 30 yrs
- 21 days/yr
Wind risk 2/10 · Minimal
- Chance of severe wind over 30 yrs
- 1.0%
Air-quality risk 1/10 · Minimal
- Unhealthy air days now
- 0 days/yr
- Unhealthy air days in 30 yrs
- 0 days/yr
Risk factors via First Street. Map © Google.
Why this score? — see what drove the D grade
The composite is a weighted blend of 9 inputs, each scored 0–100. Each bar is that input's sub-score; the figure is the points it added to the 100-point composite (weight × sub-score).
- ARV discount +15.0/15.0
- Appreciation +10.0/10.0
- Schools +4.4/10.0
- Cash flow +4.2/30.0
- Livability +3.4/5.0
- Rent growth +2.5/5.0
- Condition / age +2.5/5.0
- 1% rule +0.0/10.0
- DSCR +0.0/10.0
$274,000
🖨 Deal sheet (PDF) 📄 Offer letter ✓ Due diligence
Listing remarks MLS
Discover the charm at 191 Hideaway Farms Rd! Situated on over half an acre with scenic creek frontage, this 2-bedroom, 1-bath home offers approximately 1,680 square feet of living space and the added benefit of no HOA—providing flexibility to make the property your own. Inside, a spacious layout is complemented by two fireplaces, creating a warm and inviting atmosphere perfect for a cozy, woodland setting. The surrounding wooded acreage offers privacy and plenty of room to explore, garden, or simply enjoy peaceful outdoor living. Conveniently located in Edinburg, just minutes from I-81 and Route 11, this property combines rural charm with easy access to nearby amenities. Outdoor enthusiasts will appreciate the close proximity to Taskers Gap and the George Washington National Forest, offering endless opportunities for recreation and adventure.
Key facts
- 0.53 acre lot
- Garage
- Built 1960
Neighborhood map
What this means for you Summary
Snapshot
- This is a 1-bed/1.0-bath single-family listed at $274k.
Deal economics
- At list price, monthly cash flow is $-798 ($-10k/yr) — negative.
- To cash-flow at today's rent, offer at most $133k (51.4% below list).
- To meet the 1% rule (rent ≥ 1% of price), the offer needs to be $114k (58.4% below list).
- Recommended offer: $114k (58.4% below list) — sets the bar for 1% rule.
Location & tenants
- Location reads 67/100 on livability (#294 in VA) — a middle-class / working-renter tenant base. Strengths: crime A+, housing A+, cost of living A; Watch: schools D-, amenities F, commute F.
- Shenandoah County Public School District (town): math 46% / reading 58% proficiency, ranked #91 of 131 in VA (top 70%) — acceptable for families but not a draw, mixed tenant base, ~2y average lease.
- Market conditions: 44 active listings in the ZIP; 224 units permitted in Shenandoah County in 2024 (0 in 5+ unit buildings).
Forward outlook
- In year one you build about $29k of equity ($2k loan paydown + $27k appreciation (10.0% local appreciation)).
- Shenandoah County population projected at +5% by 2050 — modest demand growth; plan on rents tracking national, not racing it.
- By year 2, paydown + projected appreciation supports a ~$47k cash-out refi (75% LTV) — recoverable capital for the next deal without selling this one.
Negotiation context
- It's been on market 80 days — a 6% lower offer ($258k) is reasonable based on typical stale-listing flexibility.
- 2 sale attempts; this cycle's ask has dropped $20k (7%) from the opening price — seller is motivated, your offer sets the floor, not the list.
Risks & watch-outs
- Watch-outs: flood insurance adds $56/mo.
- Climate carrying-cost: severe flood risk; moderate wildfire risk; extreme-heat days projected 8→21/yr by 2055 (HVAC capex compounding) — expect insurance premiums to compound above CPI over the hold.
Questions for the listing agent
- What do current leases actually rent for vs. the listed asking? Can we see a recent rent roll and the last 12 months of T-12 income?
- It's been on market 80 days. Have you received any prior offers? Is the seller open to a 58% concession, seller financing, or rate buy-down credit?
- Built in 1960 — when were the roof, HVAC, electrical panel, plumbing, and water heater last replaced?
- What's the actual annual flood-insurance premium (NFIP or private), and is the property in a SFHA with mandatory coverage?
- Why hasn't it sold? Are there any deal-killer items the seller is aware of (foundation, flood, title, zoning, code violations)?
- Is there a deadline driving the sale (1031 exchange, divorce, estate, relocation)? That informs how much negotiation room exists.
- Schools are D-rated, which usually means shorter tenancies and higher turnover. Who's the typical renter profile here, and what's been the actual vacancy rate?
- The area grade is low — what's the realistic commute time and amenity access for the typical tenant pool here? Any planned neighborhood developments (good or bad) we should know about?
- What's the average days-on-market for RENTAL listings here right now (not sales)? A rising rental-DOM trend means longer vacancies and softer asking-rent achievability than the comps imply.
- What's the recent tenant-quality profile in this submarket — average credit score on applications, eviction rate, late-payment / NSF rate, and stable-employment percentage? A property-management company in the area should have these aggregated.
- How much new for-sale + rental construction is in the pipeline within 1–3 miles? Heavy new supply typically softens prices + rents 12–24 months out; constrained supply supports both.
Investment metrics
- 1% rule
- 0.42% ✗
- Cap rate
- 3.04%
- Cash-on-cash
- -11.61%
- DSCR
- 0.48
- GRM
- 20.0
CMA / ARV
- ARV (median comp)
- $336,610
- List price
- $274,000
- Delta
- -15.63%
- Verdict
- UNDERPRICED
- Comps
- 2 within 1.0 mi
Projected returns pro-forma
10.0% appreciation · 3.0% rent growth · sell at horizon
- IRR
- 15.6%
- Equity multiple
- 2.28×
- Total profit
- $98,312
- Equity at exit
- $246,841
- IRR
- 15.1%
- Equity multiple
- 5.29×
- Total profit
- $329,266
- Equity at exit
- $532,322
Cash invested: $76,720 (down + closing). Projections, not guarantees.
Landlord ↔ Tenant lean methodology
- Overall (STATE)
- 55 Moderately Landlord-Leaning
- State Virginia
- 55 Moderately Landlord-Leaning · D+2
- County
- — inherits STATE
- City
- — inherits STATE
ZIP-level market 22824
- Home prices YoY
- 8.9%
- Active inventory
- 44
- Price-to-rent
- 20.0×
Monthly cashflow live
- Estimated rent
- $1,140 medium interval (Pro) →
- Mortgage (P&I)
- −$1,437
- Tax from tax record
- −$91 /mo · $1,098/yr
- Insurance
- −$114
- Flood insurance flood zone
- −$56 /mo · $666/yr
- HOA
- −$0
- Vacancy / Maint / Mgmt
- −$239
- Net cashflow
- $-798
Break-even live
Sensitivity live
| Price | -10% $-643 | -5% $-720 | +0% $-798 | +5% $-875 | +10% $-953 |
|---|---|---|---|---|---|
| Rent | -10% $-888 | -5% $-843 | +0% $-798 | +5% $-753 | +10% $-708 |
| Rate | -1.0pp $-660 | -0.5pp $-728 | base $-798 | +0.5pp $-869 | +1.0pp $-941 |
UW: 25.0% down · 7.5% · 30yr · 1.5% tax · 5.0% vac · 8.0% maint · 8.0% mgmt
Financing live
Cash to close
- Down payment
- $68,500
- Closing costs
- $8,220
- Reserves months
- —
- Total cash needed
- —
Loan-product check · same deal, 3 products live
Conventional
25% down · 7.5% · 30yr
- Down + closing
- —
- Monthly P&I
- —
- Monthly cashflow
- —
- DSCR
- —
- Eligible?
- —
Personal DTI + credit; lowest rate.
DSCR
20% down · 8.5% · 30yr
- Down + closing
- —
- Monthly P&I
- —
- Monthly cashflow
- —
- DSCR
- —
- Eligible?
- —
No personal income docs; deal must DSCR.
Hard money
10% down · 12.0% · 12mo
- Down + closing
- —
- Monthly P&I
- —
- Monthly cashflow
- —
- DSCR
- —
- Eligible?
- —
Short-term bridge; refi at stabilization.
Listing history 20 events
-
2026-06-21pricedays on market $274,000 Active 80 DOM
-
2026-06-18days on market $284,000 Active 77 DOM
-
2026-06-17days on market $284,000 Active 76 DOM
-
2026-06-16days on market $284,000 Active 75 DOM
-
2026-06-15days on market $284,000 Active 74 DOM
-
2026-06-13days on market $284,000 Active 72 DOM
-
2026-06-13days on market $284,000 Active 71 DOM
-
2026-06-09days on market $284,000 Active 68 DOM
-
2026-06-08days on market $284,000 Active 67 DOM
-
2026-06-07days on market $284,000 Active 66 DOM
-
2026-06-04days on market $284,000 Active 63 DOM
-
2026-06-03days on market $284,000 Active 62 DOM
-
2026-06-02days on market $284,000 Active 61 DOM
-
2026-06-01days on market $284,000 Active 60 DOM
-
2026-05-31days on market $284,000 Active 59 DOM
-
2026-04-02$294,000 Active 860-char remark
Show marketing remark (860 chars)
Discover the charm at 191 Hideaway Farms Rd! Situated on over half an acre with scenic creek frontage, this 2-bedroom, 1-bath home offers approximately 1,680 square feet of living space and the added benefit of no HOA—providing flexibility to make the property your own. Inside, a spacious layout is complemented by two fireplaces, creating a warm and inviting atmosphere perfect for a cozy, woodland setting. The surrounding wooded acreage offers privacy and plenty of room to explore, garden, or simply enjoy peaceful outdoor living. Conveniently located in Edinburg, just minutes from I-81 and Route 11, this property combines rural charm with easy access to nearby amenities. Outdoor enthusiasts will appreciate the close proximity to Taskers Gap and the George Washington National Forest, offering endless opportunities for recreation and adventure.
-
2026-03-31historical $294,000 860-char remark
Show marketing remark (860 chars)
Discover the charm at 191 Hideaway Farms Rd! Situated on over half an acre with scenic creek frontage, this 2-bedroom, 1-bath home offers approximately 1,680 square feet of living space and the added benefit of no HOA—providing flexibility to make the property your own. Inside, a spacious layout is complemented by two fireplaces, creating a warm and inviting atmosphere perfect for a cozy, woodland setting. The surrounding wooded acreage offers privacy and plenty of room to explore, garden, or simply enjoy peaceful outdoor living. Conveniently located in Edinburg, just minutes from I-81 and Route 11, this property combines rural charm with easy access to nearby amenities. Outdoor enthusiasts will appreciate the close proximity to Taskers Gap and the George Washington National Forest, offering endless opportunities for recreation and adventure.
-
2025-12-24historical
-
2025-10-07price $299,000
-
2025-06-05$325,000 Active
ⓘ Source: listings_history table (triggers on properties + properties_extension) + one-shot
backfill from property_details.listing_events for pre-trigger history.
Tax reassessment forecast VA · Resets to sale price
- Current annual tax
- $1,098 · $91/mo
- Projected year-2 tax
- $2,247 · $187/mo
- Expected delta
- +$1,149/yr (+$96/mo · 104.7%)
ⓘ Screening estimate from a state-policy table — verify with the county assessor before closing.
Climate risk First Street
- Flood 10/10 Extreme FEMA zone X (unshaded) · 99% chance over 30 yrs
- Wildfire 5/10 Major
- Heat 5/10 Major 8 d/yr ≥97°F today · 21 d/yr by 30 yrs out
- Wind 2/10 Low 100% chance of damaging wind over 30 yrs
- Air quality 1/10 Low 0 unhealthy d/yr today · 0 by 30 yrs out
Nearby sold comps map
Loading sold comps map…
Walkable amenities ~0.75 mi
Loading nearby amenities…
Taxation est. · year 1
- Rental income
- $13,675
- − Mortgage interest
- −$15,348
- − Property taxes
- −$1,098
- − Insurance
- −$2,036
- − Repairs & maintenance
- −$1,094
- − Management
- −$1,094
- − Depreciation
- −$7,971
- Taxable loss
- −$14,967
- Est. tax savings @ 24.0%
- +$3,592
- After-tax cash flow
- $-5,982/yr
For passive investors: Depreciation is non-cash, so a rental often shows a tax loss while cash-flowing — sheltering income. Rental losses are passive: they offset passive income freely, and up to $25,000/yr can offset ordinary (W-2) income if you actively participate and your MAGI is under $100k (phasing out to $0 by $150k); unused losses carry forward. On sale, claimed depreciation is recaptured at up to 25%, and gains may owe capital-gains tax (a 1031 exchange can defer both). Figures are a year-1 estimate at your 24.0% rate — not tax advice; consult a CPA.
Schools (NCES district)
- District
- Shenandoah County Public School District
- NCES district ID
- 5103510
- Math proficiency
- 46% ▼ -30.00%
- Reading proficiency
- 58% ▼ -9.00%
- Median HH income
- $50,207
- Composite
- 44.42/100
- National rank
- #2811
- State rank
- #91 of 131 in VA
Livability — Edinburg
- Score
- 67/100
- State rank
- #294
- US rank
- #10446
Category grades
Schools grade is shown separately in the Schools card above.
Census & demographics
- Population (ZIP)
- 6,061
Population outlook (Shenandoah County) Hauer SSP2
- Today (2025)
- 44,891 people
- By 2030
- 45,630 · +1.6%
- By 2040
- 46,708 · +4.0%
- By 2050
- 47,072 · +4.9%
- By 2075
- 47,418 · +5.6%
- By 2100
- 43,707 · -2.6%
Race, ethnicity, and origin ACS 2023
- Neighborhood character
- Predominantly White (85%)
- Race & ethnicity
- White 85% Hispanic / Latino 9% Two or more races 6% Black 3%
- Hispanic origin (detail)
- Mexican 6% Puerto Rican 2%
- Common ancestry
- Italian 9% Slovak 4% Iranian 2%
- Foreign-born
- 6% · Canada
- Languages at home
- 90% English-only · Spanish 8% French/Haitian/Cajun 1%
Political lean MEDSL · Shenandoah
- 2024 margin
- Solid R (+42.2) · D 28.4% · R 70.6% · Other 1.0%
- 2008→2024 swing
- -15.8pp toward R · 2008: -26.5pp · 2024: -42.2pp
- All cycles
- 2024: R+42.2 2020: R+40.6 2016: R+43.3 2012: R+31.4 2008: R+26.5
Not yet ingested
- Civics
- —
Market trends
- HPI YoY
- ▲ 27.98%
- Current HPI
- 342.2967
- Rent YoY
- —
- Metro
- —
- State GDP YoY
- ▲ 2.40%
- F500 in state
- 50
Industry mix (Fortune 500 HQ in VA)
| Industry | F500 HQs | Revenue |
|---|---|---|
| Aerospace / Defense | 4 | $236B |
|
||
| Technology / Defense | 3 | $32B |
|
||
| Financial Services | 2 | $176B |
|
||
| Utilities | 2 | $27B |
|
||
| Insurance | 2 | $25B |
|
||
| Technology | 2 | $15B |
|
||
Price history
-9.5% since first listed5 events — show timeline
- 2026-04-02 Listed $294,000 BRIGHT MLS
- 2026-03-31 Coming Soon $294,000 BRIGHT MLS
- 2025-12-24 Listing Removed — BRIGHT MLS
- 2025-10-07 Price Changed $299,000 BRIGHT MLS
- 2025-06-05 Listed $325,000 BRIGHT MLS
Property tax history
+4.2%/yrLatest (2025): $1,098 · +0.0% YoY. Source: county tax records.
Cash-flow waterfall
monthlySold comps — $/sqft
last 12 mo · ≤1 miLoading sold comps…