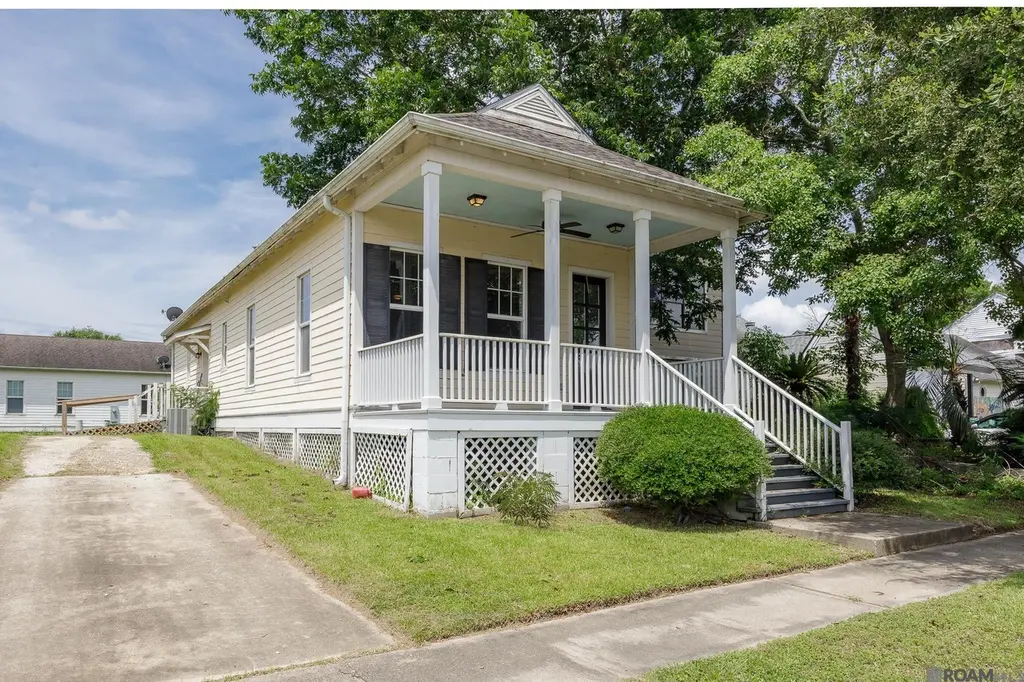
9352 Martinique Dr · Gardere, LA
Flood risk 7/10 · Major
- FEMA flood zone
- X
- Chance of flooding over 30 yrs
- 0.99%
- Est. flood insurance / yr
- $507 – $1,088
Fire risk 1/10 · Minimal
- Est. fire insurance / yr
- $1,269 – $2,357
Heat risk 8/10 · Major
- Hot days now (above 108°F)
- 7 days/yr
- Hot days in 30 yrs
- 22 days/yr
Wind risk 9/10 · Severe
- Chance of severe wind over 30 yrs
- 99.0%
Air-quality risk 2/10 · Minimal
- Unhealthy air days now
- 1 days/yr
- Unhealthy air days in 30 yrs
- 2 days/yr
Risk factors via First Street. Map © Google.
Why this score? — see what drove the D- grade
The composite is a weighted blend of 9 inputs, each scored 0–100. Each bar is that input's sub-score; the figure is the points it added to the 100-point composite (weight × sub-score).
- Cash flow +17.1/30.0
- DSCR +5.3/10.0
- 1% rule +4.1/10.0
- Livability +3.2/5.0
- Rent growth +2.7/5.0
- Condition / age +2.5/5.0
- Schools +2.4/10.0
- ARV discount +0.0/15.0
- Appreciation +0.0/10.0
$142,000
🖨 Deal sheet (PDF) 📄 Offer letter ✓ Due diligence
Listing remarks MLS
Come See this cute updated New Orleans style home!! This home would be great for first timers, down graders and/or investors for a rental or an airbnb
Key facts
- 6,098 sq ft lot
- 2 parking spots
- Built 2006
Property features AI
Exterior
- Parking: 2 parking spaces
- Utilities: Public water; Public sewer; Cable connected
- Home design: Detached single-family residence; Residential property
- Construction: Cement siding; Other construction materials; Pillar/post/pier foundation; Built as single-story (entry level not specified)
- Exterior features: Rectangular lot
Interior
- Kitchen: Dishwasher
- Flooring: Laminate flooring
- Bathrooms: 2 full bathrooms
- Heating & cooling: Central heating; Central air conditioning
- Interior features: Eat-in kitchen; Porch
- Laundry & utility: Laundry room
Neighborhood map
What this means for you Summary
Snapshot
- This is a 3-bed/2.0-bath single-family listed at $142k.
Deal economics
- At list price, monthly cash flow is $33 ($392/yr) — positive.
- The deal already cash-flows at list — no discount required.
- To meet the 1% rule (rent ≥ 1% of price), the offer needs to be $129k (9.4% below list).
- Recommended offer: $129k (9.4% below list) — sets the bar for 1% rule.
- Cap rate 7.1% vs local median 4.2% in Gardere — top-decile yield for the area; either an underpriced asset or a hidden risk that comps aren't pricing in. Stress-test before assuming the spread holds.
Location & tenants
- Location reads 64/100 on livability (#167 in LA) — a middle-class / working-renter tenant base. Strengths: cost of living A, housing A; Watch: crime D, employment D, amenities F.
- East Baton Rouge Parish (urban): math 22% / reading 34% proficiency, ranked #47 of 98 in LA (top 48%) — low school quality limits family demand, transient renter base, plan for 1-2y turnover; 77% free/reduced lunch — lower-income household profile, screen leases tightly.
- Zoned schools: Magnolia Woods Elementary School (math 19% / reading 28%, grade F, #406 of 646 statewide, top 63%, 528 students, 79% FRL); Westdale Middle School (math 15% / reading 30%, grade F, #151 of 218 statewide, top 70%, 757 students, 69% FRL); Liberty High School (math 50% / reading 74%, grade B-, #15 of 265 statewide, top 6%, 1,208 students, 60% FRL).
- Market conditions: Rents flat; 629 active listings in the ZIP; 40 comparable units currently listed for rent nearby; rentals at typical pace (median 26d on market — plan ~3-4 weeks tenant-placement turnaround); 48% of comp listings sitting > 30 days — soft ceiling on asking rent; solid renter incomes; 2,252 units permitted in East Baton Rouge Parish in 2024 (440 in 5+ unit buildings).
- This rent is only 17% of the median local income ($92k/yr) — well below the 30% rent-burden line; pricing power to push rent on renewal without tenant pushback.
Forward outlook
- Local home prices are declining (-3.0%/yr); year-one equity from $982 of loan paydown is wiped out by about $4k of value loss. Plan a longer hold.
- East Baton Rouge County population projected at +4% by 2050 — modest demand growth; plan on rents tracking national, not racing it.
Negotiation context
- Only 5 days on market — expect competitive offers; lowballing is unlikely to land.
- 4 sale attempts since 6y ago with the ask held roughly flat each time — persistent listings suggest the price (not the market) is what's stuck; bring a comps-based counter.
- Current owner paid $110k; 29% above their basis — modest negotiation headroom, anchor on the comps not their cost.
Risks & watch-outs
- Watch-outs: flood insurance adds $66/mo.
- Climate carrying-cost: major flood risk; severe wind risk, 99% chance of damaging wind over 30y; extreme-heat days projected 7→22/yr by 2055 (HVAC capex compounding) — expect insurance premiums to compound above CPI over the hold.
Questions for the listing agent
- What's the actual annual flood-insurance premium (NFIP or private), and is the property in a SFHA with mandatory coverage?
- Is there a deadline driving the sale (1031 exchange, divorce, estate, relocation)? That informs how much negotiation room exists.
- Crime grade is D in this area — have there been break-ins, vandalism, or insurance claims at this property in the last 3 years? What carrier currently insures it and at what premium?
- The area grade is low — what's the realistic commute time and amenity access for the typical tenant pool here? Any planned neighborhood developments (good or bad) we should know about?
- What's the average days-on-market for RENTAL listings here right now (not sales)? A rising rental-DOM trend means longer vacancies and softer asking-rent achievability than the comps imply.
- What's the recent tenant-quality profile in this submarket — average credit score on applications, eviction rate, late-payment / NSF rate, and stable-employment percentage? A property-management company in the area should have these aggregated.
- How much new for-sale + rental construction is in the pipeline within 1–3 miles? Heavy new supply typically softens prices + rents 12–24 months out; constrained supply supports both.
Investment metrics
- 1% rule
- 0.91% ✗
- Cap rate
- 7.13%
- Cash-on-cash
- 2.99%
- DSCR
- 1.13
- GRM
- 9.2
CMA / ARV
- ARV (on-the-fly)
- $120,960
- Comps found
- 12
Show comp detail 12 sales within ~0.75 mi
| Address | Dist | Beds/Ba | Sqft | Sold | Price | $/sf | Match |
|---|---|---|---|---|---|---|---|
| 2239 St Croix Ave | 0.04mi | 3/2.0 | 1,112 (+3%) | 5mo | $125,000 | $112 | 89 |
| 2167 St Croix Ave | 0.04mi | 3/2.0 | 1,112 (+3%) | 12mo | $125,000 | $112 | 83 |
| 9390 Pascagoula Dr | 0.06mi | 3/2.0 | 1,112 (+3%) | 15mo | $125,000 | $112 | 80 |
| 9351 Bimini Dr | 0.08mi | 3/2.0 | 1,112 (+3%) | 16mo | $125,000 | $112 | 78 |
| 9398 Pascagoula Dr | 0.06mi | 2/2.0 (-1) | 1,100 (+2%) | 20mo | $3,000 | $3 | 72 |
| 1832 Elvin Dr | 0.21mi | 3/2.0 | 1,112 (+3%) | 20mo | $1,400 | $1 | 69 |
| 1835 General Cleburne Ave | 0.30mi | 2/1.0 (-1) | 1,105 (+2%) | 8mo | $92,000 | $83 | 66 |
| 1835 Fountain Ave | 0.54mi | 2/2.0 (-1) | 1,150 (+6%) | 1mo | $155,000 | $135 | 58 |
| 9555 Old Hermitage Pkwy | 0.55mi | 3/2.0 | 1,200 (+11%) | 1mo | $235,000 | $196 | 55 |
| 2144 General Mouton Ave | 0.22mi | 3/2.0 | 1,210 (+12%) | 19mo | $180,000 | $149 | 54 |
| 2279 St Croix Ave | 0.06mi | 2/1.5 (-1) | 936 (-13%) | 19mo | $118,000 | $126 | 52 |
| 2131 Fountain Ave | 0.53mi | 2/2.0 (-1) | 1,155 (+7%) | 19mo | $124,700 | $108 | 43 |
Match score weights: distance 35% · size 25% · config 20% · recency 20%. Top-matched comps best support the ARV.
Projected returns pro-forma
-3.0% appreciation · 0.68% rent growth · sell at horizon
- IRR
- -17.4%
- Equity multiple
- 0.40×
- Total profit
- $-23,842
- Equity at exit
- $21,173
- IRR
- -14.4%
- Equity multiple
- 0.26×
- Total profit
- $-29,493
- Equity at exit
- $12,278
Cash invested: $39,760 (down + closing). Projections, not guarantees.
Landlord ↔ Tenant lean methodology
- Overall (STATE)
- 90 Strongly Landlord-Friendly
- State Louisiana
- 90 Strongly Landlord-Friendly · R+12
- County
- — inherits STATE
- City
- — inherits STATE
ZIP-level market 70810
- Rents YoY
- 0.7%
- Active inventory
- 629
- Price-to-rent
- 9.2×
Monthly cashflow live
- Estimated rent
- $1,287 high interval (Pro) →
- Mortgage (P&I)
- −$745
- Tax from tax record
- −$113 /mo · $1,361/yr
- Insurance
- −$59
- Flood insurance flood zone
- −$66 /mo · $798/yr
- HOA
- −$0
- Vacancy / Maint / Mgmt
- −$270
- Net cashflow
- $33
Break-even live
Sensitivity live
| Price | -10% $113 | -5% $73 | +0% $33 | +5% $-7 | +10% $-48 |
|---|---|---|---|---|---|
| Rent | -10% $-69 | -5% $-18 | +0% $33 | +5% $84 | +10% $134 |
| Rate | -1.0pp $104 | -0.5pp $69 | base $33 | +0.5pp $-4 | +1.0pp $-42 |
UW: 25.0% down · 7.5% · 30yr · 1.5% tax · 5.0% vac · 8.0% maint · 8.0% mgmt
Financing live
Cash to close
- Down payment
- $35,500
- Closing costs
- $4,260
- Reserves months
- —
- Total cash needed
- —
Loan-product check · same deal, 3 products live
Conventional
25% down · 7.5% · 30yr
- Down + closing
- —
- Monthly P&I
- —
- Monthly cashflow
- —
- DSCR
- —
- Eligible?
- —
Personal DTI + credit; lowest rate.
DSCR
20% down · 8.5% · 30yr
- Down + closing
- —
- Monthly P&I
- —
- Monthly cashflow
- —
- DSCR
- —
- Eligible?
- —
No personal income docs; deal must DSCR.
Hard money
10% down · 12.0% · 12mo
- Down + closing
- —
- Monthly P&I
- —
- Monthly cashflow
- —
- DSCR
- —
- Eligible?
- —
Short-term bridge; refi at stabilization.
Rent comps 40 comps
| Address | Beds | Baths | Sqft | Rent | $/sqft | DOM | Units | Dist |
|---|---|---|---|---|---|---|---|---|
| 1934 Elvin Dr Baton Rouge, LA | 3.0 | 2.0 | 1112 | $1,600 | $1.44 | 45d | 1 | 0.18mi |
| 2934 Nicholson Lake Dr Baton Rouge, LA | 3.0 | 2.0 | 1500 | $2,000 | $1.33 | 45d | 1 | 0.38mi |
| 2934 Nicholson Lake Dr Baton Rouge, LA | 3.0 | 2.0 | 1500 | $2,000 | $1.33 | 25d | 1 | 0.38mi |
| 3111 Nicholson Lake Dr Baton Rouge, LA | 3.0 | 2.0 | 1468 | $2,000 | $1.36 | 23d | 1 | 0.45mi |
| 2705 Amanda Dr Unit A Baton Rouge, LA | 2.0 | 2.0 | 972 | $800 | $0.82 | 16d | 1 | 0.46mi |
| 8526 Leake Ave Unit 8526-D Baton Rouge, LA | 2.0 | 2.0 | 974 | $900 | $0.92 | 45d | 1 | 0.54mi |
| 2038 Jasper Ave Unit GM 2038-C Baton Rouge, LA | 2.0 | 1.5 | 1100 | $900 | $0.82 | 45d | 1 | 0.55mi |
| 2182 Gardere Ln Unit B Baton Rouge, LA | 2.0 | 2.0 | 1000 | $800 | $0.80 | 25d | 1 | 0.56mi |
| 11959 Nicholson Dr Baton Rouge, LA | 1.0–3.0 | 1.0–2.0 | 1092 | $1,678 | $1.54 | 16d | 6 | 0.57mi |
| 2265 Anne Marie Dr Unit D Baton Rouge, LA | 2.0 | 2.0 | 972 | $800 | $0.82 | 45d | 1 | 0.58mi |
| 2029 Jasper Ave Unit 2029-D Baton Rouge, LA | 3.0 | 2.0 | 1350 | $1,200 | $0.89 | 46d | 1 | 0.59mi |
| 2029 Jasper Ave Unit 2029-B Baton Rouge, LA | 3.0 | 2.0 | 1350 | $1,250 | $0.93 | 25d | 1 | 0.59mi |
| 8726 Elvin Dr Unit B Baton Rouge, LA | 2.0 | 1.5 | 1300 | $1,800 | $1.38 | 45d | 1 | 0.60mi |
| 8726 Elvin Dr Unit B Baton Rouge, LA | 2.0 | 1.5 | 1300 | $1,800 | $1.38 | 25d | 1 | 0.60mi |
| 8736 Elvin Dr Unit A Baton Rouge, LA | 2.0 | 1.5 | 1140 | $1,100 | $0.96 | 45d | 1 | 0.61mi |
| 8736 Elvin Dr Unit C Baton Rouge, LA | 2.0 | 1.5 | 1140 | $1,100 | $0.96 | 25d | 1 | 0.61mi |
| 2266 Anne Marie Dr Unit B Baton Rouge, LA | 2.0 | 2.0 | 1000 | $900 | $0.90 | 45d | 1 | 0.61mi |
| 2266 Anne Marie Dr Unit C Baton Rouge, LA | 2.0 | 2.0 | 1000 | $750 | $0.75 | 45d | 1 | 0.61mi |
| 2266 Anne Marie Dr Unit C Baton Rouge, LA | 2.0 | 2.0 | 1000 | $850 | $0.85 | 16d | 1 | 0.61mi |
| 8425 Ned Ave Unit D Baton Rouge, LA | 2.0 | 2.0 | 970 | $875 | $0.90 | 45d | 1 | 0.62mi |
| 1646 Jade Ave Unit GM 1646-D Baton Rouge, LA | 2.0 | 1.5 | 1100 | $900 | $0.82 | 16d | 1 | 0.63mi |
| 1646 Jade Ave Unit GM 1646-C Baton Rouge, LA | 2.0 | 1.5 | 1100 | $850 | $0.77 | 45d | 1 | 0.63mi |
| 1616 Jade Ave Baton Rouge, LA | 2.0 | 1.5 | 1000 | $900 | $0.90 | 25d | 1 | 0.63mi |
| 2059 Mariner Dr Unit 2059-20 Baton Rouge, LA | 2.0 | 2.0 | 950 | $925 | $0.97 | 25d | 1 | 0.65mi |
| 1717 Jade Ave Unit 2 Gardere, LA | 2.0 | 1.5 | 1000 | $900 | $0.90 | 45d | 1 | 0.66mi |
| 1717 Jade Ave Unit 1 Baton Rouge, LA | 2.0 | 1.5 | 1000 | $900 | $0.90 | 25d | 1 | 0.66mi |
| 8724 GSRI Ave Unit 8724-B Baton Rouge, LA | 2.0 | 1.0 | 853 | $950 | $1.11 | 16d | 1 | 0.68mi |
| 8723 GSRI Ave Unit 8723-B Baton Rouge, LA | 2.0 | 1.0 | 853 | $950 | $1.11 | 23d | 1 | 0.71mi |
| 1434 Jasper Ave Baton Rouge, LA | 2.0 | 1.5 | 1000 | $800 | $0.80 | 45d | 1 | 0.77mi |
| 8234 Keel Ave Baton Rouge, LA | 3.0 | 2.0 | 1000 | $1,000 | $1.00 | 45d | 1 | 0.78mi |
| 1773 Starboard Dr Unit 1773-1 Baton Rouge, LA | 2.0 | 1.5 | 1100 | $995 | $0.90 | 21d | 1 | 0.78mi |
| 8246 Ned Ave Apt C Baton Rouge, LA | 2.0 | 2.0 | 990 | $750 | $0.76 | 25d | 1 | 0.80mi |
| 8911 GSRI Ave Baton Rouge, LA | 2.0 | 2.0 | 1100 | $1,150 | $1.05 | 45d | 1 | 0.82mi |
| 8215 Skysail Ave Baton Rouge, LA | 2.0 | 2.0 | 1000 | $750 | $0.75 | 25d | 1 | 0.84mi |
| 8727 Granite Dr Unit 8727-C Baton Rouge, LA | 2.0 | 1.5 | 1100 | $940 | $0.85 | 21d | 1 | 0.86mi |
| 8225 Ned Ave Unit 8225-C Baton Rouge, LA | 2.0 | 2.0 | 970 | $950 | $0.98 | 46d | 1 | 0.86mi |
| 1658 Starboard Dr Unit 1658-C Baton Rouge, LA | 2.0 | 1.5 | 1100 | $850 | $0.77 | 16d | 1 | 0.86mi |
| 9250 Pecan Tree Dr Baton Rouge, LA | 3.0 | 2.0 | 1291 | $1,650 | $1.28 | 25d | 1 | 0.87mi |
| 1711 Mast Dr Unit 1711-4 Baton Rouge, LA | 3.0 | 2.5 | 1185 | $1,100 | $0.93 | 46d | 1 | 0.87mi |
| 1648 Starboard Dr Apt C Baton Rouge, LA | 2.0 | 1.0 | 980 | $850 | $0.87 | 45d | 1 | 0.87mi |
Listing history 5 events
-
2026-06-17status $142,000 Pending 5 DOM
-
2026-06-16days on market $142,000 Active 5 DOM
-
2026-06-15days on market $142,000 Active 4 DOM
-
2026-06-14remarks 150-char remark
-
2026-06-14$142,000 Active 2 DOM
ⓘ Source: listings_history table (triggers on properties + properties_extension) + one-shot
backfill from property_details.listing_events for pre-trigger history.
Tax reassessment forecast LA · Resets to sale price
- Current annual tax
- $1,361 · $113/mo
- Projected year-2 tax
- $1,361 · $113/mo
- Expected delta
- $0/yr ($0/mo · 0.0%)
ⓘ Screening estimate from a state-policy table — verify with the county assessor before closing.
Climate risk First Street
- Flood 7/10 Severe FEMA zone X · 99% chance over 30 yrs
- Wildfire 1/10 Low
- Heat 8/10 Severe 7 d/yr ≥108°F today · 22 d/yr by 30 yrs out
- Wind 9/10 Extreme 99% chance of damaging wind over 30 yrs
- Air quality 2/10 Low 1 unhealthy d/yr today · 2 by 30 yrs out
Nearby sold comps map
Loading sold comps map…
Walkable amenities ~0.75 mi
Loading nearby amenities…
Taxation est. · year 1
- Rental income
- $15,439
- − Mortgage interest
- −$7,954
- − Property taxes
- −$1,361
- − Insurance
- −$1,508
- − Repairs & maintenance
- −$1,235
- − Management
- −$1,235
- − Depreciation
- −$4,131
- Taxable loss
- −$1,985
- Est. tax savings @ 24.0%
- +$476
- After-tax cash flow
- $869/yr
For passive investors: Depreciation is non-cash, so a rental often shows a tax loss while cash-flowing — sheltering income. Rental losses are passive: they offset passive income freely, and up to $25,000/yr can offset ordinary (W-2) income if you actively participate and your MAGI is under $100k (phasing out to $0 by $150k); unused losses carry forward. On sale, claimed depreciation is recaptured at up to 25%, and gains may owe capital-gains tax (a 1031 exchange can defer both). Figures are a year-1 estimate at your 24.0% rate — not tax advice; consult a CPA.
Schools (NCES district)
- District
- East Baton Rouge Parish
- NCES district ID
- 2200540
- Math proficiency
- 22% ▼ -36.00%
- Reading proficiency
- 34% ▼ -31.00%
- Median HH income
- $46,263
- Composite
- 24.14/100
- National rank
- #7745
- State rank
- #47 of 98 in LA
Livability — Gardere
- Score
- 64/100
- State rank
- #167
- US rank
- #14008
Category grades
Schools grade is shown separately in the Schools card above.
Census & demographics
- Census place
- Gardere, LA
- County
- East Baton Rouge Parish · 399,686 people
- Metro
- Baton Rouge, LA
- Population (ZIP)
- 42,659
- Household income
- $92,098
- Rent vs Own
- Severe rent burden
- 1106.0
Population outlook (East Baton Rouge County) Hauer SSP2
- Today (2025)
- 464,810 people
- By 2030
- 472,137 · +1.6%
- By 2040
- 480,243 · +3.3%
- By 2050
- 484,422 · +4.2%
- By 2075
- 492,069 · +5.9%
- By 2100
- 476,347 · +2.5%
Race, ethnicity, and origin ACS 2023
- Neighborhood character
- Diverse neighborhood (Simpson 0.60)
- Race & ethnicity
- White 55% Black 29% Hispanic / Latino 7% Two or more races 6% Asian 6%
- Hispanic origin (detail)
- Mexican 1%
- Common ancestry
- Lithuanian 11% Slovak 2% Scottish 1%
- Foreign-born
- 9% · Canada, China, South Korea
- Languages at home
- 89% English-only · Spanish 4% Other Indo-European 2% Chinese 1%
Political lean MEDSL · East Baton Rouge
- 2024 margin
- D (+11.1) · D 54.5% · R 43.4% · Other 2.1%
- 2008→2024 swing
- +8.9pp toward D · 2008: 2.2pp · 2024: 11.1pp
- All cycles
- 2024: D+11.1 2020: D+13.1 2016: D+9.2 2012: D+5.2 2008: D+2.2
Not yet ingested
- Civics
- —
Market trends
- HPI YoY
- ▼ -117.55%
- Current HPI
- 172.7593
- Rent YoY
- ▲ 0.68%
- Metro
- Baton Rouge, LA
- State GDP YoY
- ▲ 3.29%
- F500 in state
- 10
Industry mix (Fortune 500 HQ in LA)
| Industry | F500 HQs | Revenue |
|---|---|---|
| Telecommunications | 2 | $23B |
|
||
| Utilities | 1 | $12B |
|
||
| Wholesale / Distribution | 1 | $5B |
|
||
| Advertising | 1 | $2B |
|
||
Price history
+23.5% since first listed8 events — show timeline
- 2026-06-11 Listed $142,000 AcadianaMLS
- 2026-06-11 Listed $142,000 GBRMLS
- 2021-06-24 Sold (Public Records) $110,000 Public Records
- 2021-06-23 Sold (MLS) — GBRMLS
- 2021-03-25 Pending — GBRMLS
- 2021-02-20 Price Changed $110,000 GBRMLS
- 2020-02-20 Listed $110,000 AcadianaMLS
- 2020-02-20 Listed $115,000 GBRMLS
Property tax history
+3.5%/yrLatest (2025): $1,361 · -0.4% YoY. Source: county tax records.
Cash-flow waterfall
monthlySold comps — $/sqft
last 12 mo · ≤1 miLoading sold comps…