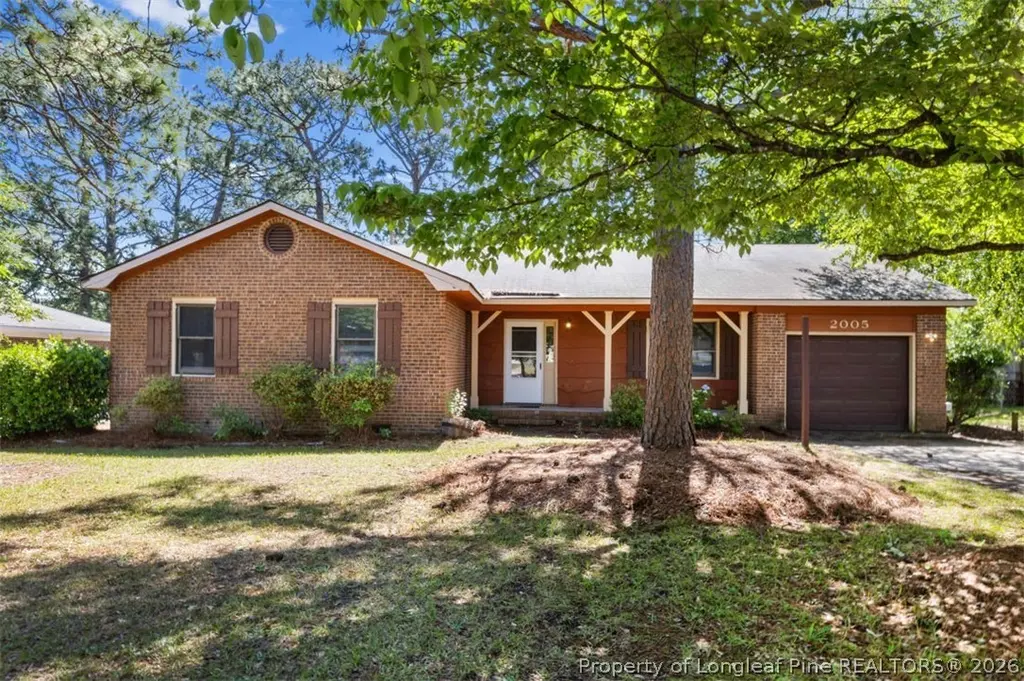
2005 Dockside Dr · Fayetteville, NC
Flood risk 1/10 · Minimal
- FEMA flood zone
- X (unshaded)
- Chance of flooding over 30 yrs
- 0.0%
- Est. flood insurance / yr
- $507 – $1,088
Fire risk 4/10 · Minor
- Est. fire insurance / yr
- $906 – $1,684
Heat risk 7/10 · Major
- Hot days now (above 107°F)
- 7 days/yr
- Hot days in 30 yrs
- 16 days/yr
Wind risk 7/10 · Major
- Chance of severe wind over 30 yrs
- 78.0%
Air-quality risk 1/10 · Minimal
- Unhealthy air days now
- 0 days/yr
- Unhealthy air days in 30 yrs
- 0 days/yr
Risk factors via First Street. Map © Google.
Why this score? — see what drove the D+ grade
The composite is a weighted blend of 9 inputs, each scored 0–100. Each bar is that input's sub-score; the figure is the points it added to the 100-point composite (weight × sub-score).
- ARV discount +15.0/15.0
- Cash flow +12.7/30.0
- DSCR +3.8/10.0
- Livability +3.8/5.0
- 1% rule +3.5/10.0
- Rent growth +3.3/5.0
- Schools +3.1/10.0
- Condition / age +2.5/5.0
- Appreciation +0.0/10.0
$199,900
🖨 Deal sheet 📄 Offer letter ✓ Due diligence
Listing remarks
ARRAN LAKES WEST 3-bedroom, 2-bath ranch-style home located in the sought-after Jack Britt School District. The living room features a stone fireplace, creating a warm focal point. The spacious kitchen offers a bay window overlooking the large backyard, bringing in great natural light. A generous designated laundry area adds everyday convenience, and a mix of carpet, hardwood, and vinyl flooring runs throughout the home. Schedule your showing today!
Key facts
- Large backyard
- Bay window
- Stone fireplace
Tags
Property features AI
Finance
- Other: Zoned RR - Rural Residential; Subdivision: Arran Lakes Wes
Exterior
- Parking: Attached garage (1 covered/garage space)
- Utilities: Public water; Public sewer
- Home design: Single-family residence; One-story
- Construction: Brick / brick veneer construction
- Exterior features: Deck; Front porch; Porch; Fenced backyard; Cleared lot
Interior
- Kitchen: Refrigerator; Dishwasher; Range
- Bedrooms: Bedrooms not specifically listed
- Flooring: Hardwood; Vinyl; Carpet
- Bathrooms: 2 full bathrooms
- Heating & cooling: Natural gas heating; Fireplace heating option; Ceiling fans for cooling
- Interior features: Ceiling fans; Eat-in kitchen; Window coverings and blinds; Den with stone fireplace
- Laundry & utility: Laundry in unit on the main level; Crawl space basement
Neighborhood map
What this means for you Summary
Snapshot
- This is a 3-bed/2.0-bath single-family listed at $200k.
Deal economics
- At list price, monthly cash flow is $-22 ($-267/yr) — negative.
- To cash-flow at today's rent, offer at most $196k (2.0% below list).
- To meet the 1% rule (rent ≥ 1% of price), the offer needs to be $169k (15.4% below list).
- Recommended offer: $169k (15.4% below list) — sets the bar for 1% rule.
- Cap rate 6.2% vs local median 4.9% in Fayetteville — meaningfully above typical; check what's discounted (condition, days-on-market, listing class) to confirm the premium yield is real.
Location & tenants
- Location reads 75/100 on livability (#45 in NC, #4,031 nationally) — a middle-class / working-renter tenant base. Strengths: commute A+, cost of living A+, housing A+; Watch: crime F, employment D-.
- Cumberland County Schools (urban): math 32% / reading 41% proficiency, ranked #126 of 178 in NC (top 71%) — families likely to look elsewhere, expect single-tenant / working-renter base with shorter leases.
- Zoned schools: John R Griffin Middle (math 43% / reading 53%, grade C-, #134 of 475 statewide, top 29%, 1,091 students, 40% FRL); Jack Britt High (math 58% / reading 72%, grade B, #161 of 535 statewide, top 30%, 1,890 students, 38% FRL) — zoned schools average 39% FRL vs 55% district-wide (16 pts lower); this property's tenant base skews higher-income than the district average.
- Zoned-school proficiency averages 56% at this address vs 36% district-wide (+20 pts) — the actual schools serving this property are materially stronger than the Cumberland County Schools average implies; a family-tenant draw the district grade alone would hide.
- Market conditions: Rents rising (+3.2%/yr); 302 active listings in the ZIP; 30 comparable units currently listed for rent nearby; rentals at typical pace (median 24d on market — plan ~3-4 weeks tenant-placement turnaround); 1,125 units permitted in Cumberland County in 2024 (104 in 5+ unit buildings).
- This rent runs 35% of the median local income ($59k/yr) — at the standard rent-burdened threshold; future hikes will face affordability resistance.
Forward outlook
- Local home prices are declining (-3.0%/yr); year-one equity from $1k of loan paydown is wiped out by about $6k of value loss. Plan a longer hold.
Negotiation context
- It's been on market 34 days — a 3% lower offer ($194k) is reasonable based on typical stale-listing flexibility.
- 3 sale attempts since 2y ago; this cycle's ask has dropped $15k (7%) from the opening price — seller is motivated, your offer sets the floor, not the list.
- Current owner paid $88k; list at $200k implies a 126% gain — meaningful room to come down on a strong offer.
Risks & watch-outs
- Climate carrying-cost: major wind risk, 78% chance of damaging wind over 30y; extreme-heat days projected 7→16/yr by 2055 (HVAC capex compounding) — expect insurance premiums to compound above CPI over the hold.
Questions for the listing agent
- What do current leases actually rent for vs. the listed asking? Can we see a recent rent roll and the last 12 months of T-12 income?
- It's been on market 34 days. Have you received any prior offers? Is the seller open to a 15% concession, seller financing, or rate buy-down credit?
- Is there a deadline driving the sale (1031 exchange, divorce, estate, relocation)? That informs how much negotiation room exists.
- Crime grade is F in this area — have there been break-ins, vandalism, or insurance claims at this property in the last 3 years? What carrier currently insures it and at what premium?
- The area grade is low — what's the realistic commute time and amenity access for the typical tenant pool here? Any planned neighborhood developments (good or bad) we should know about?
- What's the average days-on-market for RENTAL listings here right now (not sales)? A rising rental-DOM trend means longer vacancies and softer asking-rent achievability than the comps imply.
- What's the recent tenant-quality profile in this submarket — average credit score on applications, eviction rate, late-payment / NSF rate, and stable-employment percentage? A property-management company in the area should have these aggregated.
- How much new for-sale + rental construction is in the pipeline within 1–3 miles? Heavy new supply typically softens prices + rents 12–24 months out; constrained supply supports both.
Investment metrics
- 1% rule
- 0.85% ✗
- Cap rate
- 6.16%
- Cash-on-cash
- -0.48%
- DSCR
- 0.98
- GRM
- 9.8
CMA / ARV
- ARV (on-the-fly)
- $249,832
- Comps found
- 12
Show comp detail 12 sales within ~0.75 mi
| Address | Dist | Beds/Ba | Sqft | Sold | Price | $/sf | Match |
|---|---|---|---|---|---|---|---|
| 2122 Lakeridge Dr | 0.26mi | 3/2.0 | 1,530 (+2%) | 6mo | $224,950 | $147 | 79 |
| 2092 Lakeridge Dr | 0.11mi | 3/2.0 | 1,274 (-15%) | 1mo | $184,000 | $144 | 69 |
| 5909 Waterdale Ct | 0.68mi | 3/2.0 | 1,499 (+0%) | 1mo | $250,000 | $167 | 67 |
| 1824 Rivergate Rd | 0.66mi | 3/2.0 | 1,479 (-1%) | 2mo | $257,000 | $174 | 66 |
| 5908 Gosfield Pl | 0.23mi | 3/2.0 | 1,280 (-14%) | 1mo | $237,000 | $185 | 65 |
| 2132 Calista Cir | 0.61mi | 3/2.5 | 1,543 (+3%) | 1mo | $270,000 | $175 | 64 |
| 6377 Lake Traill Dr | 0.52mi | 3/2.0 | 1,604 (+7%) | 1mo | $258,000 | $161 | 63 |
| 2007 Rottingham Ct | 0.36mi | 3/2.0 | 1,306 (-13%) | 4mo | $240,000 | $184 | 59 |
| 6300 Lake Trail Dr | 0.57mi | 3/2.0 | 1,678 (+12%) | 0mo | $220,000 | $131 | 53 |
| 2241 Dockvale Dr | 0.51mi | 4/2.0 (+1) | 1,673 (+12%) | 1mo | $270,000 | $161 | 51 |
| 5924 Lakeridge Dr | 0.52mi | 3/2.0 | 1,292 (-14%) | 3mo | $219,500 | $170 | 50 |
| 1931 Pumpkin Rd | 0.70mi | 4/2.0 (+1) | 1,363 (-9%) | 2mo | $195,000 | $143 | 46 |
Match score weights: distance 35% · size 25% · config 20% · recency 20%. Top-matched comps best support the ARV.
Projected returns pro-forma
-3.0% appreciation · 3.17% rent growth · sell at horizon
- IRR
- -16.9%
- Equity multiple
- 0.40×
- Total profit
- $-33,507
- Equity at exit
- $29,806
- IRR
- -8.5%
- Equity multiple
- 0.47×
- Total profit
- $-29,761
- Equity at exit
- $17,284
Cash invested: $55,972 (down + closing). Projections, not guarantees.
Landlord ↔ Tenant lean methodology
- Overall (STATE)
- 85 Strongly Landlord-Friendly
- State North Carolina
- 85 Strongly Landlord-Friendly · R+3
- County
- — inherits STATE
- City
- — inherits STATE
ZIP-level market 28304
- Home prices YoY
- -21.7%
- Rents YoY
- 3.2%
- Active inventory
- 302
- Price-to-rent
- 9.8×
Monthly cashflow live
- Estimated rent
- $1,691 high interval (Pro) →
- Mortgage (P&I)
- −$1,048
- Tax from tax record
- −$227 /mo · $2,722/yr
- Insurance
- −$83
- HOA
- −$0
- Vacancy / Maint / Mgmt
- −$355
- Net cashflow
- $-22
Break-even live
UW: 25.0% down · 7.5% · 30yr · 1.5% tax · 5.0% vac · 8.0% maint · 8.0% mgmt
Financing live
Cash to close
- Down payment
- $49,975
- Closing costs
- $5,997
- Reserves months
- —
- Total cash needed
- —
Loan-product check · same deal, 3 products live
Conventional
25% down · 7.5% · 30yr
- Down + closing
- —
- Monthly P&I
- —
- Monthly cashflow
- —
- DSCR
- —
- Eligible?
- —
Personal DTI + credit; lowest rate.
DSCR
20% down · 8.5% · 30yr
- Down + closing
- —
- Monthly P&I
- —
- Monthly cashflow
- —
- DSCR
- —
- Eligible?
- —
No personal income docs; deal must DSCR.
Hard money
10% down · 12.0% · 12mo
- Down + closing
- —
- Monthly P&I
- —
- Monthly cashflow
- —
- DSCR
- —
- Eligible?
- —
Short-term bridge; refi at stabilization.
Rent comps 30 comps
| Address | Beds | Baths | Sqft | Rent | $/sqft | DOM | Units | Dist |
|---|---|---|---|---|---|---|---|---|
| 2012 Lakemeadow Dr Fayetteville, NC | 3.0 | 2.0 | 1332 | $1,800 | $1.35 | 14d | 1 | 0.11mi |
| 2220 Baywater Dr Fayetteville, NC | 3.0 | 2.5 | 1859 | $2,000 | $1.08 | 23d | 1 | 0.28mi |
| 6017 Lakeway Dr Fayetteville, NC | 3.0 | 2.0 | 1709 | $1,750 | $1.02 | 23d | 1 | 0.37mi |
| 2920 Cosmo Dr Fayetteville, NC | 1.0–3.0 | 1.0–2.0 | 918 | $1,505 | $1.64 | 14d | 9 | 0.45mi |
| 2514 Gardner Park Dr Fayetteville, NC | 3.0 | 2.5 | 1480 | $1,595 | $1.08 | 23d | 1 | 0.50mi |
| 1948 Nordic Dr Fayetteville, NC | 3.0 | 2.0 | 1131 | $1,400 | $1.24 | 23d | 1 | 0.75mi |
| 6301 Lakehaven Dr Fayetteville, NC | 3.0 | 2.0 | 1514 | $1,700 | $1.12 | 23d | 1 | 0.77mi |
| 2640 Latrobe Ave Fayetteville, NC | 1.0–3.0 | 1.0–2.0 | 1079 | $1,815 | $1.68 | 14d | 30 | 0.79mi |
| 1879 Frankie Ave Fayetteville, NC | 3.0 | 2.0 | 1100 | $1,375 | $1.25 | 23d | 1 | 0.85mi |
| 2513 Owlands Ct Fayetteville, NC | 3.0 | 2.0 | 1643 | $2,245 | $1.37 | 14d | 1 | 0.85mi |
| 1811 Balmoral Dr #202 Fayetteville, NC | 2.0 | 2.0 | 1250 | $1,275 | $1.02 | 14d | 1 | 0.87mi |
| 1761 Renwick Dr #204 Fayetteville, NC | 2.0 | 2.0 | 1331 | $1,300 | $0.98 | 14d | 1 | 0.89mi |
| 2161 Bingham Dr Fayetteville, NC | 3.0 | 2.0 | 1300 | $1,325 | $1.02 | 14d | 1 | 0.90mi |
| 1800 Balmoral Dr Fayetteville, NC | 2.0 | 2.0 | 1328 | $1,250 | $0.94 | 23d | 1 | 0.91mi |
| 2543 Painters Mill Dr Fayetteville, NC | 3.0 | 2.0 | 1154 | $1,600 | $1.39 | 14d | 1 | 0.94mi |
| 1927 Shiloh Dr Fayetteville, NC | 3.0 | 1.5 | 1606 | $1,600 | $1.00 | 14d | 1 | 0.97mi |
| 5595 Quietwood Pl Fayetteville, NC | 3.0 | 2.0 | 1288 | $1,395 | $1.08 | 23d | 1 | 1.01mi |
| 1701 Carter Baron Pl Unit 211 Fayetteville, NC | 3.0 | 2.0 | 1295 | $1,700 | $1.31 | 23d | 1 | 1.01mi |
| 5812 Shenandoah Dr Fayetteville, NC | 4.0 | 2.0 | 1800 | $1,599 | $0.89 | 23d | 1 | 1.08mi |
| 6338 Rhemish Dr Fayetteville, NC | 3.0 | 2.0 | 1201 | $1,500 | $1.25 | 23d | 1 | 1.25mi |
| 1411 Furnish Dr Fayetteville, NC | 3.0 | 2.0 | 1100 | $1,350 | $1.23 | 23d | 1 | 1.28mi |
| 5744 Randleman St Fayetteville, NC | 3.0 | 2.0 | 1171 | $1,395 | $1.19 | 23d | 1 | 1.29mi |
| 1583 Winnabow Dr Fayetteville, NC | 3.0 | 2.5 | 1550 | $2,100 | $1.35 | 23d | 1 | 1.31mi |
| 1715 Arrow Ridge Way Fayetteville, NC | 3.0 | 2.0 | 1220 | $1,550 | $1.27 | 14d | 1 | 1.32mi |
| 5721 Randleman St Fayetteville, NC | 3.0 | 2.0 | 1050 | $1,575 | $1.50 | 23d | 1 | 1.34mi |
| 1644 Sweetgum Cir Fayetteville, NC | 3.0 | 2.0 | 1446 | $1,750 | $1.21 | 23d | 1 | 1.37mi |
| 3001 Stone Carriage Cir Fayetteville, NC | 1.0–3.0 | 1.0–2.0 | 1098 | $1,700 | $1.55 | 14d | 12 | 1.44mi |
| 6716 Sandfield Ct Fayetteville, NC | 3.0 | 2.0 | 1296 | $1,575 | $1.22 | 23d | 1 | 1.46mi |
| 3011 Wetherby Ct Fayetteville, NC | 2.0 | 2.0 | 1601 | $1,800 | $1.12 | 14d | 1 | 1.49mi |
| 1815 Paisley Ave Fayetteville, NC | 3.0 | 2.0 | 1508 | $1,595 | $1.06 | 23d | 1 | 1.49mi |
Listing history 22 events
-
2026-06-15status $199,900 Pending 34 DOM
-
2026-06-15days on market $199,900 Active 34 DOM
-
2026-06-14days on market $199,900 Active 32 DOM
-
2026-06-13days on market $199,900 Active 31 DOM
-
2026-06-10days on market $199,900 Active 29 DOM
-
2026-06-09days on market $199,900 Active 28 DOM
-
2026-06-09price $199,900 Active 27 DOM
-
2026-06-08days on market $205,000 Active 27 DOM
-
2026-06-07days on market $205,000 Active 26 DOM
-
2026-06-03days on market $205,000 Active 22 DOM
-
2026-06-03price $205,000 Active 21 DOM
-
2026-06-02days on market $215,000 Active 21 DOM
-
2026-06-01days on market $215,000 Active 20 DOM
-
2026-05-31days on market $215,000 Active 19 DOM
-
2026-05-30days on market $215,000 Active 18 DOM
-
2026-05-12$215,000 Active
-
2025-05-07historical $1,425
-
2025-04-04$1,425
-
2024-03-04historical $1,350
-
2024-02-15$1,350
-
1994-09-30soldstatus $88,500
-
1985-10-01soldstatus $62,150
ⓘ Source: listings_history table (triggers on properties + properties_extension) + one-shot
backfill from property_details.listing_events for pre-trigger history.
Tax reassessment forecast NC · Resets to sale price
- Current annual tax
- $2,722 · $227/mo
- Projected year-2 tax
- $2,722 · $227/mo
- Expected delta
- $0/yr ($0/mo · 0.0%)
ⓘ Screening estimate from a state-policy table — verify with the county assessor before closing.
Climate risk First Street
- Flood 1/10 Low FEMA zone X (unshaded) · 0% chance over 30 yrs
- Wildfire 4/10 Moderate
- Heat 7/10 Severe 7 d/yr ≥107°F today · 16 d/yr by 30 yrs out
- Wind 7/10 Severe 78% chance of damaging wind over 30 yrs
- Air quality 1/10 Low 0 unhealthy d/yr today · 0 by 30 yrs out
Nearby sold comps map
Loading sold comps map…
Walkable amenities ~0.75 mi
Loading nearby amenities…
Taxation est. · year 1
- Rental income
- $20,296
- − Mortgage interest
- −$11,198
- − Property taxes
- −$2,722
- − Insurance
- −$1,000
- − Repairs & maintenance
- −$1,624
- − Management
- −$1,624
- − Depreciation
- −$5,815
- Taxable loss
- −$3,685
- Est. tax savings @ 24.0%
- +$884
- After-tax cash flow
- $618/yr
For passive investors: Depreciation is non-cash, so a rental often shows a tax loss while cash-flowing — sheltering income. Rental losses are passive: they offset passive income freely, and up to $25,000/yr can offset ordinary (W-2) income if you actively participate and your MAGI is under $100k (phasing out to $0 by $150k); unused losses carry forward. On sale, claimed depreciation is recaptured at up to 25%, and gains may owe capital-gains tax (a 1031 exchange can defer both). Figures are a year-1 estimate at your 24.0% rate — not tax advice; consult a CPA.
Schools (NCES district)
- District
- Cumberland County Schools
- NCES district ID
- 3700011
- Math proficiency
- 32% ▼ -2.00%
- Reading proficiency
- 41% ▼ -1.00%
- Median HH income
- $44,168
- Composite
- 31.0/100
- National rank
- #6096
- State rank
- #126 of 178 in NC
Livability — Fayetteville
- Score
- 75/100
- State rank
- #45
- US rank
- #4031
Category grades
Schools grade is shown separately in the Schools card above.
Census & demographics
- Census place
- Fayetteville, NC
- County
- Cumberland County · 265,314 people
- City population
- 226,118
- Metro
- Fayetteville, NC
- Population (ZIP)
- 37,140
- Household income
- $58,563
- Rent vs Own
- Severe rent burden
- 1667.0
Population outlook (Cumberland County) Hauer SSP2
- Today (2025)
- 330,855 people
- By 2030
- 333,523 · +0.8%
- By 2040
- 335,583 · +1.4%
- By 2050
- 335,325 · +1.4%
- By 2075
- 342,853 · +3.6%
- By 2100
- 340,698 · +3.0%
Race, ethnicity, and origin ACS 2023
- Neighborhood character
- Highly diverse neighborhood (Simpson 0.70)
- Race & ethnicity
- Black 39% White 36% Hispanic / Latino 14% Two or more races 12% Asian 3% Native American 1%
- Hispanic origin (detail)
- Mexican 5% Puerto Rican 5%
- Common ancestry
- Slovak 2% Italian 1% Serbian 1%
- Foreign-born
- 8% · Canada, South Korea, Vietnam
- Languages at home
- 87% English-only · Spanish 9% Tagalog/Filipino 1% French/Haitian/Cajun 1%
Political lean MEDSL · Cumberland
- 2024 margin
- D (+13.4) · D 56.1% · R 42.7% · Other 1.2%
- 2008→2024 swing
- -4.3pp toward R · 2008: 17.7pp · 2024: 13.4pp
- All cycles
- 2024: D+13.4 2020: D+16.6 2016: D+16.0 2012: D+19.7 2008: D+17.7
Not yet ingested
- Civics
- —
Market trends
- HPI YoY
- ▼ -59.90%
- Current HPI
- 215.927
- Rent YoY
- ▲ 3.17%
- Metro
- Fayetteville, NC
- State GDP YoY
- ▲ 3.28%
- F500 in state
- 26
Industry mix (Fortune 500 HQ in NC)
| Industry | F500 HQs | Revenue |
|---|---|---|
| Financial Services | 2 | $213B |
|
||
| Retail | 2 | $95B |
|
||
| Industrial Conglomerate | 1 | $38B |
|
||
| Metals / Steel | 1 | $35B |
|
||
| Utilities | 1 | $30B |
|
||
| Industrial Machinery | 1 | $19B |
|
||
Price history
+245.9% since first listed7 events — show timeline
- 2026-05-12 Listed $215,000 LPRMLS
- 2025-05-07 Rental Removed $1,425 TMLS
- 2025-04-04 Listed for Rent $1,425 TMLS
- 2024-03-04 Rental Removed $1,350 LPRMLS
- 2024-02-15 Listed for Rent $1,350 LPRMLS
- 1994-09-30 Sold (Public Records) $88,500 Public Records
- 1985-10-01 Sold (Public Records) $62,150 Public Records
Property tax history
+4.8%/yrLatest (2025): $2,722 · +20.6% YoY. Source: county tax records.
Cash-flow waterfall
monthlySold comps — $/sqft
last 12 mo · ≤1 miLoading sold comps…