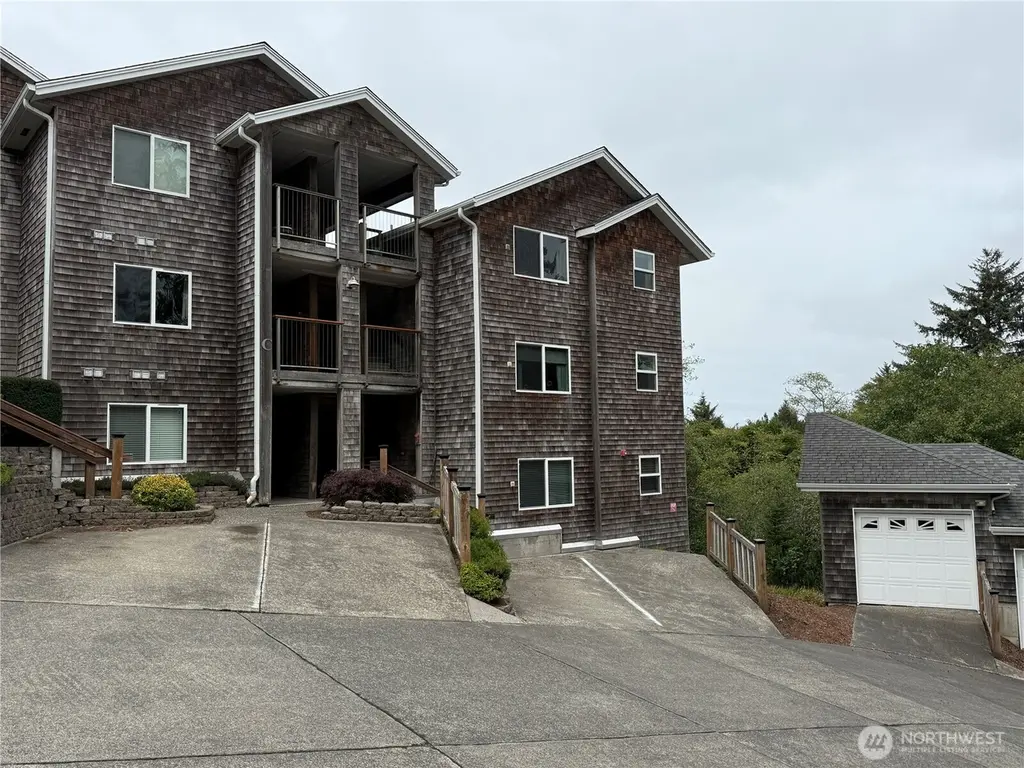
2815 Willows Rd #230 · Ilwaco, WA
Flood risk 1/10 · Minimal
- FEMA flood zone
- X (unshaded)
- Chance of flooding over 30 yrs
- 0.0%
- Est. flood insurance / yr
- $507 – $1,088
Fire risk 1/10 · Minimal
- Est. fire insurance / yr
- $604 – $1,122
Heat risk 1/10 · Minimal
- Hot days now (above 72°F)
- 8 days/yr
- Hot days in 30 yrs
- 17 days/yr
Wind risk 1/10 · Minimal
- Chance of severe wind over 30 yrs
- —
Air-quality risk 5/10 · Moderate
- Unhealthy air days now
- 6 days/yr
- Unhealthy air days in 30 yrs
- 6 days/yr
Risk factors via First Street. Map © Google.
Why this score? — see what drove the D grade
The composite is a weighted blend of 9 inputs, each scored 0–100. Each bar is that input's sub-score; the figure is the points it added to the 100-point composite (weight × sub-score).
- ARV discount +8.7/15.0
- Cash flow +7.6/30.0
- Appreciation +7.3/10.0
- Schools +3.7/10.0
- Livability +3.7/5.0
- 1% rule +2.9/10.0
- Rent growth +2.5/5.0
- Condition / age +2.5/5.0
- DSCR +1.7/10.0
$375,500
🖨 Deal sheet (PDF) 📄 Offer letter ✓ Due diligence
Listing remarks MLS
Absolutely stunning views! Fabulous unit with many upgrades including granite, stainless, jetted tub, patio, fireplace, garage and a sun deck. This is a second level 2 bedroom and is ready for your enjoyment. Excellent price.
Key facts
- Private balcony
- Panoramic views
- Granite counters
Tags
Neighborhood map
What this means for you Summary
Snapshot
- This is a 2-bed/2.0-bath condo listed at $376k.
Deal economics
- At list price, monthly cash flow is $-453 ($-5k/yr) — negative.
- To cash-flow at today's rent, offer at most $295k (21.3% below list).
- To meet the 1% rule (rent ≥ 1% of price), the offer needs to be $296k (21.2% below list).
- Recommended offer: $295k (21.3% below list) — sets the bar for cash-flow.
Location & tenants
- Location reads 73/100 on livability (#205 in WA) — a middle-class / working-renter tenant base. Strengths: crime A+, housing A+, commute B+; Watch: health & safety C-, amenities F.
- Ocean Beach School District (rural): math 34% / reading 50% proficiency, ranked #212 of 291 in WA (top 73%) — families likely to look elsewhere, expect single-tenant / working-renter base with shorter leases.
- Zoned schools: Long Beach Elementary School (221 students, 80% FRL); Hilltop Elementary School (236 students, 70% FRL); Ilwaco High School (296 students, 64% FRL) — zoned schools average 72% FRL vs 56% district-wide (16 pts higher); higher-poverty schools than district average — tighter screening recommended.
- Market conditions: 25 active listings in the ZIP; 90 units permitted in Pacific County in 2024 (0 in 5+ unit buildings).
Forward outlook
- In year one you build about $20k of equity ($3k loan paydown + $17k appreciation (4.6% local appreciation)).
- Pacific County population projected at -10% by 2050 — secular population decline; favor cash flow + early exit over multi-decade hold.
- By year 2, paydown + projected appreciation supports a ~$32k cash-out refi (75% LTV) — recoverable capital for the next deal without selling this one.
Negotiation context
- It's been on market 272 days — a 12% lower offer ($330k) is reasonable based on typical stale-listing flexibility.
- 6 sale attempts since 18y ago with the ask held roughly flat each time — persistent listings suggest the price (not the market) is what's stuck; bring a comps-based counter.
- Current owner paid $300k; 25% above their basis — modest negotiation headroom, anchor on the comps not their cost.
Questions for the listing agent
- What do current leases actually rent for vs. the listed asking? Can we see a recent rent roll and the last 12 months of T-12 income?
- It's been on market 272 days. Have you received any prior offers? Is the seller open to a 21% concession, seller financing, or rate buy-down credit?
- What does the HOA fee cover, when was the last increase, and are there any pending special assessments or reserve-fund shortfalls?
- Any open or pending special assessments — roof, HVAC, plumbing, elevator, façade? What's the per-unit balance and payoff schedule, and is the seller paying it off at close or rolling it to the buyer?
- Why hasn't it sold? Are there any deal-killer items the seller is aware of (foundation, flood, title, zoning, code violations)?
- Is there a deadline driving the sale (1031 exchange, divorce, estate, relocation)? That informs how much negotiation room exists.
- The area grade is low — what's the realistic commute time and amenity access for the typical tenant pool here? Any planned neighborhood developments (good or bad) we should know about?
- What's the average days-on-market for RENTAL listings here right now (not sales)? A rising rental-DOM trend means longer vacancies and softer asking-rent achievability than the comps imply.
- What's the recent tenant-quality profile in this submarket — average credit score on applications, eviction rate, late-payment / NSF rate, and stable-employment percentage? A property-management company in the area should have these aggregated.
- How much new apartment / multifamily construction is in the pipeline within 1–3 miles? Heavy new supply (>2% of stock underway) typically softens rents 12–24 months out; light construction supports rent growth.
Investment metrics
- 1% rule
- 0.79% ✗
- Cap rate
- 4.84%
- Cash-on-cash
- -5.17%
- DSCR
- 0.77
- GRM
- 10.6
CMA / ARV
- ARV (median comp)
- $386,068
- List price
- $375,500
- Delta
- -2.74%
- Verdict
- FAIR
- Comps
- 13 within 1.0 mi
Projected returns pro-forma
4.59% appreciation · 3.0% rent growth · sell at horizon
- IRR
- 7.4%
- Equity multiple
- 1.47×
- Total profit
- $49,130
- Equity at exit
- $203,527
- IRR
- 9.5%
- Equity multiple
- 2.69×
- Total profit
- $178,186
- Equity at exit
- $343,830
Cash invested: $105,140 (down + closing). Projections, not guarantees.
Landlord ↔ Tenant lean methodology
- Overall (STATE)
- 28 Tenant-Leaning
- State Washington
- 28 Tenant-Leaning · D+8
- County
- — inherits STATE
- City
- — inherits STATE
ZIP-level market 98644
- Home prices YoY
- 1.8%
- Active inventory
- 25
- Price-to-rent
- 10.6×
Monthly cashflow live
- Estimated rent
- $2,959 medium interval (Pro) →
- Mortgage (P&I)
- −$1,969
- Tax from tax record
- −$230 /mo · $2,761/yr
- Insurance
- −$156
- HOA
- −$435
- Vacancy / Maint / Mgmt
- −$621
- Net cashflow
- $-453
Break-even live
Sensitivity live
| Price | -10% $-241 | -5% $-347 | +0% $-453 | +5% $-560 | +10% $-666 |
|---|---|---|---|---|---|
| Rent | -10% $-687 | -5% $-570 | +0% $-453 | +5% $-336 | +10% $-220 |
| Rate | -1.0pp $-264 | -0.5pp $-358 | base $-453 | +0.5pp $-551 | +1.0pp $-650 |
UW: 25.0% down · 7.5% · 30yr · 1.5% tax · 5.0% vac · 8.0% maint · 8.0% mgmt
Financing live
Cash to close
- Down payment
- $93,875
- Closing costs
- $11,265
- Reserves months
- —
- Total cash needed
- —
Loan-product check · same deal, 3 products live
Conventional
25% down · 7.5% · 30yr
- Down + closing
- —
- Monthly P&I
- —
- Monthly cashflow
- —
- DSCR
- —
- Eligible?
- —
Personal DTI + credit; lowest rate.
DSCR
20% down · 8.5% · 30yr
- Down + closing
- —
- Monthly P&I
- —
- Monthly cashflow
- —
- DSCR
- —
- Eligible?
- —
No personal income docs; deal must DSCR.
Hard money
10% down · 12.0% · 12mo
- Down + closing
- —
- Monthly P&I
- —
- Monthly cashflow
- —
- DSCR
- —
- Eligible?
- —
Short-term bridge; refi at stabilization.
HOA detail condo
- Monthly dues
- $435 · $5,220/yr
- Assessments
- None detected in remarks — confirm with the listing agent.
Listing history 23 events
-
2026-06-07statusdays on market $375,500 Pending 272 DOM
-
2026-06-03days on market $375,500 Active 270 DOM
-
2026-06-02days on market $375,500 Active 269 DOM
-
2026-06-01days on market $375,500 Active 268 DOM
-
2026-05-31days on market $375,500 Active 267 DOM
-
2026-03-27price $375,500
-
2025-09-06$385,500 Active
-
2020-07-30soldstatus $300,000 Sold
-
2020-06-08status Pending
-
2019-09-10price $304,000
-
2019-07-27$309,000 Active
-
2013-07-01soldstatus $177,050 Sold 227-char remark
Show marketing remark (227 chars)
Absolutely stunning views! Fabulous unit with many upgrades including granite, stainless, jetted tub, patio, fireplace, garage and a sun deck. This is a second level 2 bedroom and is ready for your enjoyment. Excellent price.
-
2013-06-28historical
-
2013-06-28soldstatus $181,000 Sold
-
2013-05-25status Pending 227-char remark
Show marketing remark (227 chars)
Absolutely stunning views! Fabulous unit with many upgrades including granite, stainless, jetted tub, patio, fireplace, garage and a sun deck. This is a second level 2 bedroom and is ready for your enjoyment. Excellent price.
-
2013-05-07status Pending
-
2012-09-28price $184,500
-
2012-09-27status Active
-
2012-09-26$184,500 Active 227-char remark
Show marketing remark (227 chars)
Absolutely stunning views! Fabulous unit with many upgrades including granite, stainless, jetted tub, patio, fireplace, garage and a sun deck. This is a second level 2 bedroom and is ready for your enjoyment. Excellent price.
-
2012-08-04historical Expired
-
2008-08-25status
-
2008-07-22historical
-
2008-01-23$264,900
ⓘ Source: listings_history table (triggers on properties + properties_extension) + one-shot
backfill from property_details.listing_events for pre-trigger history.
Tax reassessment forecast WA · Resets to sale price
- Current annual tax
- $2,761 · $230/mo
- Projected year-2 tax
- $3,680 · $307/mo
- Expected delta
- +$919/yr (+$77/mo · 33.3%)
ⓘ Screening estimate from a state-policy table — verify with the county assessor before closing.
Climate risk First Street
- Flood 1/10 Low FEMA zone X (unshaded) · 0% chance over 30 yrs
- Wildfire 1/10 Low
- Heat 1/10 Low 8 d/yr ≥72°F today · 17 d/yr by 30 yrs out
- Wind 1/10 Low
- Air quality 5/10 Major 6 unhealthy d/yr today · 6 by 30 yrs out
Nearby sold comps map
Loading sold comps map…
Walkable amenities ~0.75 mi
Loading nearby amenities…
Taxation est. · year 1
- Rental income
- $35,504
- − Mortgage interest
- −$21,034
- − Property taxes
- −$2,761
- − Insurance
- −$1,878
- − Repairs & maintenance
- −$2,840
- − Management
- −$2,840
- − HOA
- −$5,220
- − Depreciation
- −$10,924
- Taxable loss
- −$11,993
- Est. tax savings @ 24.0%
- +$2,878
- After-tax cash flow
- $-2,562/yr
For passive investors: Depreciation is non-cash, so a rental often shows a tax loss while cash-flowing — sheltering income. Rental losses are passive: they offset passive income freely, and up to $25,000/yr can offset ordinary (W-2) income if you actively participate and your MAGI is under $100k (phasing out to $0 by $150k); unused losses carry forward. On sale, claimed depreciation is recaptured at up to 25%, and gains may owe capital-gains tax (a 1031 exchange can defer both). Figures are a year-1 estimate at your 24.0% rate — not tax advice; consult a CPA.
Schools (NCES district)
- District
- Ocean Beach School District
- NCES district ID
- 5306060
- Math proficiency
- 34% ▼ -1.00%
- Reading proficiency
- 50% ▲ 1.00%
- Median HH income
- $38,549
- Composite
- 37.37/100
- National rank
- #8929
- State rank
- #212 of 291 in WA
Livability — Ilwaco
- Score
- 73/100
- State rank
- #205
- US rank
- #5623
Category grades
Schools grade is shown separately in the Schools card above.
Census & demographics
- Population (ZIP)
- 686
Population outlook (Pacific County) Hauer SSP2
- Today (2025)
- 20,636 people
- By 2030
- 20,137 · -2.4%
- By 2040
- 19,041 · -7.7%
- By 2050
- 18,504 · -10.3%
- By 2075
- 17,403 · -15.7%
- By 2100
- 16,241 · -21.3%
Race, ethnicity, and origin ACS 2023
- Neighborhood character
- Predominantly White (80%)
- Race & ethnicity
- White 80% Hispanic / Latino 12% Two or more races 6% Native American 3%
- Hispanic origin (detail)
- Mexican 12%
- Common ancestry
- Slovak 7% Italian 6% Iranian 5%
- Foreign-born
- 8% · Canada
- Languages at home
- 79% English-only · Spanish 12% French/Haitian/Cajun 9%
Political lean MEDSL · Pacific
- 2024 margin
- Toss-up / Even · D 48.1% · R 49.4% · Other 2.4%
- 2008→2024 swing
- -15.4pp toward R · 2008: 14.1pp · 2024: -1.3pp
- All cycles
- 2024: R+1.3 2020: R+1.1 2016: R+6.9 2012: D+11.4 2008: D+14.1
Not yet ingested
- Civics
- —
Market trends
- HPI YoY
- ▲ 4.59%
- Current HPI
- 254.3311
- Rent YoY
- —
- Metro
- —
- State GDP YoY
- ▲ 4.65%
- F500 in state
- 22
Industry mix (Fortune 500 HQ in WA)
| Industry | F500 HQs | Revenue |
|---|---|---|
| Retail | 2 | $269B |
|
||
| Technology / Retail | 1 | $638B |
|
||
| Technology | 1 | $245B |
|
||
| Telecommunications | 1 | $38B |
|
||
| Food / Beverage | 1 | $36B |
|
||
| Automotive / Trucks | 1 | $34B |
|
||
Price history
+41.8% since first listed18 events — show timeline
- 2026-03-27 Price Changed $375,500 NWMLS as Distributed by MLS Grid
- 2025-09-06 Listed $385,500 NWMLS as Distributed by MLS Grid
- 2020-07-30 Sold (MLS) $300,000 NWMLS as Distributed by MLS Grid
- 2020-06-08 Pending — NWMLS as Distributed by MLS Grid
- 2019-09-10 Price Changed $304,000 NWMLS as Distributed by MLS Grid
- 2019-07-27 Listed $309,000 NWMLS as Distributed by MLS Grid
- 2013-07-01 Sold (MLS) $177,050 RMLS
- 2013-06-28 Delisted — NWMLS as Distributed by MLS Grid
- 2013-06-28 Sold (MLS) $181,000 NWMLS as Distributed by MLS Grid
- 2013-05-25 Pending — RMLS
- 2013-05-07 Pending — NWMLS as Distributed by MLS Grid
- 2012-09-28 Price Changed $184,500 NWMLS as Distributed by MLS Grid
- 2012-09-27 Relisted — NWMLS as Distributed by MLS Grid
- 2012-09-26 Listed $184,500 RMLS
- 2012-08-04 Delisted — NWMLS as Distributed by MLS Grid
- 2008-08-25 Relisted — NWMLS as Distributed by MLS Grid
- 2008-07-22 Delisted — NWMLS as Distributed by MLS Grid
- 2008-01-23 Listed $264,900 NWMLS as Distributed by MLS Grid
Property tax history
+2.1%/yrLatest (2026): $2,761 · +0.1% YoY. Source: county tax records.
Cash-flow waterfall
monthlySold comps — $/sqft
last 12 mo · ≤1 miLoading sold comps…