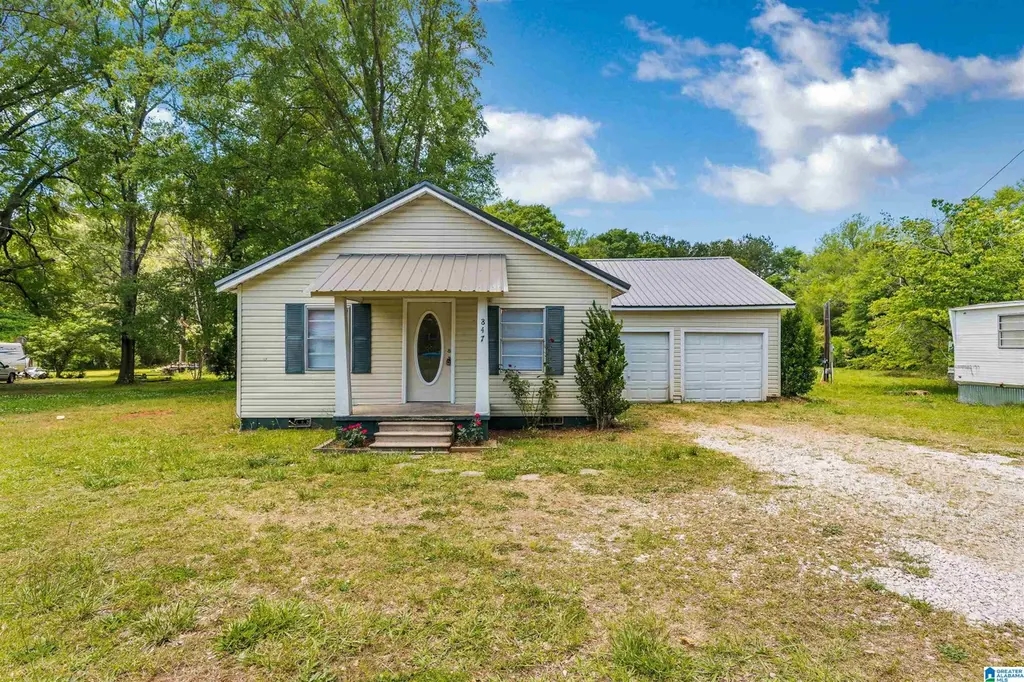
847 Marble City Heights Cir · Sylacauga, AL
Flood risk 1/10 · Minimal
- FEMA flood zone
- X (unshaded)
- Chance of flooding over 30 yrs
- 0.0%
- Est. flood insurance / yr
- $507 – $1,088
Fire risk 6/10 · Moderate
- Est. fire insurance / yr
- $916 – $1,700
Heat risk 7/10 · Major
- Hot days now (above 106°F)
- 7 days/yr
- Hot days in 30 yrs
- 20 days/yr
Wind risk 6/10 · Moderate
- Chance of severe wind over 30 yrs
- 47.0%
Air-quality risk 2/10 · Minimal
- Unhealthy air days now
- 1 days/yr
- Unhealthy air days in 30 yrs
- 2 days/yr
Risk factors via First Street. Map © Google.
Why this score? — see what drove the C grade
The composite is a weighted blend of 9 inputs, each scored 0–100. Each bar is that input's sub-score; the figure is the points it added to the 100-point composite (weight × sub-score).
- Cash flow +21.1/30.0
- ARV discount +15.0/15.0
- DSCR +6.7/10.0
- 1% rule +4.2/10.0
- Livability +3.2/5.0
- Rent growth +2.5/5.0
- Schools +2.5/10.0
- Condition / age +2.5/5.0
- Appreciation +0.0/10.0
$129,900
🖨 Deal sheet (PDF) 📄 Offer letter ✓ Due diligence
Listing remarks MLS
Check this 3 bedroom, 2 bathroom house located in Sylacauga!! All renovated inside from granite counters to luxury flooring!! On the outside is a 2-car garage!
Key facts
- 0.69 acre lot
- 2 garage spots
- Built 1945
Neighborhood map
What this means for you Summary
Snapshot
- This is a 3-bed/2.0-bath single-family listed at $130k.
Deal economics
- At list price, monthly cash flow is $187 ($2k/yr) — positive.
- The deal already cash-flows at list — no discount required.
- To meet the 1% rule (rent ≥ 1% of price), the offer needs to be $120k (7.7% below list).
- Recommended offer: $114k (12.0% below list) — sets the bar for market timing.
- Cap rate 8.0% vs local median 4.3% in Sylacauga — top-decile yield for the area; either an underpriced asset or a hidden risk that comps aren't pricing in. Stress-test before assuming the spread holds.
Location & tenants
- Location reads 64/100 on livability (#157 in AL) — a middle-class / working-renter tenant base. Strengths: cost of living A+, housing A, health & safety A-; Watch: schools D+, crime F, amenities F.
- Talladega County (rural): math 15% / reading 44% proficiency, ranked #75 of 129 in AL (top 58%) — low school quality limits family demand, transient renter base, plan for 1-2y turnover; 64% free/reduced lunch — lower-income household profile, screen leases tightly.
- Market conditions: 135 active listings in the ZIP; 1 comparable units currently listed for rent nearby; 189 units permitted in Talladega County in 2024 (6 in 5+ unit buildings).
Forward outlook
- Local home prices are declining (-3.0%/yr); year-one equity from $898 of loan paydown is wiped out by about $4k of value loss. Plan a longer hold.
- Talladega County population projected at -14% by 2050 — secular population decline; favor cash flow + early exit over multi-decade hold.
Negotiation context
- It's been on market 229 days — a 12% lower offer ($114k) is reasonable based on typical stale-listing flexibility.
- 4 sale attempts since 14y ago with the ask held roughly flat each time — persistent listings suggest the price (not the market) is what's stuck; bring a comps-based counter.
- Current owner paid $102k; 27% above their basis — modest negotiation headroom, anchor on the comps not their cost.
Risks & watch-outs
- Watch-outs: built in 1945 — expect roof / HVAC / electrical / plumbing capex.
- Climate carrying-cost: major wind risk, 47% chance of damaging wind over 30y; major wildfire risk; extreme-heat days projected 7→20/yr by 2055 (HVAC capex compounding) — expect insurance premiums to compound above CPI over the hold.
Questions for the listing agent
- It's been on market 229 days. Have you received any prior offers? Is the seller open to a 12% concession, seller financing, or rate buy-down credit?
- Built in 1945 — when were the roof, HVAC, electrical panel, plumbing, and water heater last replaced?
- Why hasn't it sold? Are there any deal-killer items the seller is aware of (foundation, flood, title, zoning, code violations)?
- Is there a deadline driving the sale (1031 exchange, divorce, estate, relocation)? That informs how much negotiation room exists.
- Schools are D-rated, which usually means shorter tenancies and higher turnover. Who's the typical renter profile here, and what's been the actual vacancy rate?
- Crime grade is F in this area — have there been break-ins, vandalism, or insurance claims at this property in the last 3 years? What carrier currently insures it and at what premium?
- What's the average days-on-market for RENTAL listings here right now (not sales)? A rising rental-DOM trend means longer vacancies and softer asking-rent achievability than the comps imply.
- What's the recent tenant-quality profile in this submarket — average credit score on applications, eviction rate, late-payment / NSF rate, and stable-employment percentage? A property-management company in the area should have these aggregated.
- How much new for-sale + rental construction is in the pipeline within 1–3 miles? Heavy new supply typically softens prices + rents 12–24 months out; constrained supply supports both.
Investment metrics
- 1% rule
- 0.92% ✗
- Cap rate
- 8.02%
- Cash-on-cash
- 6.15%
- DSCR
- 1.27
- GRM
- 9.0
CMA / ARV
- ARV (median comp)
- $187,080
- List price
- $129,900
- Delta
- -30.56%
- Verdict
- UNDERPRICED
- Comps
- 20 within 1.0 mi
Show comp detail 1 sale within ~0.75 mi
| Address | Dist | Beds/Ba | Sqft | Sold | Price | $/sf | Match |
|---|---|---|---|---|---|---|---|
| 176 Lewis Ave | 0.64mi | 3/1.0 | 938 (-2%) | 12mo | $135,000 | $144 | 52 |
Match score weights: distance 35% · size 25% · config 20% · recency 20%. Top-matched comps best support the ARV.
Projected returns pro-forma
-3.0% appreciation · 3.0% rent growth · sell at horizon
- IRR
- -6.9%
- Equity multiple
- 0.75×
- Total profit
- $-9,237
- Equity at exit
- $19,369
- IRR
- 2.7%
- Equity multiple
- 1.19×
- Total profit
- $6,983
- Equity at exit
- $11,231
Cash invested: $36,372 (down + closing). Projections, not guarantees.
Landlord ↔ Tenant lean methodology
- Overall (STATE)
- 90 Strongly Landlord-Friendly
- State Alabama
- 90 Strongly Landlord-Friendly · R+15
- County
- — inherits STATE
- City
- — inherits STATE
ZIP-level market 35150
- Home prices YoY
- -7.9%
- Active inventory
- 135
- Price-to-rent
- 9.0×
Monthly cashflow live
- Estimated rent
- $1,199 medium interval (Pro) →
- Mortgage (P&I)
- −$681
- Tax from tax record
- −$25 /mo · $304/yr
- Insurance
- −$54
- HOA
- −$0
- Vacancy / Maint / Mgmt
- −$252
- Net cashflow
- $187
Break-even live
Sensitivity live
| Price | -10% $260 | -5% $223 | +0% $187 | +5% $150 | +10% $113 |
|---|---|---|---|---|---|
| Rent | -10% $92 | -5% $139 | +0% $187 | +5% $234 | +10% $281 |
| Rate | -1.0pp $252 | -0.5pp $220 | base $187 | +0.5pp $153 | +1.0pp $119 |
UW: 25.0% down · 7.5% · 30yr · 1.5% tax · 5.0% vac · 8.0% maint · 8.0% mgmt
Financing live
Cash to close
- Down payment
- $32,475
- Closing costs
- $3,897
- Reserves months
- —
- Total cash needed
- —
Loan-product check · same deal, 3 products live
Conventional
25% down · 7.5% · 30yr
- Down + closing
- —
- Monthly P&I
- —
- Monthly cashflow
- —
- DSCR
- —
- Eligible?
- —
Personal DTI + credit; lowest rate.
DSCR
20% down · 8.5% · 30yr
- Down + closing
- —
- Monthly P&I
- —
- Monthly cashflow
- —
- DSCR
- —
- Eligible?
- —
No personal income docs; deal must DSCR.
Hard money
10% down · 12.0% · 12mo
- Down + closing
- —
- Monthly P&I
- —
- Monthly cashflow
- —
- DSCR
- —
- Eligible?
- —
Short-term bridge; refi at stabilization.
Rent comps 1 comps
| Address | Beds | Baths | Sqft | Rent | $/sqft | DOM | Units | Dist |
|---|---|---|---|---|---|---|---|---|
| 2301 Motes Rd Sylacauga, AL | 3.0 | 2.5 | 678 | $1,199 | $1.77 | 45d | 1 | 0.32mi |
Listing history 35 events
-
2026-06-21statusdays on market $129,900 Contingent 229 DOM
-
2026-06-19days on market $129,900 Active 227 DOM
-
2026-06-18days on market $129,900 Active 226 DOM
-
2026-06-17days on market $129,900 Active 225 DOM
-
2026-06-16days on market $129,900 Active 224 DOM
-
2026-06-15days on market $129,900 Active 223 DOM
-
2026-06-14days on market $129,900 Active 221 DOM
-
2026-06-13days on market $129,900 Active 220 DOM
-
2026-06-10days on market $129,900 Active 218 DOM
-
2026-06-09days on market $129,900 Active 217 DOM
-
2026-06-08days on market $129,900 Active 216 DOM
-
2026-06-07days on market $129,900 Active 215 DOM
-
2026-06-05days on market $129,900 Active 212 DOM
-
2026-06-03days on market $129,900 Active 211 DOM
-
2026-06-02days on market $129,900 Active 210 DOM
-
2026-06-01days on market $129,900 Active 209 DOM
-
2026-05-31days on market $129,900 Active 208 DOM
-
2026-05-30days on market $129,900 Active 207 DOM
-
2026-01-16price $129,900 159-char remark
Show marketing remark (159 chars)
Check this 3 bedroom, 2 bathroom house located in Sylacauga!! All renovated inside from granite counters to luxury flooring!! On the outside is a 2-car garage!
-
2025-11-04$132,000 Active 159-char remark
Show marketing remark (159 chars)
Check this 3 bedroom, 2 bathroom house located in Sylacauga!! All renovated inside from granite counters to luxury flooring!! On the outside is a 2-car garage!
-
2024-12-15historical $1,000
-
2024-11-27price $1,000
-
2024-11-22price $1,025
-
2024-11-14price $1,075
-
2024-11-07price $1,095
-
2024-10-24price $1,125
-
2024-10-10price $1,150
-
2024-09-26price $1,175
-
2024-09-10$1,195
-
2020-06-08soldstatus $102,000
-
2020-06-03soldstatus $102,000 111-char remark
Show marketing remark (111 chars)
Adorable house in Sylacauga with 3 bedrooms and 2 bathrooms. Perfect area for the best place that build enough.
-
2020-04-19$102,000 111-char remark
Show marketing remark (111 chars)
Adorable house in Sylacauga with 3 bedrooms and 2 bathrooms. Perfect area for the best place that build enough.
-
2020-01-28soldstatus $246,300
-
2013-11-21soldstatus $12,000
-
2012-08-16$18,000
ⓘ Source: listings_history table (triggers on properties + properties_extension) + one-shot
backfill from property_details.listing_events for pre-trigger history.
Tax reassessment forecast AL · Resets to sale price
- Current annual tax
- $304 · $25/mo
- Projected year-2 tax
- $533 · $44/mo
- Expected delta
- +$228/yr (+$19/mo · 74.9%)
ⓘ Screening estimate from a state-policy table — verify with the county assessor before closing.
Climate risk First Street
- Flood 1/10 Low FEMA zone X (unshaded) · 0% chance over 30 yrs
- Wildfire 6/10 Major
- Heat 7/10 Severe 7 d/yr ≥106°F today · 20 d/yr by 30 yrs out
- Wind 6/10 Major 47% chance of damaging wind over 30 yrs
- Air quality 2/10 Low 1 unhealthy d/yr today · 2 by 30 yrs out
Nearby sold comps map
Loading sold comps map…
Walkable amenities ~0.75 mi
Loading nearby amenities…
Taxation est. · year 1
- Rental income
- $14,388
- − Mortgage interest
- −$7,276
- − Property taxes
- −$304
- − Insurance
- −$650
- − Repairs & maintenance
- −$1,151
- − Management
- −$1,151
- − Depreciation
- −$3,779
- Taxable income
- $77
- Est. tax owed @ 24.0%
- −$18
- After-tax cash flow
- $2,220/yr
For passive investors: Depreciation is non-cash, so a rental often shows a tax loss while cash-flowing — sheltering income. Rental losses are passive: they offset passive income freely, and up to $25,000/yr can offset ordinary (W-2) income if you actively participate and your MAGI is under $100k (phasing out to $0 by $150k); unused losses carry forward. On sale, claimed depreciation is recaptured at up to 25%, and gains may owe capital-gains tax (a 1031 exchange can defer both). Figures are a year-1 estimate at your 24.0% rate — not tax advice; consult a CPA.
Schools (NCES district)
- District
- Talladega County
- NCES district ID
- 0103180
- Math proficiency
- 15% ▼ -24.00%
- Reading proficiency
- 44% ▲ 3.00%
- Median HH income
- $37,715
- Composite
- 24.5/100
- National rank
- #7650
- State rank
- #75 of 129 in AL
Livability — Sylacauga
- Score
- 64/100
- State rank
- #157
- US rank
- #14297
Category grades
Schools grade is shown separately in the Schools card above.
Census & demographics
- City population
- 17,118
- Population (ZIP)
- 17,118
Population outlook (Talladega County) Hauer SSP2
- Today (2025)
- 78,905 people
- By 2030
- 77,160 · -2.2%
- By 2040
- 72,937 · -7.6%
- By 2050
- 68,279 · -13.5%
- By 2075
- 57,884 · -26.6%
- By 2100
- 47,220 · -40.2%
Race, ethnicity, and origin ACS 2023
- Neighborhood character
- Majority White (62%)
- Race & ethnicity
- White 62% Black 32% Two or more races 3% Hispanic / Latino 2%
- Common ancestry
- Slovak 1% Hispanic 1% Italian 1%
- Foreign-born
- 1% · Canada
- Languages at home
- 97% English-only · Spanish 2% Other Indo-European 1%
Political lean MEDSL · Talladega
- 2024 margin
- Solid R (+33.8) · D 32.9% · R 66.6%
- 2008→2024 swing
- -15.3pp toward R · 2008: -18.5pp · 2024: -33.8pp
- All cycles
- 2024: R+33.8 2020: R+25.5 2016: R+25.6 2012: R+16.0 2008: R+18.5
Not yet ingested
- Civics
- —
Market trends
- HPI YoY
- ▼ -20.65%
- Current HPI
- 240.527
- Rent YoY
- —
- Metro
- —
- State GDP YoY
- ▲ 2.94%
- F500 in state
- 4
Industry mix (Fortune 500 HQ in AL)
| Industry | F500 HQs | Revenue |
|---|---|---|
| Financial Services | 1 | $8B |
|
||
| Healthcare | 1 | $5B |
|
||
Price history
+621.7% since first listed17 events — show timeline
- 2026-01-16 Price Changed $129,900 Greater Alabama MLS
- 2025-11-04 Listed $132,000 Greater Alabama MLS
- 2024-12-15 Rental Removed $1,000 SHOWMOJO
- 2024-11-27 Price Changed $1,000 SHOWMOJO
- 2024-11-22 Price Changed $1,025 SHOWMOJO
- 2024-11-14 Price Changed $1,075 SHOWMOJO
- 2024-11-07 Price Changed $1,095 SHOWMOJO
- 2024-10-24 Price Changed $1,125 SHOWMOJO
- 2024-10-10 Price Changed $1,150 SHOWMOJO
- 2024-09-26 Price Changed $1,175 SHOWMOJO
- 2024-09-10 Listed for Rent $1,195 SHOWMOJO
- 2020-06-08 Sold (Public Records) $102,000 Public Records
- 2020-06-03 Sold (MLS) $102,000 Greater Alabama MLS
- 2020-04-19 Listed $102,000 Greater Alabama MLS
- 2020-01-28 Sold (Public Records) $246,300 Public Records
- 2013-11-21 Sold (MLS) $12,000 Greater Alabama MLS
- 2012-08-16 Listed $18,000 Greater Alabama MLS
Property tax history
+3.3%/yrLatest (2025): $304 · +0.0% YoY. Source: county tax records.
Cash-flow waterfall
monthlySold comps — $/sqft
last 12 mo · ≤1 miLoading sold comps…