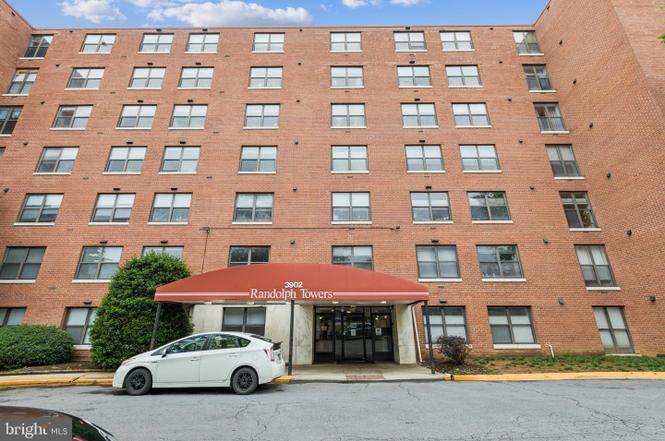
3902 14th St NW #116 · Washington, DC
Flood risk 1/10 · Minimal
- FEMA flood zone
- X (unshaded)
- Chance of flooding over 30 yrs
- 0.0%
- Est. flood insurance / yr
- $507 – $1,088
Fire risk 1/10 · Minimal
- Est. fire insurance / yr
- $631 – $1,173
Heat risk 7/10 · Major
- Hot days now (above 105°F)
- 7 days/yr
- Hot days in 30 yrs
- 15 days/yr
Wind risk 4/10 · Minor
- Chance of severe wind over 30 yrs
- 20.0%
Air-quality risk 4/10 · Minor
- Unhealthy air days now
- 4 days/yr
- Unhealthy air days in 30 yrs
- 5 days/yr
Risk factors via First Street. Map © Google.
Why this score? — see what drove the C grade
The composite is a weighted blend of 9 inputs, each scored 0–100. Each bar is that input's sub-score; the figure is the points it added to the 100-point composite (weight × sub-score).
- Cash flow +20.9/30.0
- 1% rule +10.0/10.0
- ARV discount +7.5/15.0
- DSCR +6.7/10.0
- Livability +3.7/5.0
- Schools +3.6/10.0
- Rent growth +2.9/5.0
- Condition / age +2.5/5.0
- Appreciation +0.0/10.0
$115,000
🖨 Deal sheet (PDF) 📄 Offer letter ✓ Due diligence
Listing remarks
Great Opportunity in Washington, DC – Under $200K! Subject to third party approval. Welcome to Unit #116 in 3902 14th Street featuring 1 bedroom, 1 den to use as an extra room or office space and 1 full bath. This home is located in the heart of 14th Street in northwest DC. Walking distance to various restaurants and nightlife in the area. Accessible to bus stops and only a few minutes away from Columbia Heights metro station. Do not miss the opportunity to call this unit home
Key facts
- $861 HOA
- Parking
- Built 1964
Neighborhood map
What this means for you Summary
Snapshot
- This is a 1-bed/1.0-bath condo listed at $115k.
Deal economics
- At list price, monthly cash flow is $160 ($2k/yr) — positive.
- The deal already cash-flows at list — no discount required.
- Meets the 1% rule at list price ($2k rent vs $115k).
- Recommended offer: $101k (12.0% below list) — sets the bar for market timing.
- Cap rate 8.0% vs local median 2.5% in Washington — top-decile yield for the area; either an underpriced asset or a hidden risk that comps aren't pricing in. Stress-test before assuming the spread holds.
Location & tenants
- Location reads 73/100 on livability (#1 in DC) — a middle-class / working-renter tenant base. Strengths: amenities A+, commute A+, employment A+; Watch: crime F, cost of living F.
- District Of Columbia Public Schools (urban): math 33% / reading 40% proficiency, ranked #8 of 32 in DC (top 25%) — families likely to look elsewhere, expect single-tenant / working-renter base with shorter leases; 65% free/reduced lunch — lower-income household profile, screen leases tightly.
- Zoned schools: Powell Es (484 students, 0% FRL); Roosevelt Hs (913 students, 0% FRL) — zoned schools average 0% FRL vs 65% district-wide (65 pts lower); this property's tenant base skews higher-income than the district average.
- Market conditions: Rents rising (+1.4%/yr); 370 active listings in the ZIP; 40 comparable units currently listed for rent nearby; rentals at typical pace (median 18d on market — plan ~3-4 weeks tenant-placement turnaround); high-income renter base; 1,737 units permitted in District of Columbia in 2024 (1,506 in 5+ unit buildings).
Forward outlook
- Local home prices are declining (-3.0%/yr); year-one equity from $795 of loan paydown is wiped out by about $3k of value loss. Plan a longer hold.
- District of Columbia County population projected at +50% by 2050 — long-run rental-demand tailwind backs the buy-and-hold thesis.
Negotiation context
- It's been on market 367 days — a 12% lower offer ($101k) is reasonable based on typical stale-listing flexibility.
- 6 sale attempts since 6y ago; this cycle's ask has dropped $110k (49%) from the opening price — seller is motivated, your offer sets the floor, not the list.
Risks & watch-outs
- Watch-outs: HOA is 37% of rent.
- Climate carrying-cost: extreme-heat days projected 7→15/yr by 2055 (HVAC capex compounding) — expect insurance premiums to compound above CPI over the hold.
Questions for the listing agent
- It's been on market 367 days. Have you received any prior offers? Is the seller open to a 12% concession, seller financing, or rate buy-down credit?
- Built in 1964 — when were the roof, HVAC, electrical panel, plumbing, and water heater last replaced?
- What does the HOA fee cover, when was the last increase, and are there any pending special assessments or reserve-fund shortfalls?
- Any open or pending special assessments — roof, HVAC, plumbing, elevator, façade? What's the per-unit balance and payoff schedule, and is the seller paying it off at close or rolling it to the buyer?
- Why hasn't it sold? Are there any deal-killer items the seller is aware of (foundation, flood, title, zoning, code violations)?
- Is there a deadline driving the sale (1031 exchange, divorce, estate, relocation)? That informs how much negotiation room exists.
- Crime grade is F in this area — have there been break-ins, vandalism, or insurance claims at this property in the last 3 years? What carrier currently insures it and at what premium?
- What's the average days-on-market for RENTAL listings here right now (not sales)? A rising rental-DOM trend means longer vacancies and softer asking-rent achievability than the comps imply.
- What's the recent tenant-quality profile in this submarket — average credit score on applications, eviction rate, late-payment / NSF rate, and stable-employment percentage? A property-management company in the area should have these aggregated.
- How much new apartment / multifamily construction is in the pipeline within 1–3 miles? Heavy new supply (>2% of stock underway) typically softens rents 12–24 months out; light construction supports rent growth.
Investment metrics
- 1% rule
- 2.00% ✓
- Cap rate
- 7.96%
- Cash-on-cash
- 5.96%
- DSCR
- 1.27
- GRM
- 4.2
CMA / ARV
No comps found within radius.
Projected returns pro-forma
-3.0% appreciation · 1.45% rent growth · sell at horizon
- IRR
- -10.0%
- Equity multiple
- 0.65×
- Total profit
- $-11,421
- Equity at exit
- $17,147
- IRR
- -4.6%
- Equity multiple
- 0.73×
- Total profit
- $-8,586
- Equity at exit
- $9,943
Cash invested: $32,200 (down + closing). Projections, not guarantees.
Landlord ↔ Tenant lean methodology
- Overall (CITY)
- 0 Strongly Tenant-Friendly
- State District of Columbia
- 12 Strongly Tenant-Friendly · D+43
- County
- — inherits STATE
- City Washington
- 0 Strongly Tenant-Friendly · D+43
ZIP-level market 20011
- Rents YoY
- 1.4%
- Active inventory
- 370
- Price-to-rent
- 4.2×
Monthly cashflow live
- Estimated rent
- $2,298 high interval (Pro) →
- Mortgage (P&I)
- −$603
- Tax est. 1.5%
- −$144 /mo · $1,725/yr
- Insurance
- −$48
- HOA
- −$861
- Vacancy / Maint / Mgmt
- −$483
- Net cashflow
- $160
Break-even live
Sensitivity live
| Price | -10% $239 | -5% $200 | +0% $160 | +5% $120 | +10% $80 |
|---|---|---|---|---|---|
| Rent | -10% $-22 | -5% $69 | +0% $160 | +5% $251 | +10% $341 |
| Rate | -1.0pp $218 | -0.5pp $189 | base $160 | +0.5pp $130 | +1.0pp $100 |
UW: 25.0% down · 7.5% · 30yr · 1.5% tax · 5.0% vac · 8.0% maint · 8.0% mgmt
Financing live
Cash to close
- Down payment
- $28,750
- Closing costs
- $3,450
- Reserves months
- —
- Total cash needed
- —
Loan-product check · same deal, 3 products live
Conventional
25% down · 7.5% · 30yr
- Down + closing
- —
- Monthly P&I
- —
- Monthly cashflow
- —
- DSCR
- —
- Eligible?
- —
Personal DTI + credit; lowest rate.
DSCR
20% down · 8.5% · 30yr
- Down + closing
- —
- Monthly P&I
- —
- Monthly cashflow
- —
- DSCR
- —
- Eligible?
- —
No personal income docs; deal must DSCR.
Hard money
10% down · 12.0% · 12mo
- Down + closing
- —
- Monthly P&I
- —
- Monthly cashflow
- —
- DSCR
- —
- Eligible?
- —
Short-term bridge; refi at stabilization.
Rent comps 40 comps
| Address | Beds | Baths | Sqft | Rent | $/sqft | DOM | Units | Dist |
|---|---|---|---|---|---|---|---|---|
| 3900 14th St NW Washington, DC | 2.0 | 1.0 | 895 | $2,448 | $2.73 | 22d | 3 | 0.01mi |
| 3900 14th St NW #501 Washington, DC | 2.0 | 1.0 | 899 | $2,650 | $2.95 | 4d | 1 | 0.03mi |
| 3916 14th St NW #4 Washington, DC | 1.0 | 1.0 | 599 | $2,475 | $4.13 | 0d | 1 | 0.05mi |
| 3934 14th St NW Unit B Washington, DC | 1.0 | 1.0 | 800 | $2,700 | $3.38 | 13d | 1 | 0.07mi |
| 3934 14th St NW #103 Washington, DC | 1.0 | 1.0 | 670 | $2,750 | $4.10 | 13d | 1 | 0.07mi |
| 3800 14th St NW Washington, DC | 1.0 | 1.0 | 619 | $2,110 | $3.41 | 0d | 9 | 0.07mi |
| 3923 14th St NW #2 Washington, DC | 2.0 | 2.0 | 1100 | $3,000 | $2.73 | 25d | 1 | 0.09mi |
| 1437 Spring Rd NW #22 Washington, DC | 2.0 | 1.0 | 680 | $1,995 | $2.93 | 15d | 1 | 0.10mi |
| 1421 Spring Rd NW Washington, DC | 1.0 | 1.0 | 551 | $2,700 | $4.90 | 25d | 1 | 0.10mi |
| 1427 Perry Pl NW Unit 2 Washington, DC | 2.0 | 2.0 | 820 | $2,550 | $3.11 | 20d | 1 | 0.16mi |
| 3625 16th St NW Washington, DC | 1.0 | 1.0 | 601 | $1,850 | $3.08 | 23d | 1 | 0.17mi |
| 1414 Upshur St NW Washington, DC | 1.0–2.0 | 1.0 | 517 | $1,217 | $2.35 | 0d | 1 | 0.17mi |
| 1353 Taylor St NW Unit B Washington, DC | 2.0 | 2.0 | 1100 | $2,700 | $2.45 | 25d | 1 | 0.19mi |
| 4120 14th St NW Washington, DC | 1.0–2.0 | 1.0 | 739 | $2,100 | $2.84 | 9d | 3 | 0.19mi |
| 3601 14th St NW Washington, DC | 2.0 | 1.0 | 800 | $2,850 | $3.56 | 25d | 1 | 0.21mi |
| 3601 14th St NW Unit 9 Washington, DC | 2.0 | 2.5 | 757 | $3,051 | $4.03 | 25d | 1 | 0.21mi |
| 3601 14th St NW Unit 6 Washington, DC | 2.0 | 1.5 | 786 | $3,025 | $3.85 | 25d | 1 | 0.21mi |
| 1515 Ogden St NW Washington, DC | 1.0 | 1.0 | 587 | $1,799 | $3.06 | 0d | 9 | 0.22mi |
| 3525 14th St NW Washington, DC | 2.0 | 2.0 | 789 | $2,800 | $3.55 | 23d | 1 | 0.24mi |
| 3525 14th St NW #4 Washington, DC | 2.0 | 2.5 | 962 | $3,200 | $3.33 | 25d | 1 | 0.24mi |
| 3525 14th St NW #2 Washington, DC | 2.0 | 2.0 | 789 | $2,800 | $3.55 | 25d | 1 | 0.24mi |
| 3636 16th St NW Washington, DC | 1.0 | 1.0 | 509 | $2,182 | $4.29 | 2d | 1 | 0.25mi |
| 1236 Shepherd St NW #1 Washington, DC | 2.0 | 2.0 | 820 | $2,700 | $3.29 | 20d | 1 | 0.25mi |
| 1235 Randolph St NW Washington, DC | 1.0 | 1.0 | 600 | $1,482 | $2.47 | 15d | 2 | 0.25mi |
| 3517 14th St NW Unit B01 Washington, DC | 1.0 | 1.0 | 608 | $2,500 | $4.11 | 5d | 1 | 0.26mi |
| 1350 Perry Pl NW Washington, DC | 2.0 | 2.0 | 878 | $2,475 | $2.82 | 4d | 1 | 0.26mi |
| 1361 Parkwood Pl NW Washington, DC | 1.0 | 1.0 | 780 | $1,845 | $2.37 | 5d | 1 | 0.27mi |
| 1445 Ogden St NW Washington, DC | 1.0 | 1.0 | 625 | $1,921 | $3.07 | 25d | 9 | 0.27mi |
| 1443 Oak St NW Washington, DC | 1.0 | 1.0 | 550 | $1,900 | $3.45 | 25d | 1 | 0.31mi |
| 3435 Brown St NW Unit 24 Washington, DC | 2.0 | 1.0 | 735 | $2,599 | $3.54 | 25d | 1 | 0.32mi |
| 4000 Kansas Ave NW Washington, DC | 1.0–2.0 | 1.0 | 587 | $1,950 | $3.32 | 25d | 1 | 0.34mi |
| 3642 11th St NW Washington, DC | 2.0 | 2.0 | 850 | $2,099 | $2.47 | 9d | 1 | 0.37mi |
| 3613 13th St NW Unit 3 Washington, DC | 2.0 | 2.0 | 725 | $2,500 | $3.45 | 25d | 1 | 0.37mi |
| 3576 13th St NW Unit B Washington, DC | 1.0 | 1.0 | 700 | $2,100 | $3.00 | 6d | 1 | 0.39mi |
| 1436 Meridian Pl NW Unit LL06 Washington, DC | 2.0 | 1.0 | 645 | $1,900 | $2.95 | 2d | 1 | 0.39mi |
| 3420 16th St NW Washington, DC | 1.0 | 1.0 | 715 | $2,188 | $3.06 | 4d | 1 | 0.39mi |
| 3629 11th St NW Unit B Washington, DC | 2.0 | 1.0 | 882 | $1,850 | $2.10 | 0d | 1 | 0.40mi |
| 4025 Kansas Ave NW Apt 3 Washington, DC | 2.0 | 1.0 | 800 | $2,229 | $2.79 | 25d | 1 | 0.42mi |
| 1483 Newton St NW Washington, DC | 2.0 | 1.0 | 526 | $2,192 | $4.17 | 18d | 5 | 0.42mi |
| 940 Randolph St NW Washington, DC | 1.0 | 1.0 | 525 | $1,499 | $2.86 | 3d | 1 | 0.42mi |
HOA detail condo
- Monthly dues
- $861 · $10,332/yr
- Assessments
- None detected in remarks — confirm with the listing agent.
Listing history 36 events
-
2026-06-21days on market $115,000 Active 367 DOM
-
2026-06-18days on market $115,000 Active 364 DOM
-
2026-06-17days on market $115,000 Active 363 DOM
-
2026-06-16days on market $115,000 Active 362 DOM
-
2026-06-15days on market $115,000 Active 361 DOM
-
2026-06-13days on market $115,000 Active 359 DOM
-
2026-06-09days on market $115,000 Active 355 DOM
-
2026-06-08days on market $115,000 Active 354 DOM
-
2026-06-07days on market $115,000 Active 353 DOM
-
2026-06-04days on market $115,000 Active 350 DOM
-
2026-06-03days on market $115,000 Active 349 DOM
-
2026-06-02days on market $115,000 Active 348 DOM
-
2026-06-01days on market $115,000 Active 347 DOM
-
2026-05-31days on market $115,000 Active 346 DOM
-
2026-05-13price $115,000
-
2026-03-31price $150,000
-
2026-02-16price $180,000
-
2025-10-15price $210,000
-
2025-06-19$225,000 Active
-
2023-06-06status Pending
-
2023-06-06historical
-
2023-05-08price $225,000
-
2023-04-06$285,000 Active
-
2023-04-06historical
-
2023-01-25historical
-
2022-06-24price $300,000
-
2022-05-19$315,000 Active
-
2022-03-15historical
-
2022-01-25$335,000 Active
-
2021-04-16historical
-
2021-04-12price $350,000
-
2021-03-30price $385,000
-
2021-03-22$395,000 Active
-
2021-01-20historical
-
2020-11-09price $345,000
-
2020-10-02$360,000 Active
ⓘ Source: listings_history table (triggers on properties + properties_extension) + one-shot
backfill from property_details.listing_events for pre-trigger history.
Climate risk First Street
- Flood 1/10 Low FEMA zone X (unshaded) · 0% chance over 30 yrs
- Wildfire 1/10 Low
- Heat 7/10 Severe 7 d/yr ≥105°F today · 15 d/yr by 30 yrs out
- Wind 4/10 Moderate 20% chance of damaging wind over 30 yrs
- Air quality 4/10 Moderate 4 unhealthy d/yr today · 5 by 30 yrs out
Nearby sold comps map
Loading sold comps map…
Walkable amenities ~0.75 mi
Loading nearby amenities…
Taxation est. · year 1
- Rental income
- $27,578
- − Mortgage interest
- −$6,442
- − Property taxes
- −$1,725
- − Insurance
- −$575
- − Repairs & maintenance
- −$2,206
- − Management
- −$2,206
- − HOA
- −$10,332
- − Depreciation
- −$3,345
- Taxable income
- $747
- Est. tax owed @ 24.0%
- −$179
- After-tax cash flow
- $1,739/yr
For passive investors: Depreciation is non-cash, so a rental often shows a tax loss while cash-flowing — sheltering income. Rental losses are passive: they offset passive income freely, and up to $25,000/yr can offset ordinary (W-2) income if you actively participate and your MAGI is under $100k (phasing out to $0 by $150k); unused losses carry forward. On sale, claimed depreciation is recaptured at up to 25%, and gains may owe capital-gains tax (a 1031 exchange can defer both). Figures are a year-1 estimate at your 24.0% rate — not tax advice; consult a CPA.
Schools (NCES district)
- District
- District Of Columbia Public Schools
- NCES district ID
- 1100030
- Math proficiency
- 33% ▲ 3.00%
- Reading proficiency
- 40% ▲ 5.00%
- Median HH income
- $67,671
- Composite
- 35.84/100
- National rank
- #9606
- State rank
- #8 of 32 in DC
Livability — Washington
- Score
- 73/100
- State rank
- #1
- US rank
- #5327
Category grades
Schools grade is shown separately in the Schools card above.
Census & demographics
- Census place
- Washington, DC
- County
- District of Columbia · 671,873 people
- City population
- 671,873
- Metro
- Washington-Arlington-Alexandria, DC-VA-MD-WV
- Population (ZIP)
- 67,434
- Household income
- $110,309
- Rent vs Own
- Severe rent burden
- 3020.0
Population outlook (District of Columbia County) Hauer SSP2
- Today (2025)
- 821,926 people
- By 2030
- 899,517 · +9.4%
- By 2040
- 1,061,162 · +29.1%
- By 2050
- 1,231,493 · +49.8%
- By 2075
- 1,603,312 · +95.1%
- By 2100
- 1,847,141 · +124.7%
Race, ethnicity, and origin ACS 2023
- Neighborhood character
- Diverse neighborhood (Simpson 0.66)
- Race & ethnicity
- Black 50% Hispanic / Latino 23% White 20% Two or more races 10% Asian 2%
- Hispanic origin (detail)
- Mexican 2% Dominican 1%
- Common ancestry
- Lithuanian 1% Romanian 1% Slovak 1%
- Foreign-born
- 21% · Canada
- Languages at home
- 70% English-only · Spanish 20% French/Haitian/Cajun 2% Other Indo-European 1%
Political lean MEDSL · District of Columbia
- 2024 margin
- Solid D (+86.1) · D 91.2% · R 5.1% · Other 3.8%
- 2008→2024 swing
- +0.1pp no change · 2008: 85.9pp · 2024: 86.1pp
- All cycles
- 2024: D+86.1 2020: D+86.8 2016: D+88.7 2012: D+84.2 2008: D+85.9
Not yet ingested
- Civics
- —
Market trends
- HPI YoY
- ▼ -755.96%
- Current HPI
- 378.1083
- Rent YoY
- ▲ 1.45%
- Metro
- Washington-Arlington-Alexandria, DC-VA-MD-WV
- State GDP YoY
- ▲ 1.33%
- F500 in state
- 6
Industry mix (Fortune 500 HQ in DC)
| Industry | F500 HQs | Revenue |
|---|---|---|
| Financial Services | 1 | $153B |
|
||
| Life Sciences / Industrials | 1 | $25B |
|
||
| Industrial Machinery | 1 | $8B |
|
||
Price history
-68.1% since first listed22 events — show timeline
- 2026-05-13 Price Changed $115,000 BRIGHT MLS
- 2026-03-31 Price Changed $150,000 BRIGHT MLS
- 2026-02-16 Price Changed $180,000 BRIGHT MLS
- 2025-10-15 Price Changed $210,000 BRIGHT MLS
- 2025-06-19 Listed $225,000 BRIGHT MLS
- 2023-06-06 Pending — BRIGHT MLS
- 2023-06-06 Listing Removed — BRIGHT MLS
- 2023-05-08 Price Changed $225,000 BRIGHT MLS
- 2023-04-06 Listed $285,000 BRIGHT MLS
- 2023-04-06 Coming Soon — BRIGHT MLS
- 2023-01-25 Listing Removed — BRIGHT MLS
- 2022-06-24 Price Changed $300,000 BRIGHT MLS
- 2022-05-19 Listed $315,000 BRIGHT MLS
- 2022-03-15 Listing Removed — BRIGHT MLS
- 2022-01-25 Listed $335,000 BRIGHT MLS
- 2021-04-16 Listing Removed — BRIGHT MLS
- 2021-04-12 Price Changed $350,000 BRIGHT MLS
- 2021-03-30 Price Changed $385,000 BRIGHT MLS
- 2021-03-22 Listed $395,000 BRIGHT MLS
- 2021-01-20 Listing Removed — BRIGHT MLS
- 2020-11-09 Price Changed $345,000 BRIGHT MLS
- 2020-10-02 Listed $360,000 BRIGHT MLS
Cash-flow waterfall
monthlySold comps — $/sqft
last 12 mo · ≤1 miLoading sold comps…