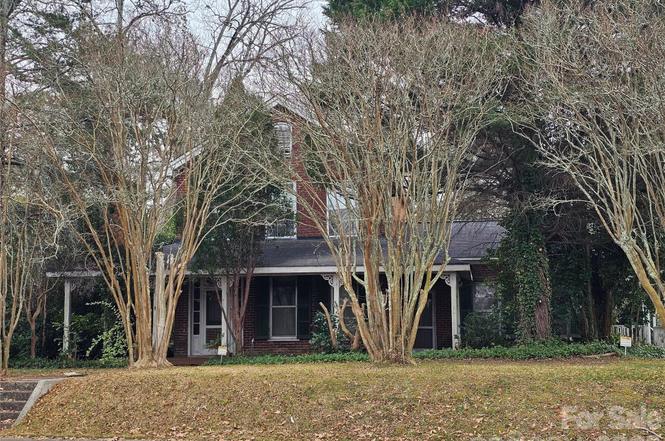
711 Chesterfield Ave · Lancaster, SC
Flood risk 1/10 · Minimal
- FEMA flood zone
- X (unshaded)
- Chance of flooding over 30 yrs
- 0.0%
- Est. flood insurance / yr
- $507 – $1,088
Fire risk 4/10 · Minor
- Est. fire insurance / yr
- $783 – $1,453
Heat risk 6/10 · Moderate
- Hot days now (above 106°F)
- 7 days/yr
- Hot days in 30 yrs
- 16 days/yr
Wind risk 6/10 · Moderate
- Chance of severe wind over 30 yrs
- 49.0%
Air-quality risk 2/10 · Minimal
- Unhealthy air days now
- 2 days/yr
- Unhealthy air days in 30 yrs
- 2 days/yr
Risk factors via First Street. Map © Google.
Why this score? — see what drove the D+ grade
The composite is a weighted blend of 9 inputs, each scored 0–100. Each bar is that input's sub-score; the figure is the points it added to the 100-point composite (weight × sub-score).
- ARV discount +15.0/15.0
- Cash flow +14.9/30.0
- DSCR +4.5/10.0
- 1% rule +4.1/10.0
- Schools +3.7/10.0
- Livability +2.8/5.0
- Rent growth +2.5/5.0
- Condition / age +2.5/5.0
- Appreciation +0.0/10.0
$210,000
🖨 Deal sheet 📄 Offer letter ✓ Due diligence
Listing remarks
Step back in time and discover the timeless charm of this one-of-a-kind century home. More than 100 years of historic character await a new owner who will appreciate the hardwood floors, the mahogany staircase handrail and the sunbaked brick that's part of the interior charm. But can also add their own personal touches to the home. The large yard offers a private area for relaxing and entertaining. The home is within walking distance of downtown.
Key facts
- Large yard
- Historic character
- Hardwood floors
Tags
Property features AI
Finance
- HOA & community: No HOA
Exterior
- Parking: Driveway
- Utilities: City water; Public sewer
- Home design: Single-family residential; Site-built construction; One and one-half story layout; Brick partial exterior; Crawl space foundation; Residential zoning
- Construction: Site-built construction; Partial brick exterior; Crawl space foundation
- Exterior features: Partial fencing; Corner, level lot; Dirt and paved road access; Publicly maintained road; Outbuilding on property
Interior
- Kitchen: Dishwasher; Electric range; Microwave
- Bedrooms: 4 bedrooms (3 upper, 1 main)
- Bathrooms: 1 full bathroom; 1 half bathroom
- Heating & cooling: Electric heating; Central air conditioning (electric)
- Interior features: 12 total rooms; Fireplace
- Laundry & utility: Laundry in kitchen; Dedicated laundry room
Neighborhood map
What this means for you Summary
Snapshot
- This is a 4-bed/2.0-bath single-family listed at $210k.
Deal economics
- At list price, monthly cash flow is $60 ($723/yr) — positive.
- The deal already cash-flows at list — no discount required.
- To meet the 1% rule (rent ≥ 1% of price), the offer needs to be $191k (8.9% below list).
- Recommended offer: $185k (12.0% below list) — sets the bar for market timing.
- Cap rate 6.6% vs local median 3.0% in Lancaster — top-decile yield for the area; either an underpriced asset or a hidden risk that comps aren't pricing in. Stress-test before assuming the spread holds.
Location & tenants
- Location reads 55/100 on livability (#301 in SC) — a working-class tenant base; expect higher turnover. Strengths: cost of living A+, housing B+; Watch: schools C-, crime F, amenities F.
- Lancaster 01 (rural): math 41% / reading 47% proficiency, ranked #26 of 80 in SC (top 32%) — families likely to look elsewhere, expect single-tenant / working-renter base with shorter leases.
- Market conditions: 675 active listings in the ZIP; 1 comparable units currently listed for rent nearby; 976 units permitted in Lancaster County in 2024 (0 in 5+ unit buildings).
- This rent runs 36% of the median local income ($63k/yr) — at the standard rent-burdened threshold; future hikes will face affordability resistance.
Forward outlook
- Local home prices are declining (-3.0%/yr); year-one equity from $1k of loan paydown is wiped out by about $6k of value loss. Plan a longer hold.
- Lancaster County population projected at +40% by 2050 — long-run rental-demand tailwind backs the buy-and-hold thesis.
Negotiation context
- It's been on market 257 days — a 12% lower offer ($185k) is reasonable based on typical stale-listing flexibility.
Risks & watch-outs
- Watch-outs: built in 1900 — expect roof / HVAC / electrical / plumbing capex.
- Climate carrying-cost: major wind risk, 49% chance of damaging wind over 30y; extreme-heat days projected 7→16/yr by 2055 (HVAC capex compounding) — expect insurance premiums to compound above CPI over the hold.
Questions for the listing agent
- It's been on market 257 days. Have you received any prior offers? Is the seller open to a 12% concession, seller financing, or rate buy-down credit?
- Built in 1900 — when were the roof, HVAC, electrical panel, plumbing, and water heater last replaced?
- Why hasn't it sold? Are there any deal-killer items the seller is aware of (foundation, flood, title, zoning, code violations)?
- Is there a deadline driving the sale (1031 exchange, divorce, estate, relocation)? That informs how much negotiation room exists.
- Crime grade is F in this area — have there been break-ins, vandalism, or insurance claims at this property in the last 3 years? What carrier currently insures it and at what premium?
- The area grade is low — what's the realistic commute time and amenity access for the typical tenant pool here? Any planned neighborhood developments (good or bad) we should know about?
- What's the average days-on-market for RENTAL listings here right now (not sales)? A rising rental-DOM trend means longer vacancies and softer asking-rent achievability than the comps imply.
- What's the recent tenant-quality profile in this submarket — average credit score on applications, eviction rate, late-payment / NSF rate, and stable-employment percentage? A property-management company in the area should have these aggregated.
- How much new for-sale + rental construction is in the pipeline within 1–3 miles? Heavy new supply typically softens prices + rents 12–24 months out; constrained supply supports both.
Investment metrics
- 1% rule
- 0.91% ✗
- Cap rate
- 6.64%
- Cash-on-cash
- 1.23%
- DSCR
- 1.05
- GRM
- 9.2
CMA / ARV
- ARV (on-the-fly)
- $301,378
- Comps found
- 3
Show comp detail 3 sales within ~0.75 mi
| Address | Dist | Beds/Ba | Sqft | Sold | Price | $/sf | Match |
|---|---|---|---|---|---|---|---|
| 428 Chester St | 0.27mi | 5/2.0 (+1) | 2,072 (-9%) | 14mo | $275,000 | $133 | 56 |
| 410 E Arch St | 0.48mi | 3/2.5 (-1) | 2,043 (-10%) | 13mo | $290,000 | $142 | 44 |
| 282 Dixon Rd | 0.65mi | 4/2.5 | 1,960 (-14%) | 13mo | $35,000 | $18 | 34 |
Match score weights: distance 35% · size 25% · config 20% · recency 20%. Top-matched comps best support the ARV.
Projected returns pro-forma
-3.0% appreciation · 3.0% rent growth · sell at horizon
- IRR
- -14.3%
- Equity multiple
- 0.49×
- Total profit
- $-30,164
- Equity at exit
- $31,312
- IRR
- -5.6%
- Equity multiple
- 0.64×
- Total profit
- $-21,211
- Equity at exit
- $18,157
Cash invested: $58,800 (down + closing). Projections, not guarantees.
Landlord ↔ Tenant lean methodology
- Overall (STATE)
- 90 Strongly Landlord-Friendly
- State South Carolina
- 90 Strongly Landlord-Friendly · R+6
- County
- — inherits STATE
- City
- — inherits STATE
ZIP-level market 29720
- Home prices YoY
- -28.2%
- Active inventory
- 675
- Price-to-rent
- 9.2×
Monthly cashflow live
- Estimated rent
- $1,912 medium interval (Pro) →
- Mortgage (P&I)
- −$1,101
- Tax from tax record
- −$262 /mo · $3,139/yr
- Insurance
- −$88
- HOA
- −$0
- Vacancy / Maint / Mgmt
- −$402
- Net cashflow
- $60
Break-even live
UW: 25.0% down · 7.5% · 30yr · 1.5% tax · 5.0% vac · 8.0% maint · 8.0% mgmt
Financing live
Cash to close
- Down payment
- $52,500
- Closing costs
- $6,300
- Reserves months
- —
- Total cash needed
- —
Loan-product check · same deal, 3 products live
Conventional
25% down · 7.5% · 30yr
- Down + closing
- —
- Monthly P&I
- —
- Monthly cashflow
- —
- DSCR
- —
- Eligible?
- —
Personal DTI + credit; lowest rate.
DSCR
20% down · 8.5% · 30yr
- Down + closing
- —
- Monthly P&I
- —
- Monthly cashflow
- —
- DSCR
- —
- Eligible?
- —
No personal income docs; deal must DSCR.
Hard money
10% down · 12.0% · 12mo
- Down + closing
- —
- Monthly P&I
- —
- Monthly cashflow
- —
- DSCR
- —
- Eligible?
- —
Short-term bridge; refi at stabilization.
Rent comps 1 comps
| Address | Beds | Baths | Sqft | Rent | $/sqft | DOM | Units | Dist |
|---|---|---|---|---|---|---|---|---|
| 307 N Catawba St Lancaster, SC | 5.0 | 4.0 | 2754 | $2,300 | $0.84 | 24d | 1 | 1.02mi |
Listing history 16 events
-
2026-06-18days on market $210,000 Active 257 DOM
-
2026-06-17days on market $210,000 Active 256 DOM
-
2026-06-16days on market $210,000 Active 255 DOM
-
2026-06-15days on market $210,000 Active 254 DOM
-
2026-06-13days on market $210,000 Active 252 DOM
-
2026-06-09days on market $210,000 Active 248 DOM
-
2026-06-08days on market $210,000 Active 247 DOM
-
2026-06-07days on market $210,000 Active 246 DOM
-
2026-06-04days on market $210,000 Active 243 DOM
-
2026-06-03days on market $210,000 Active 242 DOM
-
2026-06-02days on market $210,000 Active 241 DOM
-
2026-06-01days on market $210,000 Active 240 DOM
-
2026-05-31days on market $210,000 Active 239 DOM
-
2026-04-02price $210,000
-
2025-11-03price $220,000
-
2025-10-04$247,500 Active
ⓘ Source: listings_history table (triggers on properties + properties_extension) + one-shot
backfill from property_details.listing_events for pre-trigger history.
Tax reassessment forecast SC · Resets to sale price
- Current annual tax
- $3,139 · $262/mo
- Projected year-2 tax
- $3,139 · $262/mo
- Expected delta
- $0/yr ($0/mo · 0.0%)
ⓘ Screening estimate from a state-policy table — verify with the county assessor before closing.
Climate risk First Street
- Flood 1/10 Low FEMA zone X (unshaded) · 0% chance over 30 yrs
- Wildfire 4/10 Moderate
- Heat 6/10 Major 7 d/yr ≥106°F today · 16 d/yr by 30 yrs out
- Wind 6/10 Major 49% chance of damaging wind over 30 yrs
- Air quality 2/10 Low 2 unhealthy d/yr today · 2 by 30 yrs out
Nearby sold comps map
Loading sold comps map…
Walkable amenities ~0.75 mi
Loading nearby amenities…
Taxation est. · year 1
- Rental income
- $22,946
- − Mortgage interest
- −$11,763
- − Property taxes
- −$3,139
- − Insurance
- −$1,050
- − Repairs & maintenance
- −$1,836
- − Management
- −$1,836
- − Depreciation
- −$6,109
- Taxable loss
- −$2,787
- Est. tax savings @ 24.0%
- +$669
- After-tax cash flow
- $1,392/yr
For passive investors: Depreciation is non-cash, so a rental often shows a tax loss while cash-flowing — sheltering income. Rental losses are passive: they offset passive income freely, and up to $25,000/yr can offset ordinary (W-2) income if you actively participate and your MAGI is under $100k (phasing out to $0 by $150k); unused losses carry forward. On sale, claimed depreciation is recaptured at up to 25%, and gains may owe capital-gains tax (a 1031 exchange can defer both). Figures are a year-1 estimate at your 24.0% rate — not tax advice; consult a CPA.
Schools (NCES district)
- District
- Lancaster 01
- NCES district ID
- 4502580
- Math proficiency
- 41% ▼ -7.00%
- Reading proficiency
- 47% ▼ -1.00%
- Median HH income
- $44,165
- Composite
- 37.23/100
- National rank
- #4462
- State rank
- #26 of 80 in SC
Livability — Lancaster
- Score
- 55/100
- State rank
- #301
- US rank
- #23178
Category grades
Schools grade is shown separately in the Schools card above.
Census & demographics
- Census place
- Lancaster, SC
- County
- Lancaster County · 91,213 people
- City population
- 53,584
- Metro
- Charlotte-Concord-Gastonia, NC-SC
- Population (ZIP)
- 53,584
- Household income
- $62,969
- Rent vs Own
- Severe rent burden
- 1158.0
Population outlook (Lancaster County) Hauer SSP2
- Today (2025)
- 105,572 people
- By 2030
- 114,865 · +8.8%
- By 2040
- 132,268 · +25.3%
- By 2050
- 148,252 · +40.4%
- By 2075
- 182,540 · +72.9%
- By 2100
- 202,237 · +91.6%
Race, ethnicity, and origin ACS 2023
- Neighborhood character
- Majority White (62%)
- Race & ethnicity
- White 62% Black 26% Hispanic / Latino 8% Two or more races 5%
- Hispanic origin (detail)
- Mexican 4%
- Common ancestry
- Slovak 3% Serbian 2% Romanian 1%
- Foreign-born
- 6% · Canada
- Languages at home
- 91% English-only · Spanish 7% Other Indo-European 1%
Political lean MEDSL · Lancaster
- 2024 margin
- Strong R (+24.8) · D 37.0% · R 61.8% · Other 1.2%
- 2008→2024 swing
- -9.9pp toward R · 2008: -14.9pp · 2024: -24.8pp
- All cycles
- 2024: R+24.8 2020: R+22.8 2016: R+25.5 2012: R+18.0 2008: R+14.9
Not yet ingested
- Civics
- —
Market trends
- HPI YoY
- ▼ -95.90%
- Current HPI
- 244.328
- Rent YoY
- —
- Metro
- Charlotte-Concord-Gastonia, NC-SC
- State GDP YoY
- ▲ 4.51%
- F500 in state
- 2
Industry mix (Fortune 500 HQ in SC)
| Industry | F500 HQs | Revenue |
|---|---|---|
| Packaging | 1 | $7B |
|
||
Price history
-15.2% since first listed3 events — show timeline
- 2026-04-02 Price Changed $210,000 CANOPYMLS as Distributed by MLS Grid
- 2025-11-03 Price Changed $220,000 CANOPYMLS as Distributed by MLS Grid
- 2025-10-04 Listed $247,500 CANOPYMLS as Distributed by MLS Grid
Property tax history
+20.2%/yrLatest (2025): $3,139 · +12.6% YoY. Source: county tax records.
Cash-flow waterfall
monthlySold comps — $/sqft
last 12 mo · ≤1 miLoading sold comps…