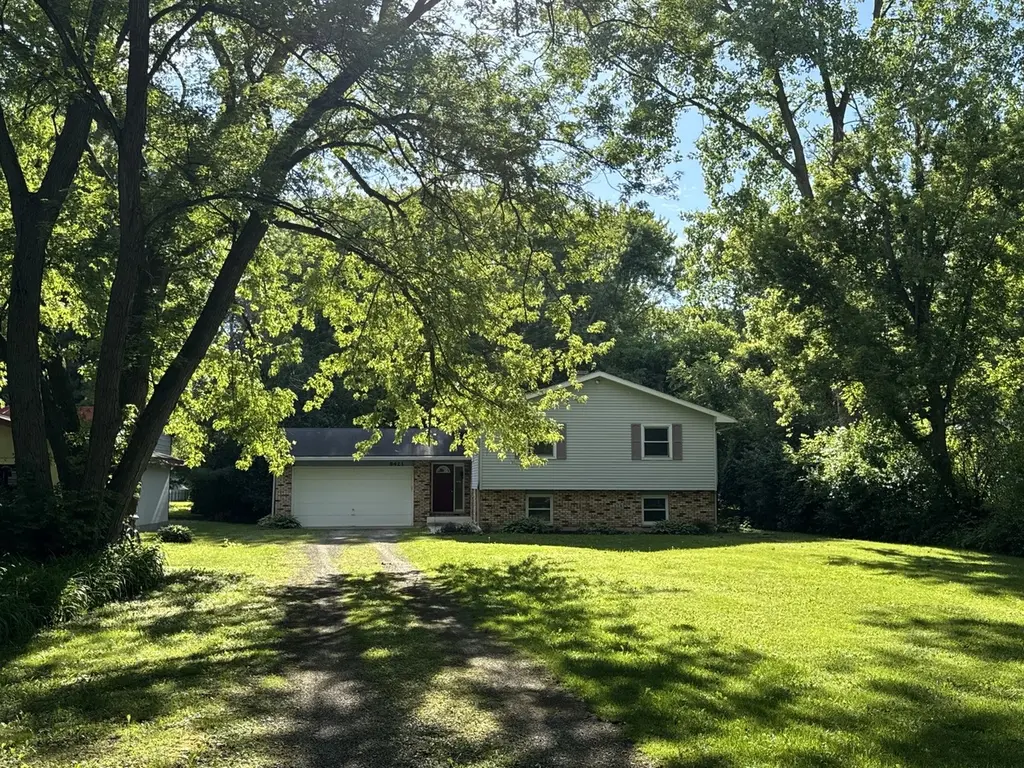
8421 Hickory Nut Grove Rd · Lake Barrington, IL
Flood risk 1/10 · Minimal
- FEMA flood zone
- X (unshaded)
- Chance of flooding over 30 yrs
- 0.0%
- Est. flood insurance / yr
- $473 – $860
Fire risk 1/10 · Minimal
- Est. fire insurance / yr
- $804 – $1,492
Heat risk 2/10 · Minimal
- Hot days now (above 101°F)
- 7 days/yr
- Hot days in 30 yrs
- 14 days/yr
Wind risk 2/10 · Minimal
- Chance of severe wind over 30 yrs
- 1.0%
Air-quality risk 3/10 · Minor
- Unhealthy air days now
- 3 days/yr
- Unhealthy air days in 30 yrs
- 3 days/yr
Risk factors via First Street. Map © Google.
Why this score? — see what drove the C- grade
The composite is a weighted blend of 9 inputs, each scored 0–100. Each bar is that input's sub-score; the figure is the points it added to the 100-point composite (weight × sub-score).
- Cash flow +25.0/30.0
- DSCR +8.2/10.0
- 1% rule +5.8/10.0
- Schools +3.9/10.0
- ARV discount +3.7/15.0
- Livability +3.2/5.0
- Rent growth +2.5/5.0
- Condition / age +2.5/5.0
- Appreciation +0.0/10.0
$369,900
🖨 Deal sheet 📄 Offer letter ✓ Due diligence
Listing remarks
Rare opportunities to own just under 3/4 ACRE LOT in Unincorporated Cary. No HOA fees and walking distance to the Fox River. Bring your boat, jet skis, trailers and furry friends and enjoy this country like setting on the edge of town. This split-level home currently has 4 bedrooms and 2 bathrooms that have just been freshly painted and new carpeting installed. Enjoy the neutral "greige" tones and large windows overlooking the lush back yard. Mature trees line the back of the property for extra privacy! The lower level has approx. 1000 Sq. Ft. for room for expansion with this "ready to finish" family room with fireplace plus a bonus room. Earn sweat equity by putting y
Key facts
- 3/4 acre lot
- Bonus room
- Low taxes
Tags
Property features AI
Finance
- Other: Not currently leased; Possession at closing
- HOA & community: No master association fee required
Exterior
- Parking: Attached garage (garage owned) with 2 garage spaces; Parking for 2 total; Garage door opener; Gravel driveway
- Utilities: Well water; Septic tank sewer
- Home design: Detached single-family home; Split-level design; Fee simple ownership; School bus service available
- Construction: Built approximately 41-50 years ago; Vinyl siding and brick exterior; Asphalt roof; Concrete perimeter foundation
- Exterior features: Deck; Property backs to trees/woods; Wooded lot with mature trees; Lot dimensions approximately 80 x 368
Interior
- Kitchen: Range; Refrigerator; Freezer; Eating area / table space
- Bedrooms: Main level master bedroom (12 x 16) with full bath; Main level bedroom (12 x 12); Main level bedroom (11 x 10); Lower level bedroom (12 x 11)
- Flooring: Hardwood in kitchen; Carpet in living areas and bedrooms
- Bathrooms: Two full bathrooms
- Heating & cooling: Natural gas heating; Central air conditioning
- Interior features: Open floorplan; Separate dining room; 1st-floor bedroom; 1st-floor full bath; Seven total rooms
- Laundry & utility: Laundry room; Washer; Dryer (electric dryer hookup); Laundry sink; Owned water softener
Neighborhood map
What this means for you Summary
Snapshot
- This is a 4-bed/2.0-bath single-family listed at $370k.
Deal economics
- At list price, monthly cash flow is $809 ($10k/yr) — positive.
- The deal already cash-flows at list — no discount required.
- Meets the 1% rule at list price ($4k rent vs $370k).
- Cap rate 8.9% vs local median 2.2% in Lake Barrington — top-decile yield for the area; either an underpriced asset or a hidden risk that comps aren't pricing in. Stress-test before assuming the spread holds.
Location & tenants
- Location reads 65/100 on livability (#661 in IL) — a middle-class / working-renter tenant base. Strengths: crime A+, employment A+, housing A+; Watch: amenities F, commute F, cost of living F.
- Chsd 155 (suburban): math 41% / reading 42% proficiency, ranked #98 of 620 in IL (top 16%) — families likely to look elsewhere, expect single-tenant / working-renter base with shorter leases.
- Market conditions: 60 active listings in the ZIP; 1 comparable units currently listed for rent nearby; 1,595 units permitted in McHenry County in 2024 (485 in 5+ unit buildings).
Forward outlook
- Local home prices are declining (-3.0%/yr); year-one equity from $3k of loan paydown is wiped out by about $11k of value loss. Plan a longer hold.
- McHenry County population projected at -12% by 2050 — secular population decline; favor cash flow + early exit over multi-decade hold.
Negotiation context
- Only 6 days on market — expect competitive offers; lowballing is unlikely to land.
Questions for the listing agent
- Built in 1979 — when were the roof, HVAC, electrical panel, plumbing, and water heater last replaced?
- Is there a deadline driving the sale (1031 exchange, divorce, estate, relocation)? That informs how much negotiation room exists.
- What's the average days-on-market for RENTAL listings here right now (not sales)? A rising rental-DOM trend means longer vacancies and softer asking-rent achievability than the comps imply.
- What's the recent tenant-quality profile in this submarket — average credit score on applications, eviction rate, late-payment / NSF rate, and stable-employment percentage? A property-management company in the area should have these aggregated.
- How much new for-sale + rental construction is in the pipeline within 1–3 miles? Heavy new supply typically softens prices + rents 12–24 months out; constrained supply supports both.
Investment metrics
- 1% rule
- 1.08% ✓
- Cap rate
- 8.92%
- Cash-on-cash
- 9.37%
- DSCR
- 1.42
- GRM
- 7.7
CMA / ARV
- ARV (on-the-fly)
- $340,765
- Comps found
- 3
Show comp detail 3 sales within ~0.75 mi
| Address | Dist | Beds/Ba | Sqft | Sold | Price | $/sf | Match |
|---|---|---|---|---|---|---|---|
| 23780 N Hess Dr | 0.19mi | 4/2.0 | 1,550 (-4%) | 1mo | $400,000 | $258 | 83 |
| 28875 W South St | 0.23mi | 3/2.0 (-1) | 1,564 (-3%) | 12mo | $330,000 | $211 | 69 |
| 23433 N Summit Dr | 0.52mi | 3/1.5 (-1) | 1,438 (-11%) | 7mo | $260,000 | $181 | 45 |
Match score weights: distance 35% · size 25% · config 20% · recency 20%. Top-matched comps best support the ARV.
Projected returns pro-forma
-3.0% appreciation · 3.0% rent growth · sell at horizon
- IRR
- -2.2%
- Equity multiple
- 0.92×
- Total profit
- $-8,503
- Equity at exit
- $55,153
- IRR
- 7.5%
- Equity multiple
- 1.57×
- Total profit
- $58,646
- Equity at exit
- $31,982
Cash invested: $103,572 (down + closing). Projections, not guarantees.
Landlord ↔ Tenant lean methodology
- Overall (STATE)
- 43 Moderately Tenant-Leaning
- State Illinois
- 43 Moderately Tenant-Leaning · D+7
- County
- — inherits STATE
- City
- — inherits STATE
ZIP-level market 60013
- Active inventory
- 60
- Price-to-rent
- 7.7×
Monthly cashflow live
- Estimated rent
- $4,000 medium interval (Pro) →
- Mortgage (P&I)
- −$1,940
- Tax from tax record
- −$257 /mo · $3,089/yr
- Insurance
- −$154
- HOA
- −$0
- Vacancy / Maint / Mgmt
- −$840
- Net cashflow
- $809
Break-even live
UW: 25.0% down · 7.5% · 30yr · 1.5% tax · 5.0% vac · 8.0% maint · 8.0% mgmt
Financing live
Cash to close
- Down payment
- $92,475
- Closing costs
- $11,097
- Reserves months
- —
- Total cash needed
- —
Loan-product check · same deal, 3 products live
Conventional
25% down · 7.5% · 30yr
- Down + closing
- —
- Monthly P&I
- —
- Monthly cashflow
- —
- DSCR
- —
- Eligible?
- —
Personal DTI + credit; lowest rate.
DSCR
20% down · 8.5% · 30yr
- Down + closing
- —
- Monthly P&I
- —
- Monthly cashflow
- —
- DSCR
- —
- Eligible?
- —
No personal income docs; deal must DSCR.
Hard money
10% down · 12.0% · 12mo
- Down + closing
- —
- Monthly P&I
- —
- Monthly cashflow
- —
- DSCR
- —
- Eligible?
- —
Short-term bridge; refi at stabilization.
Rent comps 1 comps
| Address | Beds | Baths | Sqft | Rent | $/sqft | DOM | Units | Dist |
|---|---|---|---|---|---|---|---|---|
| 87 W Surrey Ln Barrington, IL | 4.0 | 4.0 | 2232 | $4,000 | $1.79 | 15d | 1 | 1.35mi |
Listing history 6 events
-
2026-06-18days on market $369,900 Active 6 DOM
-
2026-06-17days on market $369,900 Active 5 DOM
-
2026-06-16days on market $369,900 Active 4 DOM
-
2026-06-15days on market $369,900 Active 3 DOM
-
2026-06-13remarks 679-char remark
-
2026-06-13$369,900 Active 1 DOM
ⓘ Source: listings_history table (triggers on properties + properties_extension) + one-shot
backfill from property_details.listing_events for pre-trigger history.
Tax reassessment forecast IL · Partial reset (capped growth)
- Current annual tax
- $3,089 · $257/mo
- Projected year-2 tax
- $5,743 · $479/mo
- Expected delta
- +$2,654/yr (+$221/mo · 85.9%)
ⓘ Screening estimate from a state-policy table — verify with the county assessor before closing.
Climate risk First Street
- Flood 1/10 Low FEMA zone X (unshaded) · 0% chance over 30 yrs
- Wildfire 1/10 Low
- Heat 2/10 Low 7 d/yr ≥101°F today · 14 d/yr by 30 yrs out
- Wind 2/10 Low 100% chance of damaging wind over 30 yrs
- Air quality 3/10 Moderate 3 unhealthy d/yr today · 3 by 30 yrs out
Nearby sold comps map
Loading sold comps map…
Walkable amenities ~0.75 mi
Loading nearby amenities…
Taxation est. · year 1
- Rental income
- $48,000
- − Mortgage interest
- −$20,720
- − Property taxes
- −$3,089
- − Insurance
- −$1,850
- − Repairs & maintenance
- −$3,840
- − Management
- −$3,840
- − Depreciation
- −$10,761
- Taxable income
- $3,900
- Est. tax owed @ 24.0%
- −$936
- After-tax cash flow
- $8,767/yr
For passive investors: Depreciation is non-cash, so a rental often shows a tax loss while cash-flowing — sheltering income. Rental losses are passive: they offset passive income freely, and up to $25,000/yr can offset ordinary (W-2) income if you actively participate and your MAGI is under $100k (phasing out to $0 by $150k); unused losses carry forward. On sale, claimed depreciation is recaptured at up to 25%, and gains may owe capital-gains tax (a 1031 exchange can defer both). Figures are a year-1 estimate at your 24.0% rate — not tax advice; consult a CPA.
Schools (NCES district)
- District
- Chsd 155
- NCES district ID
- 1711370
- Math proficiency
- 41% ▼ -9.00%
- Reading proficiency
- 42% ▼ -7.00%
- Median HH income
- $87,560
- Composite
- 39.33/100
- National rank
- #3982
- State rank
- #98 of 620 in IL
Livability — Lake Barrington
- Score
- 65/100
- State rank
- #661
- US rank
- #13552
Category grades
Schools grade is shown separately in the Schools card above.
Census & demographics
- Population (ZIP)
- 26,503
Population outlook (McHenry County) Hauer SSP2
- Today (2025)
- 305,342 people
- By 2030
- 301,491 · -1.3%
- By 2040
- 288,211 · -5.6%
- By 2050
- 268,430 · -12.1%
- By 2075
- 226,209 · -25.9%
- By 2100
- 181,247 · -40.6%
Race, ethnicity, and origin ACS 2023
- Neighborhood character
- Predominantly White (80%)
- Race & ethnicity
- White 80% Hispanic / Latino 14% Two or more races 9%
- Hispanic origin (detail)
- Mexican 10% Puerto Rican 2%
- Common ancestry
- Romanian 11% Italian 2% Portuguese 2%
- Foreign-born
- 7% · Canada
- Languages at home
- 88% English-only · Spanish 8% Russian/Polish/Slavic 2%
Political lean MEDSL · McHenry
- 2024 margin
- Lean R (+5.3) · D 46.6% · R 51.9% · Other 1.5%
- 2008→2024 swing
- -10.6pp toward R · 2008: 5.3pp · 2024: -5.3pp
- All cycles
- 2024: R+5.3 2020: R+2.5 2016: R+8.1 2012: R+8.8 2008: D+5.3
Not yet ingested
- Civics
- —
Market trends
- HPI YoY
- ▼ -157.47%
- Current HPI
- 201.8071
- Rent YoY
- —
- Metro
- —
- State GDP YoY
- ▲ 1.59%
- F500 in state
- 60
Industry mix (Fortune 500 HQ in IL)
| Industry | F500 HQs | Revenue |
|---|---|---|
| Insurance | 4 | $201B |
|
||
| Consumer Goods | 4 | $87B |
|
||
| Industrial Machinery | 3 | $64B |
|
||
| Healthcare | 2 | $55B |
|
||
| Retail / Pharmacy | 1 | $148B |
|
||
| Agriculture / Food | 1 | $86B |
|
||
Price history
1 event — show timeline
- 2026-06-12 Listed $369,900 MRED as Distributed by MLS Grid
Property tax history
-2.4%/yrLatest (2024): $3,089 · -9.4% YoY. Source: county tax records.
Cash-flow waterfall
monthlySold comps — $/sqft
last 12 mo · ≤1 miLoading sold comps…