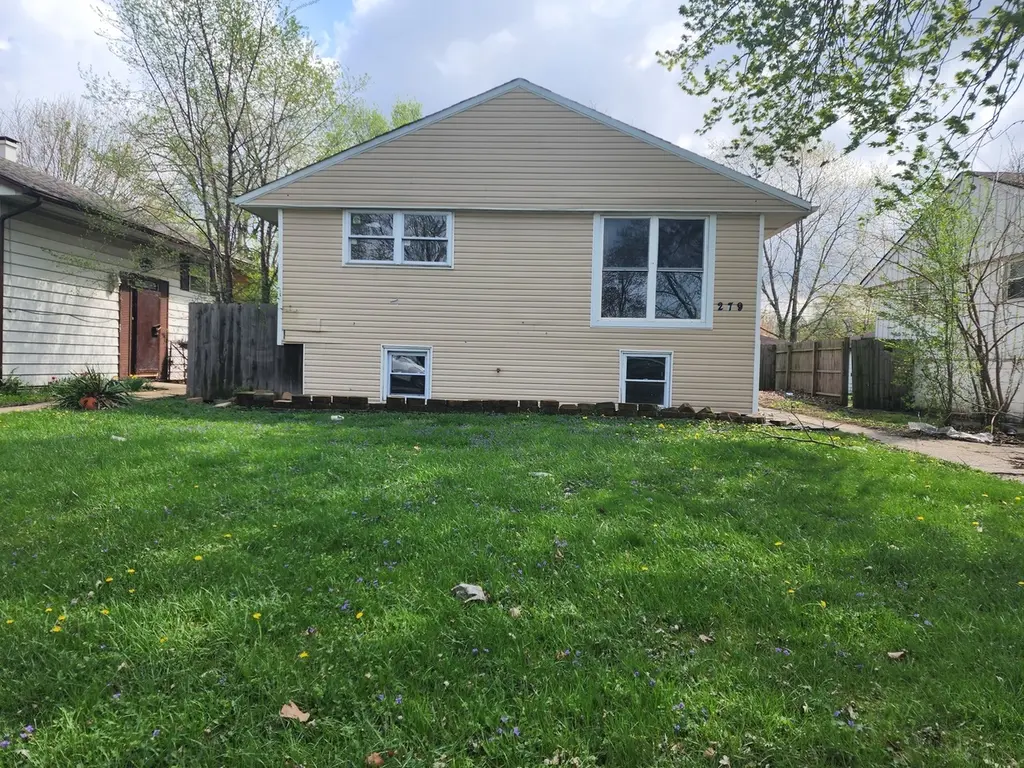
279 Chappel Ave · Calumet City, IL
Flood risk 5/10 · Moderate
- FEMA flood zone
- X (unshaded)
- Chance of flooding over 30 yrs
- 0.65%
- Est. flood insurance / yr
- $473 – $860
Fire risk 1/10 · Minimal
- Est. fire insurance / yr
- $804 – $1,492
Heat risk 3/10 · Minor
- Hot days now (above 101°F)
- 7 days/yr
- Hot days in 30 yrs
- 15 days/yr
Wind risk 2/10 · Minimal
- Chance of severe wind over 30 yrs
- 0.0%
Air-quality risk 4/10 · Minor
- Unhealthy air days now
- 4 days/yr
- Unhealthy air days in 30 yrs
- 5 days/yr
Risk factors via First Street. Map © Google.
Why this score? — see what drove the B- grade
The composite is a weighted blend of 9 inputs, each scored 0–100. Each bar is that input's sub-score; the figure is the points it added to the 100-point composite (weight × sub-score).
- Cash flow +30.0/30.0
- 1% rule +10.0/10.0
- DSCR +10.0/10.0
- ARV discount +6.6/15.0
- Rent growth +4.0/5.0
- Livability +3.6/5.0
- Condition / age +2.5/5.0
- Schools +0.7/10.0
- Appreciation +0.0/10.0
$112,900
🖨 Deal sheet 📄 Offer letter ✓ Due diligence
Listing remarks MLS
SPACIOUS FRAME SPLIT LEVEL THAT FEATURES 3 BEDROOMS, 1 BATH, BASEMENT, VERY SPACIOUS FRONT YARD, 1 CAR DETACHED GARAGE. CLOSE TO EXPRESSWAYS, AND SHOPPING. THIS IS A FANNIE MAE HOME PATH PROPERTY.
Key facts
- 5924 acre lot
- Garage
- Built 1964
Property features AI
Finance
- HOA & community: No master association fee required
Exterior
- Parking: Detached garage (1 car); Total parking for 1 vehicle
- Utilities: Public water; Public sewer
- Home design: Detached single-family home; Split-level layout; Built before 1978 (age approx. 61–70 years); Fee simple ownership
- Construction: Aluminum siding
- Exterior features: Lot dimensions approximately 47 x 126; Lot smaller than 0.25 acre
Interior
- Kitchen: Range; Refrigerator
- Bedrooms: Master bedroom on main level (16 x 12); Bedroom on main level (14 x 11); Bedroom on main level (11 x 10); Additional bedroom in finished basement (11 x 10) — counts as possible 4th bedroom
- Flooring: Laminate flooring
- Bathrooms: One full bathroom; One half bathroom; Basement includes bath stubbed/full (bathroom access in basement)
- Heating & cooling: Natural gas heating; Central air conditioning
- Interior features: First-floor bedroom; Finished basement with exterior entry and walk-out access; Basement has bath stubbed/full plumbing
- Laundry & utility: Laundry room in basement (5 x 3)
Neighborhood map
What this means for you Summary
Snapshot
- This is a 3-bed/1.0-bath single-family listed at $113k.
Deal economics
- At list price, monthly cash flow is $718 ($9k/yr) — positive.
- The deal already cash-flows at list — no discount required.
- Meets the 1% rule at list price ($2k rent vs $113k).
- Recommended offer: $111k (1.5% below list) — sets the bar for market timing.
- Cap rate 13.9% vs local median 8.2% in Calumet City — top-decile yield for the area; either an underpriced asset or a hidden risk that comps aren't pricing in. Stress-test before assuming the spread holds.
Location & tenants
- Location reads 71/100 on livability (#330 in IL) — a middle-class / working-renter tenant base. Strengths: commute A+, cost of living A+, housing A+; Watch: employment C-, crime D-, amenities F.
- Thornton Twp Hsd 205 (suburban): math 7% / reading 8% proficiency, ranked #594 of 620 in IL (top 96%) — low school quality limits family demand, transient renter base, plan for 1-2y turnover.
- Zoned schools: Thornton Township High School (math 7% / reading 7%, grade F, #605 of 693 statewide, top 87%, 1,628 students, 0% FRL).
- Market conditions: Rents rising fast (+6.2%/yr); 198 active listings in the ZIP; 15 comparable units currently listed for rent nearby; rentals leasing fast (median 13d on market — plan ~1-2 weeks tenant-placement turnaround); 6,272 units permitted in Cook County in 2024 (4,658 in 5+ unit buildings).
- This rent runs 41% of the median local income ($55k/yr) — at the standard rent-burdened threshold; future hikes will face affordability resistance.
Forward outlook
- Local home prices are declining (-3.0%/yr); year-one equity from $781 of loan paydown is wiped out by about $3k of value loss. Plan a longer hold.
- At projected returns (-3.0% appreciation + 6.2% rent growth), your $32k cash investment doubles in ~4 years — after that, you're playing with house money.
Negotiation context
- It's been on market 16 days — a 2% lower offer ($111k) is reasonable based on typical stale-listing flexibility.
- 4 sale attempts since 11y ago with the ask held roughly flat each time — persistent listings suggest the price (not the market) is what's stuck; bring a comps-based counter.
- Current owner paid $14k; list at $113k implies a 706% gain — meaningful room to come down on a strong offer.
Risks & watch-outs
- Climate carrying-cost: moderate flood risk — expect insurance premiums to compound above CPI over the hold.
Questions for the listing agent
- Built in 1964 — when were the roof, HVAC, electrical panel, plumbing, and water heater last replaced?
- Is there a deadline driving the sale (1031 exchange, divorce, estate, relocation)? That informs how much negotiation room exists.
- Schools are F-rated, which usually means shorter tenancies and higher turnover. Who's the typical renter profile here, and what's been the actual vacancy rate?
- Crime grade is D in this area — have there been break-ins, vandalism, or insurance claims at this property in the last 3 years? What carrier currently insures it and at what premium?
- What's the average days-on-market for RENTAL listings here right now (not sales)? A rising rental-DOM trend means longer vacancies and softer asking-rent achievability than the comps imply.
- What's the recent tenant-quality profile in this submarket — average credit score on applications, eviction rate, late-payment / NSF rate, and stable-employment percentage? A property-management company in the area should have these aggregated.
- How much new for-sale + rental construction is in the pipeline within 1–3 miles? Heavy new supply typically softens prices + rents 12–24 months out; constrained supply supports both.
Investment metrics
- 1% rule
- 1.68% ✓
- Cap rate
- 13.93%
- Cash-on-cash
- 27.27%
- DSCR
- 2.21
- GRM
- 5.0
CMA / ARV
- ARV (on-the-fly)
- $110,627
- Comps found
- 12
Show comp detail 12 sales within ~0.75 mi
| Address | Dist | Beds/Ba | Sqft | Sold | Price | $/sf | Match |
|---|---|---|---|---|---|---|---|
| 295 Chappel Ave | 0.03mi | 3/2.0 | 979 (0%) | 5mo | $240,000 | $245 | 91 |
| 370 Clyde Ave | 0.22mi | 3/2.0 | 973 (-1%) | 0mo | $105,000 | $108 | 85 |
| 405 Clyde Ave | 0.30mi | 3/1.0 | 973 (-1%) | 3mo | $110,000 | $113 | 82 |
| 283 Paxton Ave | 0.19mi | 3/2.0 | 1,004 (+3%) | 5mo | $80,000 | $80 | 79 |
| 427 Clyde Ave | 0.34mi | 3/1.0 | 1,025 (+5%) | 3mo | $190,000 | $185 | 73 |
| 14610 Blackstone Ave | 0.47mi | 3/1.0 | 1,017 (+4%) | 1mo | $150,000 | $147 | 71 |
| 14738 Blackstone Ave | 0.50mi | 3/1.0 | 1,017 (+4%) | 1mo | $150,000 | $147 | 70 |
| 14642 Dorchester Ave | 0.60mi | 3/1.0 | 1,013 (+4%) | 1mo | $170,000 | $168 | 66 |
| 14622 Kenwood Ave | 0.66mi | 3/1.0 | 1,017 (+4%) | 5mo | $110,000 | $108 | 59 |
| 14731 Kimbark Ave | 0.71mi | 3/1.0 | 1,017 (+4%) | 2mo | $115,000 | $113 | 58 |
| 1429 Kasten Dr | 0.51mi | 3/1.0 | 1,123 (+15%) | 4mo | $119,000 | $106 | 48 |
| 14613 Dante Ave | 0.50mi | 3/1.5 | 1,112 (+14%) | 5mo | $95,000 | $85 | 48 |
Match score weights: distance 35% · size 25% · config 20% · recency 20%. Top-matched comps best support the ARV.
Projected returns pro-forma
-3.0% appreciation · 6.17% rent growth · sell at horizon
- IRR
- 24.8%
- Equity multiple
- 2.07×
- Total profit
- $33,731
- Equity at exit
- $16,834
- IRR
- 34.5%
- Equity multiple
- 4.66×
- Total profit
- $115,746
- Equity at exit
- $9,762
Cash invested: $31,612 (down + closing). Projections, not guarantees.
Landlord ↔ Tenant lean methodology
- Overall (STATE)
- 43 Moderately Tenant-Leaning
- State Illinois
- 43 Moderately Tenant-Leaning · D+7
- County
- — inherits STATE
- City
- — inherits STATE
ZIP-level market 60409
- Home prices YoY
- -27.6%
- Rents YoY
- 6.2%
- Active inventory
- 198
- Price-to-rent
- 5.0×
Monthly cashflow live
- Estimated rent
- $1,897 high interval (Pro) →
- Mortgage (P&I)
- −$592
- Tax est. 1.5%
- −$141 /mo · $1,694/yr
- Insurance
- −$47
- HOA
- −$0
- Vacancy / Maint / Mgmt
- −$398
- Net cashflow
- $718
Break-even live
UW: 25.0% down · 7.5% · 30yr · 1.5% tax · 5.0% vac · 8.0% maint · 8.0% mgmt
Financing live
Cash to close
- Down payment
- $28,225
- Closing costs
- $3,387
- Reserves months
- —
- Total cash needed
- —
Loan-product check · same deal, 3 products live
Conventional
25% down · 7.5% · 30yr
- Down + closing
- —
- Monthly P&I
- —
- Monthly cashflow
- —
- DSCR
- —
- Eligible?
- —
Personal DTI + credit; lowest rate.
DSCR
20% down · 8.5% · 30yr
- Down + closing
- —
- Monthly P&I
- —
- Monthly cashflow
- —
- DSCR
- —
- Eligible?
- —
No personal income docs; deal must DSCR.
Hard money
10% down · 12.0% · 12mo
- Down + closing
- —
- Monthly P&I
- —
- Monthly cashflow
- —
- DSCR
- —
- Eligible?
- —
Short-term bridge; refi at stabilization.
Rent comps 15 comps
| Address | Beds | Baths | Sqft | Rent | $/sqft | DOM | Units | Dist |
|---|---|---|---|---|---|---|---|---|
| 1860 State St Calumet City, IL | 3.0 | 1.0 | 1100 | $1,800 | $1.64 | 17d | 1 | 0.11mi |
| 405 Clyde Ave Calumet City, IL | 3.0 | 1.0 | 973 | $2,300 | $2.36 | 1d | 1 | 0.27mi |
| 250 Yates Ave Unit 1616 Dolton 1E Calumet City, IL | 2.0 | 1.0 | 875 | $1,465 | $1.67 | 7d | 1 | 0.41mi |
| 101 Oglesby Ave Calumet City, IL | 2.0 | 1.0 | 1100 | $1,800 | $1.64 | 12d | 1 | 0.42mi |
| 101 Oglesby Ave Calumet City, IL | 2.0 | 1.0 | 1000 | $1,800 | $1.80 | 19d | 1 | 0.42mi |
| 101 Oglesby Ave Calumet City, IL | 2.0 | 1.0 | 1000 | $1,800 | $1.80 | 22d | 1 | 0.42mi |
| 1601 Downs Dr Unit 3S Calumet City, IL | 2.0 | 1.0 | 750 | $1,400 | $1.87 | 24d | 1 | 0.44mi |
| 14610 Blackstone Ave Dolton, IL | 3.0 | 1.0 | 1017 | $2,400 | $2.36 | 6d | 1 | 0.48mi |
| 14738 Blackstone Ave Dolton, IL | 3.0 | 1.0 | 1017 | $2,400 | $2.36 | 10d | 1 | 0.50mi |
| 14501 Torrence Ave Unit 3A Burnham, IL | 2.0 | 1.0 | 800 | $1,250 | $1.56 | 10d | 1 | 0.70mi |
| 14501 S Torrence Ave Chicago, IL | 1.0–2.0 | 1.0 | 737 | $1,250 | $1.69 | 12d | 2 | 0.70mi |
| 460 Hoxie Ave Unit R Calumet City, IL | 2.0 | 1.0 | 800 | $1,650 | $2.06 | 14d | 1 | 0.70mi |
| 460 Hoxie Ave Unit R Calumet City, IL | 2.0 | 1.0 | 800 | $1,650 | $2.06 | 7d | 1 | 0.70mi |
| 2790 E State St Apt 2E Burnham, IL | 3.0 | 2.0 | 1100 | $1,695 | $1.54 | 24d | 1 | 1.16mi |
| 14500 Cottage Grove Ave Unit 3 Dolton, IL | 2.0 | 1.0 | 1000 | $1,475 | $1.48 | 24d | 1 | 1.37mi |
Listing history 16 events
-
2026-05-06status Pending
-
2026-04-20$112,900 Active
-
2016-06-23soldstatus $14,000 Closed Sale 196-char remark
Show marketing remark (196 chars)
SPACIOUS FRAME SPLIT LEVEL THAT FEATURES 3 BEDROOMS, 1 BATH, BASEMENT, VERY SPACIOUS FRONT YARD, 1 CAR DETACHED GARAGE. CLOSE TO EXPRESSWAYS, AND SHOPPING. THIS IS A FANNIE MAE HOME PATH PROPERTY.
-
2016-04-26status Pending 196-char remark
Show marketing remark (196 chars)
SPACIOUS FRAME SPLIT LEVEL THAT FEATURES 3 BEDROOMS, 1 BATH, BASEMENT, VERY SPACIOUS FRONT YARD, 1 CAR DETACHED GARAGE. CLOSE TO EXPRESSWAYS, AND SHOPPING. THIS IS A FANNIE MAE HOME PATH PROPERTY.
-
2016-04-14status Reactivated 196-char remark
Show marketing remark (196 chars)
SPACIOUS FRAME SPLIT LEVEL THAT FEATURES 3 BEDROOMS, 1 BATH, BASEMENT, VERY SPACIOUS FRONT YARD, 1 CAR DETACHED GARAGE. CLOSE TO EXPRESSWAYS, AND SHOPPING. THIS IS A FANNIE MAE HOME PATH PROPERTY.
-
2016-02-17status Pending 196-char remark
Show marketing remark (196 chars)
SPACIOUS FRAME SPLIT LEVEL THAT FEATURES 3 BEDROOMS, 1 BATH, BASEMENT, VERY SPACIOUS FRONT YARD, 1 CAR DETACHED GARAGE. CLOSE TO EXPRESSWAYS, AND SHOPPING. THIS IS A FANNIE MAE HOME PATH PROPERTY.
-
2016-02-12price $15,000 196-char remark
Show marketing remark (196 chars)
SPACIOUS FRAME SPLIT LEVEL THAT FEATURES 3 BEDROOMS, 1 BATH, BASEMENT, VERY SPACIOUS FRONT YARD, 1 CAR DETACHED GARAGE. CLOSE TO EXPRESSWAYS, AND SHOPPING. THIS IS A FANNIE MAE HOME PATH PROPERTY.
-
2016-02-02$20,600 New 196-char remark
Show marketing remark (196 chars)
SPACIOUS FRAME SPLIT LEVEL THAT FEATURES 3 BEDROOMS, 1 BATH, BASEMENT, VERY SPACIOUS FRONT YARD, 1 CAR DETACHED GARAGE. CLOSE TO EXPRESSWAYS, AND SHOPPING. THIS IS A FANNIE MAE HOME PATH PROPERTY.
-
2015-07-10historical
-
2015-07-07price
-
2015-06-11price
-
2015-05-09price
-
2015-04-03New
-
2000-10-30soldstatus $93,000
-
1988-12-28soldstatus $58,500
-
1981-08-24soldstatus $60,000
ⓘ Source: listings_history table (triggers on properties + properties_extension) + one-shot
backfill from property_details.listing_events for pre-trigger history.
Climate risk First Street
- Flood 5/10 Major FEMA zone X (unshaded) · 65% chance over 30 yrs
- Wildfire 1/10 Low
- Heat 3/10 Moderate 7 d/yr ≥101°F today · 15 d/yr by 30 yrs out
- Wind 2/10 Low 0% chance of damaging wind over 30 yrs
- Air quality 4/10 Moderate 4 unhealthy d/yr today · 5 by 30 yrs out
Nearby sold comps map
Loading sold comps map…
Walkable amenities ~0.75 mi
Loading nearby amenities…
Taxation est. · year 1
- Rental income
- $22,764
- − Mortgage interest
- −$6,324
- − Property taxes
- −$1,694
- − Insurance
- −$564
- − Repairs & maintenance
- −$1,821
- − Management
- −$1,821
- − Depreciation
- −$3,284
- Taxable income
- $7,255
- Est. tax owed @ 24.0%
- −$1,741
- After-tax cash flow
- $6,879/yr
For passive investors: Depreciation is non-cash, so a rental often shows a tax loss while cash-flowing — sheltering income. Rental losses are passive: they offset passive income freely, and up to $25,000/yr can offset ordinary (W-2) income if you actively participate and your MAGI is under $100k (phasing out to $0 by $150k); unused losses carry forward. On sale, claimed depreciation is recaptured at up to 25%, and gains may owe capital-gains tax (a 1031 exchange can defer both). Figures are a year-1 estimate at your 24.0% rate — not tax advice; consult a CPA.
Schools (NCES district)
- District
- Thornton Twp Hsd 205
- NCES district ID
- 1738970
- Math proficiency
- 7% ▬ 0.00%
- Reading proficiency
- 8% ▼ -2.00%
- Median HH income
- $43,392
- Composite
- 6.92/100
- National rank
- #9976
- State rank
- #594 of 620 in IL
Livability — Calumet City
- Score
- 71/100
- State rank
- #330
- US rank
- #6552
Category grades
Schools grade is shown separately in the Schools card above.
Census & demographics
- Census place
- Calumet City, IL
- County
- Cook County · 4,486,803 people
- City population
- 35,100
- Metro
- Chicago-Naperville-Elgin, IL-IN-WI
- Population (ZIP)
- 35,100
- Household income
- $55,369
- Rent vs Own
- Severe rent burden
- 2415.0
Population outlook (Cook County) Hauer SSP2
- Today (2025)
- 5,347,519 people
- By 2030
- 5,357,703 · +0.2%
- By 2040
- 5,324,924 · -0.4%
- By 2050
- 5,230,762 · -2.2%
- By 2075
- 4,785,735 · -10.5%
- By 2100
- 4,188,836 · -21.7%
Race, ethnicity, and origin ACS 2023
- Neighborhood character
- Predominantly Black (74%)
- Race & ethnicity
- Black 74% Hispanic / Latino 15% White 7% Two or more races 4%
- Hispanic origin (detail)
- Mexican 14%
- Common ancestry
- Romanian 2%
- Foreign-born
- 9% · Canada
- Languages at home
- 83% English-only · Spanish 14%
Political lean MEDSL · Cook
- 2024 margin
- Solid D (+42.0) · D 70.4% · R 28.4% · Other 1.2%
- 2008→2024 swing
- -11.4pp toward R · 2008: 53.4pp · 2024: 42.0pp
- All cycles
- 2024: D+42.0 2020: D+50.3 2016: D+53.0 2012: D+49.4 2008: D+53.4
Not yet ingested
- Civics
- —
Market trends
- HPI YoY
- ▼ -75.01%
- Current HPI
- 197.2137
- Rent YoY
- ▲ 6.17%
- Metro
- Chicago-Naperville-Elgin, IL-IN-WI
- State GDP YoY
- ▲ 1.59%
- F500 in state
- 60
Industry mix (Fortune 500 HQ in IL)
| Industry | F500 HQs | Revenue |
|---|---|---|
| Insurance | 4 | $201B |
|
||
| Consumer Goods | 4 | $87B |
|
||
| Industrial Machinery | 3 | $64B |
|
||
| Healthcare | 2 | $55B |
|
||
| Retail / Pharmacy | 1 | $148B |
|
||
| Agriculture / Food | 1 | $86B |
|
||
Price history
+88.2% since first listed16 events — show timeline
- 2026-05-06 Pending — MRED as Distributed by MLS Grid
- 2026-04-20 Listed $112,900 MRED as Distributed by MLS Grid
- 2016-06-23 Sold (MLS) $14,000 MRED as Distributed by MLS Grid
- 2016-04-26 Pending — MRED as Distributed by MLS Grid
- 2016-04-14 Relisted — MRED as Distributed by MLS Grid
- 2016-02-17 Pending — MRED as Distributed by MLS Grid
- 2016-02-12 Price Changed $15,000 MRED as Distributed by MLS Grid
- 2016-02-02 Listed $20,600 MRED as Distributed by MLS Grid
- 2015-07-10 Listing Removed — MRED as Distributed by MLS Grid
- 2015-07-07 Price Changed — MRED as Distributed by MLS Grid
- 2015-06-11 Price Changed — MRED as Distributed by MLS Grid
- 2015-05-09 Price Changed — MRED as Distributed by MLS Grid
- 2015-04-03 Listed — MRED as Distributed by MLS Grid
- 2000-10-30 Sold (Public Records) $93,000 Public Records
- 1988-12-28 Sold (Public Records) $58,500 Public Records
- 1981-08-24 Sold (Public Records) $60,000 Public Records
Property tax history
+5.6%/yrLatest (2023): $7,493 · +15.7% YoY. Source: county tax records.
Cash-flow waterfall
monthlySold comps — $/sqft
last 12 mo · ≤1 miLoading sold comps…