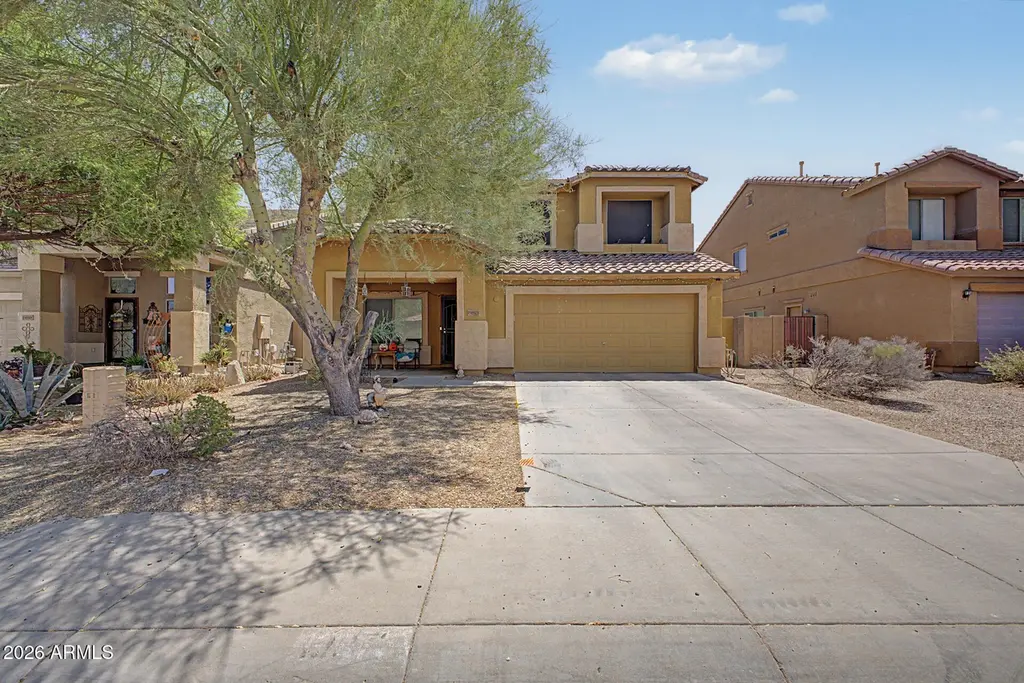
19873 N Castille Dr · Maricopa, AZ
Flood risk 1/10 · Minimal
- FEMA flood zone
- X (shaded)
- Chance of flooding over 30 yrs
- 0.0%
- Est. flood insurance / yr
- $507 – $1,088
Fire risk 7/10 · Major
- Est. fire insurance / yr
- $610 – $1,132
Heat risk 9/10 · Severe
- Hot days now (above 114°F)
- 7 days/yr
- Hot days in 30 yrs
- 16 days/yr
Wind risk 1/10 · Minimal
- Chance of severe wind over 30 yrs
- —
Air-quality risk 1/10 · Minimal
- Unhealthy air days now
- 0 days/yr
- Unhealthy air days in 30 yrs
- 0 days/yr
Risk factors via First Street. Map © Google.
Why this score? — see what drove the C grade
The composite is a weighted blend of 9 inputs, each scored 0–100. Each bar is that input's sub-score; the figure is the points it added to the 100-point composite (weight × sub-score).
- Cash flow +17.1/30.0
- ARV discount +15.0/15.0
- DSCR +5.3/10.0
- Appreciation +4.6/10.0
- 1% rule +4.3/10.0
- Livability +3.6/5.0
- Rent growth +2.9/5.0
- Condition / age +2.5/5.0
- Schools +2.3/10.0
$249,700
🖨 Deal sheet 📄 Offer letter ✓ Due diligence
Listing remarks MLS
Wonderful clean barely lived in home, tile, True 5bd w/ 2.5 bath. Plus Loft, plus bonus room downstairs. Huge master suite with walk in closet, separate shower tub, vaulted ceilings.All window coverings and some appliances included!
Key facts
- Near schools
- Near shopping
- Private backyard
Tags
Property features AI
Finance
- Financial info: Current financing: Other
- HOA & community: Homeowners association with quarterly fee of $260 (fee covers other items as noted in remarks)
Exterior
- Parking: 1 covered parking space; 1 open parking space; 1 garage space
- Utilities: City water; Public sewer; Other utilities
- Home design: Single family residence; Fee simple ownership
- Construction: Wood frame construction; Painted exterior; Concrete roof; Building area reported by owner
- Exterior features: Block fencing; No notable lot features listed
Interior
- Kitchen: Kitchen island; Refrigerator; Dishwasher
- Bedrooms: Up to 5 possible bedrooms
- Bathrooms: 3 full bathrooms
- Heating & cooling: Natural gas heating; Ceiling fans; Other cooling
- Interior features: Kitchen island; Refrigerator; Dishwasher; Laundry details available (see remarks)
- Laundry & utility: Laundry details noted in remarks
Neighborhood map
What this means for you Summary
Snapshot
- This is a 5-bed/3.0-bath single-family listed at $250k.
Deal economics
- At list price, monthly cash flow is $172 ($2k/yr) — positive.
- The deal already cash-flows at list — no discount required.
- To meet the 1% rule (rent ≥ 1% of price), the offer needs to be $233k (6.8% below list).
- Recommended offer: $233k (6.8% below list) — sets the bar for 1% rule.
- Cap rate 7.1% vs local median 3.7% in Maricopa — top-decile yield for the area; either an underpriced asset or a hidden risk that comps aren't pricing in. Stress-test before assuming the spread holds.
Location & tenants
- Location reads 72/100 on livability (#28 in AZ) — a middle-class / working-renter tenant base. Strengths: housing A+, employment A-, crime B+; Watch: amenities F, commute F, health & safety F.
- Maricopa Unified School District (4441) (town): math 20% / reading 29% proficiency, ranked #128 of 249 in AZ (top 51%) — low school quality limits family demand, transient renter base, plan for 1-2y turnover.
- Zoned schools: Santa Cruz Elementary School (math 27% / reading 34%, grade F, #536 of 1,109 statewide, top 49%, 764 students, 59% FRL); Desert Wind Middle School (math 14% / reading 26%, grade F, #127 of 218 statewide, top 60%, 817 students, 52% FRL); Maricopa High School (math 12% / reading 19%, grade F, #262 of 381 statewide, top 69%, 2,188 students, 46% FRL).
- Market conditions: Rents rising (+1.8%/yr); 845 active listings in the ZIP; 12 comparable units currently listed for rent nearby; rentals at typical pace (median 25d on market — plan ~3-4 weeks tenant-placement turnaround); solid renter incomes; 9,504 units permitted in Pinal County in 2024 (776 in 5+ unit buildings).
Forward outlook
- Local home prices are declining (-0.9%/yr); year-one equity from $2k of loan paydown is wiped out by about $2k of value loss. Plan a longer hold.
Negotiation context
- Only 6 days on market — expect competitive offers; lowballing is unlikely to land.
- 3 sale attempts since 18y ago with the ask held roughly flat each time — persistent listings suggest the price (not the market) is what's stuck; bring a comps-based counter.
- Current owner paid $109k; list at $250k implies a 129% gain — meaningful room to come down on a strong offer.
Risks & watch-outs
- Climate carrying-cost: major wildfire risk; extreme-heat days projected 7→16/yr by 2055 (HVAC capex compounding) — expect insurance premiums to compound above CPI over the hold.
Questions for the listing agent
- What does the HOA fee cover, when was the last increase, and are there any pending special assessments or reserve-fund shortfalls?
- Is there a deadline driving the sale (1031 exchange, divorce, estate, relocation)? That informs how much negotiation room exists.
- Schools are B-rated — typically a magnet for longer-tenancy family renters. What's the average tenant stay here, and is there a school-zone premium baked into asking?
- What's the average days-on-market for RENTAL listings here right now (not sales)? A rising rental-DOM trend means longer vacancies and softer asking-rent achievability than the comps imply.
- What's the recent tenant-quality profile in this submarket — average credit score on applications, eviction rate, late-payment / NSF rate, and stable-employment percentage? A property-management company in the area should have these aggregated.
- How much new for-sale + rental construction is in the pipeline within 1–3 miles? Heavy new supply typically softens prices + rents 12–24 months out; constrained supply supports both.
Investment metrics
- 1% rule
- 0.93% ✗
- Cap rate
- 7.12%
- Cash-on-cash
- 2.95%
- DSCR
- 1.13
- GRM
- 8.9
CMA / ARV
- ARV (on-the-fly)
- $439,040
- Comps found
- 12
Show comp detail 12 sales within ~0.75 mi
| Address | Dist | Beds/Ba | Sqft | Sold | Price | $/sf | Match |
|---|---|---|---|---|---|---|---|
| 36265 W Alhambra St | 0.11mi | 5/2.5 | 2,745 (0%) | 8mo | $375,000 | $137 | 86 |
| 36066 W Vera Cruz Dr | 0.29mi | 5/3.0 | 2,788 (+2%) | 3mo | $420,000 | $151 | 82 |
| 19324 N Del Mar Ave | 0.36mi | 5/3.0 | 2,788 (+2%) | 6mo | $399,900 | $143 | 75 |
| 37111 W Parador Ln | 0.73mi | 5/3.0 | 2,776 (+1%) | 7mo | $412,990 | $149 | 58 |
| 36766 W Nina St | 0.64mi | 5/3.0 | 2,537 (-8%) | 3mo | $419,990 | $166 | 55 |
| 18939 N Avelino Dr | 0.67mi | 5/3.0 | 2,537 (-8%) | 3mo | $406,300 | $160 | 54 |
| 18925 N Avelino Dr | 0.68mi | 5/3.0 | 2,537 (-8%) | 5mo | $387,990 | $153 | 52 |
| 19176 N Bandin Dr | 0.71mi | 5/3.0 | 2,530 (-8%) | 6mo | $401,590 | $159 | 49 |
| 37192 W Parador Ln | 0.74mi | 5/3.0 | 2,530 (-8%) | 5mo | $455,000 | $180 | 48 |
| 37152 W Parador St | 0.72mi | 5/3.0 | 2,530 (-8%) | 7mo | $439,990 | $174 | 47 |
| 19165 N Los Gabrieles Way | 0.60mi | 4/2.5 (-1) | 2,476 (-10%) | 5mo | $413,000 | $167 | 45 |
| 19225 N Los Gabrieles Way | 0.60mi | 4/2.5 (-1) | 2,377 (-13%) | 5mo | $382,000 | $161 | 39 |
Match score weights: distance 35% · size 25% · config 20% · recency 20%. Top-matched comps best support the ARV.
Projected returns pro-forma
-0.89% appreciation · 1.78% rent growth · sell at horizon
- IRR
- -3.1%
- Equity multiple
- 0.87×
- Total profit
- $-9,395
- Equity at exit
- $61,623
- IRR
- 2.5%
- Equity multiple
- 1.23×
- Total profit
- $16,281
- Equity at exit
- $65,865
Cash invested: $69,916 (down + closing). Projections, not guarantees.
Landlord ↔ Tenant lean methodology
- Overall (STATE)
- 87 Strongly Landlord-Friendly
- State Arizona
- 87 Strongly Landlord-Friendly · R+3
- County
- — inherits STATE
- City
- — inherits STATE
ZIP-level market 85138
- Home prices YoY
- -0.3%
- Rents YoY
- 1.8%
- Active inventory
- 845
- Price-to-rent
- 8.9×
Monthly cashflow live
- Estimated rent
- $2,328 high interval (Pro) →
- Mortgage (P&I)
- −$1,309
- Tax from tax record
- −$166 /mo · $1,998/yr
- Insurance
- −$104
- HOA
- −$87
- Vacancy / Maint / Mgmt
- −$489
- Net cashflow
- $172
Break-even live
UW: 25.0% down · 7.5% · 30yr · 1.5% tax · 5.0% vac · 8.0% maint · 8.0% mgmt
Financing live
Cash to close
- Down payment
- $62,425
- Closing costs
- $7,491
- Reserves months
- —
- Total cash needed
- —
Loan-product check · same deal, 3 products live
Conventional
25% down · 7.5% · 30yr
- Down + closing
- —
- Monthly P&I
- —
- Monthly cashflow
- —
- DSCR
- —
- Eligible?
- —
Personal DTI + credit; lowest rate.
DSCR
20% down · 8.5% · 30yr
- Down + closing
- —
- Monthly P&I
- —
- Monthly cashflow
- —
- DSCR
- —
- Eligible?
- —
No personal income docs; deal must DSCR.
Hard money
10% down · 12.0% · 12mo
- Down + closing
- —
- Monthly P&I
- —
- Monthly cashflow
- —
- DSCR
- —
- Eligible?
- —
Short-term bridge; refi at stabilization.
Rent comps 12 comps
| Address | Beds | Baths | Sqft | Rent | $/sqft | DOM | Units | Dist |
|---|---|---|---|---|---|---|---|---|
| 36148 W Seville Dr Maricopa, AZ | 4.0 | 3.0 | 1950 | $2,450 | $1.26 | 15d | 1 | 0.29mi |
| 37043 W Vera Cruz Dr Maricopa, AZ | 4.0 | 2.0 | 1832 | $2,300 | $1.26 | 1d | 1 | 0.57mi |
| 18853 N Vemto St Maricopa, AZ | 4.0 | 3.0 | 2233 | $1,895 | $0.85 | 24d | 1 | 0.64mi |
| 36033 W San Clemente Ave Maricopa, AZ | 4.0 | 2.0 | 1775 | $1,700 | $0.96 | 44d | 1 | 0.72mi |
| 35455 W Cartegna Ln Maricopa, AZ | 4.0 | 2.0 | 1832 | $2,200 | $1.20 | 10d | 1 | 0.75mi |
| 35450 W Santa Clara Ave Maricopa, AZ | 5.0 | 5.5 | 3199 | $2,500 | $0.78 | 24d | 1 | 0.98mi |
| 36419 W San Ildefanso Ave Maricopa, AZ | 4.0 | 2.0 | 1849 | $1,795 | $0.97 | 15d | 1 | 0.98mi |
| 35963 W San Alvarez Ave Maricopa, AZ | 4.0 | 2.0 | 1922 | $1,995 | $1.04 | 24d | 1 | 1.05mi |
| 37963 W Merced St Maricopa, AZ | 4.0 | 3.0 | 2488 | $2,285 | $0.92 | 22d | 1 | 1.12mi |
| 37154 W Amalfi Ave Maricopa, AZ | 4.0 | 2.5 | 2223 | $1,695 | $0.76 | 24d | 1 | 1.30mi |
| 18735 N Ravello Rd Maricopa, AZ | 5.0 | 3.0 | 1997 | $2,450 | $1.23 | 44d | 1 | 1.31mi |
| 17936 N Lettere Cir Maricopa, AZ | 4.0 | 2.5 | 2012 | $1,800 | $0.89 | 5d | 1 | 1.42mi |
HOA detail
- Monthly dues
- $87 · $1,044/yr
Listing history 6 events
-
2026-06-18days on market $249,700 Active 6 DOM
-
2026-06-17days on market $249,700 Active 5 DOM
-
2026-06-16days on market $249,700 Active 4 DOM
-
2026-06-15days on market $249,700 Active 3 DOM
-
2026-06-13remarks 633-char remark
-
2026-06-13$249,700 Active 1 DOM
ⓘ Source: listings_history table (triggers on properties + properties_extension) + one-shot
backfill from property_details.listing_events for pre-trigger history.
Tax reassessment forecast AZ · Resets to sale price
- Current annual tax
- $1,998 · $166/mo
- Projected year-2 tax
- $1,998 · $166/mo
- Expected delta
- $0/yr ($0/mo · 0.0%)
ⓘ Screening estimate from a state-policy table — verify with the county assessor before closing.
Climate risk First Street
- Flood 1/10 Low FEMA zone X (shaded) · 0% chance over 30 yrs
- Wildfire 7/10 Severe
- Heat 9/10 Extreme 7 d/yr ≥114°F today · 16 d/yr by 30 yrs out
- Wind 1/10 Low
- Air quality 1/10 Low 0 unhealthy d/yr today · 0 by 30 yrs out
Nearby sold comps map
Loading sold comps map…
Walkable amenities ~0.75 mi
Loading nearby amenities…
Taxation est. · year 1
- Rental income
- $27,936
- − Mortgage interest
- −$13,987
- − Property taxes
- −$1,998
- − Insurance
- −$1,248
- − Repairs & maintenance
- −$2,235
- − Management
- −$2,235
- − HOA
- −$1,044
- − Depreciation
- −$7,264
- Taxable loss
- −$2,075
- Est. tax savings @ 24.0%
- +$498
- After-tax cash flow
- $2,564/yr
For passive investors: Depreciation is non-cash, so a rental often shows a tax loss while cash-flowing — sheltering income. Rental losses are passive: they offset passive income freely, and up to $25,000/yr can offset ordinary (W-2) income if you actively participate and your MAGI is under $100k (phasing out to $0 by $150k); unused losses carry forward. On sale, claimed depreciation is recaptured at up to 25%, and gains may owe capital-gains tax (a 1031 exchange can defer both). Figures are a year-1 estimate at your 24.0% rate — not tax advice; consult a CPA.
Schools (NCES district)
- District
- Maricopa Unified School District (4441)
- NCES district ID
- 0404720
- Math proficiency
- 20% ▼ -18.00%
- Reading proficiency
- 29% ▼ -9.00%
- Median HH income
- $63,725
- Composite
- 22.92/100
- National rank
- #7993
- State rank
- #128 of 249 in AZ
Livability — Maricopa
- Score
- 72/100
- State rank
- #28
- US rank
- #5943
Category grades
Schools grade is shown separately in the Schools card above.
Census & demographics
- Census place
- Maricopa, AZ
- County
- Pinal County · 399,947 people
- City population
- 76,044
- Metro
- Phoenix-Mesa-Chandler, AZ
- Population (ZIP)
- 55,260
- Household income
- $95,867
- Rent vs Own
- Severe rent burden
- 432.0
Population outlook (Pinal County) Hauer SSP2
- Today (2025)
- 437,574 people
- By 2030
- 446,903 · +2.1%
- By 2040
- 452,589 · +3.4%
- By 2050
- 444,126 · +1.5%
- By 2075
- 430,300 · -1.7%
- By 2100
- 393,536 · -10.1%
Race, ethnicity, and origin ACS 2023
- Neighborhood character
- Diverse neighborhood (Simpson 0.69)
- Race & ethnicity
- White 45% Hispanic / Latino 30% Two or more races 17% Black 13% Native American 3% Asian 3% Pacific Islander 1%
- Hispanic origin (detail)
- Mexican 26% Puerto Rican 1%
- Common ancestry
- Lithuanian 2% Romanian 2% Italian 2%
- Foreign-born
- 10% · Canada
- Languages at home
- 79% English-only · Spanish 16% Other Asian/Pacific 1% Other Indo-European 1%
Political lean MEDSL · Pinal
- 2024 margin
- Strong R (+22.1) · D 38.5% · R 60.6%
- 2008→2024 swing
- -7.6pp toward R · 2008: -14.5pp · 2024: -22.1pp
- All cycles
- 2024: R+22.1 2020: R+17.3 2016: R+19.3 2012: R+17.1 2008: R+14.5
Not yet ingested
- Civics
- —
Market trends
- HPI YoY
- ▼ -0.89%
- Current HPI
- 258.1461
- Rent YoY
- ▲ 1.78%
- Metro
- Phoenix-Mesa-Chandler, AZ
- State GDP YoY
- ▲ 4.54%
- F500 in state
- 20
Industry mix (Fortune 500 HQ in AZ)
| Industry | F500 HQs | Revenue |
|---|---|---|
| Technology | 2 | $13B |
|
||
| Mining / Metals | 1 | $23B |
|
||
| Environmental Services | 1 | $16B |
|
||
| Metals / Steel | 1 | $14B |
|
||
| Technology Distribution | 1 | $9B |
|
||
| Homebuilding | 1 | $8B |
|
||
Price history
-93.7% since first listed7 events — show timeline
- 2026-06-12 Listed $249,700 ARMLS
- 2009-06-24 Sold (MLS) $109,200 ARMLS
- 2009-05-12 Listing Removed — ARMLS
- 2008-12-26 Listed $105,000 ARMLS
- 2008-11-22 Listing Removed — ARMLS
- 2008-07-23 Listed $120,000 ARMLS
- 2004-07-29 Sold (Public Records) $3,976,350 Public Records
Property tax history
-1.2%/yrLatest (2025): $1,998 · +3.6% YoY. Source: county tax records.
Cash-flow waterfall
monthlySold comps — $/sqft
last 12 mo · ≤1 miLoading sold comps…