1500 Evergreen Ave #33 · Mission, TX
Flood risk 1/10 · Minimal
- FEMA flood zone
- —
- Chance of flooding over 30 yrs
- 0.0%
- Est. flood insurance / yr
- —
Fire risk 1/10 · Minimal
- Est. fire insurance / yr
- $1,222 – $2,270
Heat risk 9/10 · Severe
- Hot days now (above 111°F)
- 7 days/yr
- Hot days in 30 yrs
- 22 days/yr
Wind risk 8/10 · Major
- Chance of severe wind over 30 yrs
- 94.0%
Air-quality risk 2/10 · Minimal
- Unhealthy air days now
- 1 days/yr
- Unhealthy air days in 30 yrs
- 2 days/yr
Risk factors via First Street. Map © Google.
Why this score? — see what drove the C- grade
The composite is a weighted blend of 9 inputs, each scored 0–100. Each bar is that input's sub-score; the figure is the points it added to the 100-point composite (weight × sub-score).
- Cash flow +19.2/30.0
- 1% rule +7.4/10.0
- ARV discount +6.9/15.0
- DSCR +6.0/10.0
- Livability +3.8/5.0
- Condition / age +3.8/5.0
- Rent growth +2.7/5.0
- Schools +1.7/10.0
- Appreciation +0.0/10.0
$79,500
🖨 Deal sheet 📄 Offer letter ✓ Due diligence
Listing remarks
This one has it all; Ready to move in condominium, ideally located, tastefully furnished, fresh paint throughout, new tile floors, Virtually new AC & Water Heater, New closets with shelves, New kitchen pantry. Open floor plan connects to patio through glass double door to enjoy a drink plus accentuates this immaculate 2 bed, 1 full bathroom & 1 half bath, 1 dining, 1 living jewel for an amazing price. This condo includes, decorative lighting in living room, ceiling fans, stove, refrigerator, washer, dryer, 2 queen beds with bedding, nightstands, lamps, 2 piece living room, coffee table, 4 chair dining set, curtains/mini blinds. Evergreen manor is a 55+community offers 2 gazebos
Key facts
- New tile floors
- New kitchen pantry
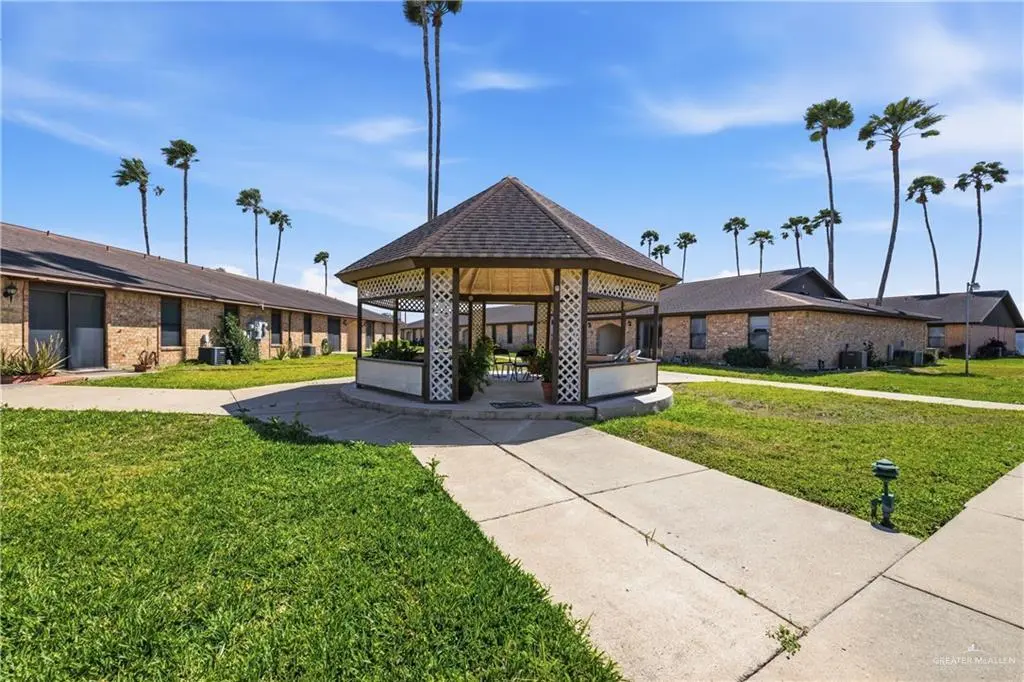
- 2 gazebos
Tags
Property features AI
Finance
- Other: Senior community
- HOA & community: Monthly association fee of $145; Evergreen Manor Condos community; Community pool; Curbs and sidewalks; Mandatory POA
Exterior
- Parking: No garage; No carport
- Utilities: Public water; City sewer; Paved road access; Electric service
- Home design: Condo unit in Evergreen Manor Condos; Entry on ground level (unit in building)
- Construction: Brick construction; Shingle roof; Slab foundation; Built area approximately 720
- Exterior features: Mature trees; Professional landscaping; Sprinkler system; Curb and gutters; Sidewalks; Patio slab; Private outdoor in-ground pool
Interior
- Kitchen: Electric cooktop; Refrigerator; Electric water heater
- Bedrooms: Bedroom layout includes split bedrooms
- Flooring: Tile flooring
- Bathrooms: 1 full bathroom; 1 half bathroom
- Heating & cooling: Central heating (electric); Central air conditioning (electric); Thermostat
- Interior features: Solid surface countertops; Ceiling fan(s); Decorative / high ceilings; Split bedroom floor plan; Walk-in closet(s); Drapes; Partial window coverings
- Laundry & utility: Laundry room; Washer/dryer connection; Washer and dryer listed among interior features
Neighborhood map
What this means for you Summary
Snapshot
- This is a 2-bed/1.5-bath condo listed at $80k. Condition is rated good.
Deal economics
- At list price, monthly cash flow is $85 ($1k/yr) — positive.
- The deal already cash-flows at list — no discount required.
- Meets the 1% rule at list price ($987 rent vs $80k).
- Recommended offer: $77k (3.0% below list) — sets the bar for market timing.
- Cap rate 7.6% vs local median 3.5% in Mission — top-decile yield for the area; either an underpriced asset or a hidden risk that comps aren't pricing in. Stress-test before assuming the spread holds.
Location & tenants
- Location reads 75/100 on livability (#148 in TX, #4,155 nationally) — a middle-class / working-renter tenant base. Strengths: cost of living A+, housing A+, health & safety A+; Watch: amenities F, commute F, employment D-.
- Mission CISD (urban): math 15% / reading 28% proficiency, ranked #775 of 826 in TX (top 94%) — low school quality limits family demand, transient renter base, plan for 1-2y turnover; 78% free/reduced lunch — lower-income household profile, screen leases tightly.
- Zoned schools: Bryan El (math 17% / reading 32%, grade F, #3,052 of 4,322 statewide, top 74%, 651 students, 71% FRL); Mission J H (math 13% / reading 26%, grade F, #1,445 of 1,662 statewide, top 88%, 680 students, 78% FRL); Veterans Memorial H S (math 19% / reading 44%, grade F, #1,073 of 1,632 statewide, top 66%, 1,932 students, 81% FRL) — zoned schools at 77% FRL track the district average.
- Market conditions: Rents flat; 852 active listings in the ZIP; 9 comparable units currently listed for rent nearby; rentals lingering (median 44d on market — plan ~5-8 weeks vacancy on turnover, expect pricing pressure); 89% of comp listings sitting > 30 days — soft ceiling on asking rent; 7,378 units permitted in Hidalgo County in 2024 (641 in 5+ unit buildings).
Forward outlook
- Local home prices are declining (-3.0%/yr); year-one equity from $550 of loan paydown is wiped out by about $2k of value loss. Plan a longer hold.
- Hidalgo County population projected at +28% by 2050 — long-run rental-demand tailwind backs the buy-and-hold thesis.
Negotiation context
- It's been on market 37 days — a 3% lower offer ($77k) is reasonable based on typical stale-listing flexibility.
- 2 sale attempts with the ask held roughly flat each time — persistent listings suggest the price (not the market) is what's stuck; bring a comps-based counter.
Risks & watch-outs
- Climate carrying-cost: severe wind risk, 94% chance of damaging wind over 30y; extreme-heat days projected 7→22/yr by 2055 (HVAC capex compounding) — expect insurance premiums to compound above CPI over the hold.
Questions for the listing agent
- It's been on market 37 days. Have you received any prior offers? Is the seller open to a 3% concession, seller financing, or rate buy-down credit?
- Built in 1979 — when were the roof, HVAC, electrical panel, plumbing, and water heater last replaced?
- What does the HOA fee cover, when was the last increase, and are there any pending special assessments or reserve-fund shortfalls?
- Any open or pending special assessments — roof, HVAC, plumbing, elevator, façade? What's the per-unit balance and payoff schedule, and is the seller paying it off at close or rolling it to the buyer?
- Is there a deadline driving the sale (1031 exchange, divorce, estate, relocation)? That informs how much negotiation room exists.
- What's the average days-on-market for RENTAL listings here right now (not sales)? A rising rental-DOM trend means longer vacancies and softer asking-rent achievability than the comps imply.
- What's the recent tenant-quality profile in this submarket — average credit score on applications, eviction rate, late-payment / NSF rate, and stable-employment percentage? A property-management company in the area should have these aggregated.
- How much new apartment / multifamily construction is in the pipeline within 1–3 miles? Heavy new supply (>2% of stock underway) typically softens rents 12–24 months out; light construction supports rent growth.
Investment metrics
- 1% rule
- 1.24% ✓
- Cap rate
- 7.58%
- Cash-on-cash
- 4.59%
- DSCR
- 1.20
- GRM
- 6.7
CMA / ARV
- ARV (median comp)
- $78,438
- List price
- $79,500
- Delta
- 1.35%
- Verdict
- FAIR
- Comps
- 16 within 1.0 mi
Projected returns pro-forma
-3.0% appreciation · 0.93% rent growth · sell at horizon
- IRR
- -11.9%
- Equity multiple
- 0.58×
- Total profit
- $-9,369
- Equity at exit
- $11,854
- IRR
- -6.9%
- Equity multiple
- 0.61×
- Total profit
- $-8,680
- Equity at exit
- $6,874
Cash invested: $22,260 (down + closing). Projections, not guarantees.
Landlord ↔ Tenant lean methodology
- Overall (STATE)
- 87 Strongly Landlord-Friendly
- State Texas
- 87 Strongly Landlord-Friendly · R+5
- County
- — inherits STATE
- City
- — inherits STATE
ZIP-level market 78572
- Home prices YoY
- -22.9%
- Rents YoY
- 0.9%
- Active inventory
- 852
- Price-to-rent
- 6.7×
Monthly cashflow live
- Estimated rent
- $987 high interval (Pro) →
- Mortgage (P&I)
- −$417
- Tax est. 1.5%
- −$99 /mo · $1,192/yr
- Insurance
- −$33
- HOA
- −$145
- Vacancy / Maint / Mgmt
- −$207
- Net cashflow
- $85
Break-even live
UW: 25.0% down · 7.5% · 30yr · 1.5% tax · 5.0% vac · 8.0% maint · 8.0% mgmt
Financing live
Cash to close
- Down payment
- $19,875
- Closing costs
- $2,385
- Reserves months
- —
- Total cash needed
- —
Loan-product check · same deal, 3 products live
Conventional
25% down · 7.5% · 30yr
- Down + closing
- —
- Monthly P&I
- —
- Monthly cashflow
- —
- DSCR
- —
- Eligible?
- —
Personal DTI + credit; lowest rate.
DSCR
20% down · 8.5% · 30yr
- Down + closing
- —
- Monthly P&I
- —
- Monthly cashflow
- —
- DSCR
- —
- Eligible?
- —
No personal income docs; deal must DSCR.
Hard money
10% down · 12.0% · 12mo
- Down + closing
- —
- Monthly P&I
- —
- Monthly cashflow
- —
- DSCR
- —
- Eligible?
- —
Short-term bridge; refi at stabilization.
Rent comps 9 comps
| Address | Beds | Baths | Sqft | Rent | $/sqft | DOM | Units | Dist |
|---|---|---|---|---|---|---|---|---|
| 106 S Bryan Rd Unit 13 Mission, TX | 2.0 | 1.0 | 720 | $725 | $1.01 | 43d | 1 | 0.49mi |
| 402 Cory Dr Unit B-10 Mission, TX | 2.0 | 1.0 | 714 | $750 | $1.05 | 43d | 1 | 0.67mi |
| 816 Travis St Mission, TX | 1.0–2.0 | 1.0–2.0 | 952 | $1,215 | $1.28 | 43d | 12 | 0.96mi |
| 716 Ragland Rd #3 Mission, TX | 1.0 | 1.0 | 651 | $925 | $1.42 | 43d | 1 | 1.17mi |
| 720 Ragland Rd #6 Mission, TX | 1.0 | 1.0 | 651 | $925 | $1.42 | 43d | 1 | 1.17mi |
| 800 Ragland Rd Unit 5 Mission, TX | 1.0 | 1.0 | 651 | $925 | $1.42 | 43d | 1 | 1.17mi |
| 806 Ragland Rd Unit 1 Mission, TX | 1.0 | 1.0 | 651 | $925 | $1.42 | 43d | 1 | 1.17mi |
| 1901 N Glasscock Rd Lot 37 Mission, TX | 1.0 | 1.0 | 419 | $650 | $1.55 | 43d | 1 | 1.33mi |
| 2210 E 1st St Unit 34 Mission, TX | 1.0 | 1.0 | 700 | $850 | $1.21 | 23d | 1 | 1.39mi |
HOA detail condo
- Monthly dues
- $145 · $1,740/yr
- Likely covers
- water
- Assessments
- None detected in remarks — confirm with the listing agent.
Listing history 17 events
-
2026-06-18days on market $79,500 Active 37 DOM
-
2026-06-17days on market $79,500 Active 36 DOM
-
2026-06-16days on market $79,500 Active 35 DOM
-
2026-06-15days on market $79,500 Active 34 DOM
-
2026-06-14days on market $79,500 Active 32 DOM
-
2026-06-10days on market $79,500 Active 29 DOM
-
2026-06-09days on market $79,500 Active 28 DOM
-
2026-06-08days on market $79,500 Active 27 DOM
-
2026-06-07days on market $79,500 Active 26 DOM
-
2026-06-03days on market $79,500 Active 22 DOM
-
2026-06-02days on market $79,500 Active 21 DOM
-
2026-06-01days on market $79,500 Active 20 DOM
-
2026-05-31days on market $79,500 Active 19 DOM
-
2026-05-31days on market $79,500 Active 18 DOM
-
2026-05-12$79,500 Active 997-char remark
-
2026-04-15price $79,500
-
2026-02-18$83,000 Active
ⓘ Source: listings_history table (triggers on properties + properties_extension) + one-shot
backfill from property_details.listing_events for pre-trigger history.
Climate risk First Street
- Flood 1/10 Low 0% chance over 30 yrs
- Wildfire 1/10 Low
- Heat 9/10 Extreme 7 d/yr ≥111°F today · 22 d/yr by 30 yrs out
- Wind 8/10 Severe 94% chance of damaging wind over 30 yrs
- Air quality 2/10 Low 1 unhealthy d/yr today · 2 by 30 yrs out
Nearby sold comps map
Loading sold comps map…
Walkable amenities ~0.75 mi
Loading nearby amenities…
Taxation est. · year 1
- Rental income
- $11,841
- − Mortgage interest
- −$4,453
- − Property taxes
- −$1,192
- − Insurance
- −$398
- − Repairs & maintenance
- −$947
- − Management
- −$947
- − HOA
- −$1,740
- − Depreciation
- −$2,313
- Taxable loss
- −$149
- Est. tax savings @ 24.0%
- +$36
- After-tax cash flow
- $1,058/yr
For passive investors: Depreciation is non-cash, so a rental often shows a tax loss while cash-flowing — sheltering income. Rental losses are passive: they offset passive income freely, and up to $25,000/yr can offset ordinary (W-2) income if you actively participate and your MAGI is under $100k (phasing out to $0 by $150k); unused losses carry forward. On sale, claimed depreciation is recaptured at up to 25%, and gains may owe capital-gains tax (a 1031 exchange can defer both). Figures are a year-1 estimate at your 24.0% rate — not tax advice; consult a CPA.
Condition & rehab AI · 12 photos
This 2-bedroom, 1.5-bathroom condo is move-in ready with fresh paint, new tile floors, and new HVAC systems. It offers a good condition score and is located in a desirable community with amenities like gazebos and a pool.
Value-add opportunities
- Both landscaping — improves curb appeal and enhances property value
- Both HVAC/mechanicals — new AC & Water Heater improve comfort and energy efficiency
- Both interior walls/paint — fresh paint enhances curb appeal and interior aesthetics
Renovation cost estimate screening
Value-add ROI direction
- Both landscaping — improves curb appeal and enhances property value ↑
- Both HVAC/mechanicals — new AC & Water Heater improve comfort and energy efficiency ↑
- Both interior walls/paint — fresh paint enhances curb appeal and interior aesthetics ↑
ⓘ Cost ranges are severity-bucket heuristics (US national rule-of-thumb). Get contractor quotes + a written scope before underwriting a rehab budget.
Schools (NCES district)
- District
- Mission CISD
- NCES district ID
- 4831040
- Math proficiency
- 15% ▼ -35.00%
- Reading proficiency
- 28% ▼ -15.00%
- Median HH income
- $32,855
- Composite
- 17.47/100
- National rank
- #9061
- State rank
- #775 of 826 in TX
Livability — Mission
- Score
- 75/100
- State rank
- #148
- US rank
- #4155
Category grades
Schools grade is shown separately in the Schools card above.
Census & demographics
- Census place
- Mission, TX
- County
- Hidalgo County · 623,128 people
- City population
- 78,024
- Metro
- McAllen-Edinburg-Mission, TX
- Population (ZIP)
- 78,024
- Household income
- $54,298
- Rent vs Own
- Severe rent burden
- 1714.0
Population outlook (Hidalgo County) Hauer SSP2
- Today (2025)
- 955,232 people
- By 2030
- 1,009,774 · +5.7%
- By 2040
- 1,120,332 · +17.3%
- By 2050
- 1,225,036 · +28.2%
- By 2075
- 1,439,189 · +50.7%
- By 2100
- 1,533,429 · +60.5%
Race, ethnicity, and origin ACS 2023
- Neighborhood character
- Predominantly Hispanic (85%)
- Race & ethnicity
- Hispanic / Latino 85% Two or more races 47% White 12% Asian 2%
- Hispanic origin (detail)
- Mexican 80%
- Common ancestry
- Slovak 1% Portuguese 0%
- Foreign-born
- 28% · Canada, South Korea
- Languages at home
- 22% English-only · Spanish 76%
Political lean MEDSL · Hidalgo
- 2024 margin
- Toss-up / Even · D 48.1% · R 51.0%
- 2008→2024 swing
- -41.6pp toward R · 2008: 38.7pp · 2024: -2.9pp
- All cycles
- 2024: R+2.9 2020: D+17.1 2016: D+40.5 2012: D+41.8 2008: D+38.7
Not yet ingested
- Civics
- —
Market trends
- HPI YoY
- ▼ -62.35%
- Current HPI
- 209.3573
- Rent YoY
- ▲ 0.93%
- Metro
- McAllen-Edinburg-Mission, TX
- State GDP YoY
- ▲ 3.95%
- F500 in state
- 110
Industry mix (Fortune 500 HQ in TX)
| Industry | F500 HQs | Revenue |
|---|---|---|
| Energy | 16 | $1,198B |
|
||
| Technology | 5 | $198B |
|
||
| Engineering / Construction | 4 | $72B |
|
||
| Energy Services | 3 | $60B |
|
||
| Utilities | 3 | $41B |
|
||
| Healthcare | 2 | $330B |
|
||
Price history
-4.2% since first listed3 events — show timeline
- 2026-05-12 Listed $79,500 MCALLENMLS
- 2026-04-15 Price Changed $79,500 MCALLENMLS
- 2026-02-18 Listed $83,000 MCALLENMLS
Cash-flow waterfall
monthlySold comps — $/sqft
last 12 mo · ≤1 miLoading sold comps…