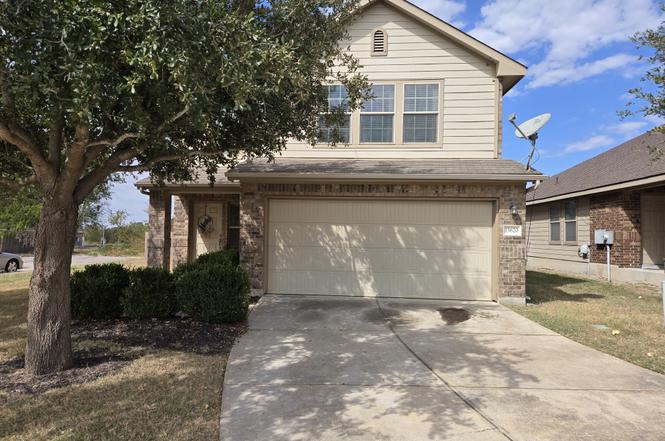
13620 Sierra Wind Ln · Elgin, TX
Flood risk 1/10 · Minimal
- FEMA flood zone
- X (unshaded)
- Chance of flooding over 30 yrs
- 0.0%
- Est. flood insurance / yr
- $507 – $1,088
Fire risk 4/10 · Minor
- Est. fire insurance / yr
- $1,222 – $2,270
Heat risk 8/10 · Major
- Hot days now (above 109°F)
- 7 days/yr
- Hot days in 30 yrs
- 23 days/yr
Wind risk 8/10 · Major
- Chance of severe wind over 30 yrs
- 80.0%
Air-quality risk 1/10 · Minimal
- Unhealthy air days now
- 0 days/yr
- Unhealthy air days in 30 yrs
- 0 days/yr
Risk factors via First Street. Map © Google.
Why this score? — see what drove the C- grade
The composite is a weighted blend of 9 inputs, each scored 0–100. Each bar is that input's sub-score; the figure is the points it added to the 100-point composite (weight × sub-score).
- ARV discount +15.0/15.0
- Cash flow +10.3/30.0
- Appreciation +10.0/10.0
- 1% rule +5.0/10.0
- Livability +3.7/5.0
- Rent growth +3.3/5.0
- DSCR +3.0/10.0
- Condition / age +2.5/5.0
- Schools +2.0/10.0
$219,999
🖨 Deal sheet 📄 Offer letter ✓ Due diligence
Listing remarks
* Fixer Upper * , Nestled on a corner lot, 4 huge bedrooms, 2 and a half baths, Big backyard with mature trees. Open and inviting floor plan, spacious kitchen with plenty of cabinet and counter top space. The over sized master suite has 11 ft ceilings, gigantic his/hers walk in closets, this home offers comfort and relaxation, must be seen to be appreciated.
Key facts
- Big backyard
- Spacious kitchen
- Corner lot
Tags
Property features AI
Exterior
- Parking: 1-car garage
- Home design: Built in 2011
- Construction: Single-family property
- Exterior features: 0.16-acre lot
Interior
- Interior features: Located in the Westwind subdivision
Neighborhood map
What this means for you Summary
Snapshot
- This is a 3-bed/3.0-bath single-family listed at $220k.
Deal economics
- At list price, monthly cash flow is $-121 ($-1k/yr) — negative.
- To cash-flow at today's rent, offer at most $199k (9.7% below list).
- Meets the 1% rule at list price ($2k rent vs $220k).
- Recommended offer: $199k (9.7% below list) — sets the bar for cash-flow.
- Cap rate 5.6% vs local median 4.4% in Elgin — meaningfully above typical; check what's discounted (condition, days-on-market, listing class) to confirm the premium yield is real.
Location & tenants
- Location reads 74/100 on livability (#167 in TX, #4,404 nationally) — a middle-class / working-renter tenant base. Strengths: cost of living A+, housing A+, health & safety A+; Watch: schools F, amenities F, commute F.
- Elgin ISD (rural): math 17% / reading 26% proficiency, ranked #741 of 826 in TX (top 90%) — low school quality limits family demand, transient renter base, plan for 1-2y turnover; 67% free/reduced lunch — lower-income household profile, screen leases tightly.
- Market conditions: Rents rising (+3.1%/yr); 807 active listings in the ZIP; 25 comparable units currently listed for rent nearby; rentals at typical pace (median 24d on market — plan ~3-4 weeks tenant-placement turnaround); solid renter incomes; 17,121 units permitted in Travis County in 2024 (11,963 in 5+ unit buildings).
Forward outlook
- In year one you build about $24k of equity ($2k loan paydown + $22k appreciation (10.0% local appreciation)).
- Travis County population projected at +60% by 2050 — long-run rental-demand tailwind backs the buy-and-hold thesis.
- By year 2, paydown + projected appreciation supports a ~$38k cash-out refi (75% LTV) — recoverable capital for the next deal without selling this one.
Negotiation context
- Only 2 days on market — expect competitive offers; lowballing is unlikely to land.
- 7 sale attempts since 18y ago with the ask held roughly flat each time — persistent listings suggest the price (not the market) is what's stuck; bring a comps-based counter.
Risks & watch-outs
- Watch-outs: property tax is 3.4% of price.
- Climate carrying-cost: severe wind risk, 80% chance of damaging wind over 30y; extreme-heat days projected 7→23/yr by 2055 (HVAC capex compounding) — expect insurance premiums to compound above CPI over the hold.
Questions for the listing agent
- What do current leases actually rent for vs. the listed asking? Can we see a recent rent roll and the last 12 months of T-12 income?
- Property tax is high relative to price — has the assessment been appealed recently, and will the sale trigger a re-assessment?
- Is there a deadline driving the sale (1031 exchange, divorce, estate, relocation)? That informs how much negotiation room exists.
- Schools are F-rated, which usually means shorter tenancies and higher turnover. Who's the typical renter profile here, and what's been the actual vacancy rate?
- What's the average days-on-market for RENTAL listings here right now (not sales)? A rising rental-DOM trend means longer vacancies and softer asking-rent achievability than the comps imply.
- What's the recent tenant-quality profile in this submarket — average credit score on applications, eviction rate, late-payment / NSF rate, and stable-employment percentage? A property-management company in the area should have these aggregated.
- How much new for-sale + rental construction is in the pipeline within 1–3 miles? Heavy new supply typically softens prices + rents 12–24 months out; constrained supply supports both.
Investment metrics
- 1% rule
- 1.00% ✓
- Cap rate
- 5.63%
- Cash-on-cash
- -2.36%
- DSCR
- 0.90
- GRM
- 8.3
CMA / ARV
- ARV (on-the-fly)
- $383,295
- Comps found
- 12
Show comp detail 12 sales within ~0.75 mi
| Address | Dist | Beds/Ba | Sqft | Sold | Price | $/sf | Match |
|---|---|---|---|---|---|---|---|
| 18400 Sun Haven Cv | 0.16mi | 4/3.0 (+1) | 2,343 (+1%) | 4mo | $273,900 | $117 | 83 |
| 13504 Muny Pkwy | 0.12mi | 3/3.0 | 2,160 (-7%) | 1mo | $299,990 | $139 | 82 |
| 13444 Barn Chime St | 0.06mi | 4/2.0 (+1) | 2,257 (-3%) | 3mo | $314,990 | $140 | 81 |
| 18436 Windtree Ln | 0.26mi | 4/3.0 (+1) | 2,420 (+4%) | 3mo | $282,000 | $117 | 74 |
| 13509 Barn Chime St | 0.03mi | 4/2.0 (+1) | 2,086 (-10%) | 3mo | $319,990 | $153 | 70 |
| 13405 Barn Chime St | 0.11mi | 4/2.0 (+1) | 1,977 (-15%) | 6mo | $339,990 | $172 | 56 |
| 13605 Hamilton Hart Dr | 0.56mi | 4/3.0 (+1) | 2,211 (-5%) | 6mo | $374,990 | $170 | 56 |
| 13717 Tucker Hedge Pass | 0.70mi | 3/2.5 | 2,210 (-5%) | 2mo | $363,950 | $165 | 56 |
| 25604 Becky Bourne Ln | 0.60mi | 4/3.0 (+1) | 2,168 (-7%) | 6mo | $399,990 | $184 | 51 |
| 25605 Flora Bella Ln | 0.62mi | 4/2.5 (+1) | 2,162 (-7%) | 2mo | $319,995 | $148 | 51 |
| 25625 Flora Bella Ln | 0.64mi | 3/2.5 | 2,091 (-10%) | 7mo | $345,585 | $165 | 46 |
| 13709 Tucker Hedge Pass | 0.70mi | 4/2.0 (+1) | 1,974 (-15%) | 3mo | $324,990 | $165 | 31 |
Match score weights: distance 35% · size 25% · config 20% · recency 20%. Top-matched comps best support the ARV.
Projected returns pro-forma
10.0% appreciation · 3.12% rent growth · sell at horizon
- IRR
- 22.7%
- Equity multiple
- 2.83×
- Total profit
- $112,616
- Equity at exit
- $198,193
- IRR
- 20.4%
- Equity multiple
- 6.50×
- Total profit
- $338,733
- Equity at exit
- $427,410
Cash invested: $61,600 (down + closing). Projections, not guarantees.
Landlord ↔ Tenant lean methodology
- Overall (STATE)
- 87 Strongly Landlord-Friendly
- State Texas
- 87 Strongly Landlord-Friendly · R+5
- County
- — inherits STATE
- City
- — inherits STATE
ZIP-level market 78621
- Home prices YoY
- 7.6%
- Rents YoY
- 3.1%
- Active inventory
- 807
- Price-to-rent
- 8.3×
Monthly cashflow live
- Estimated rent
- $2,208 high interval (Pro) →
- Mortgage (P&I)
- −$1,154
- Tax from tax record
- −$620 /mo · $7,440/yr
- Insurance
- −$92
- HOA
- −$0
- Vacancy / Maint / Mgmt
- −$464
- Net cashflow
- $-121
Break-even live
UW: 25.0% down · 7.5% · 30yr · 1.5% tax · 5.0% vac · 8.0% maint · 8.0% mgmt
Financing live
Cash to close
- Down payment
- $55,000
- Closing costs
- $6,600
- Reserves months
- —
- Total cash needed
- —
Loan-product check · same deal, 3 products live
Conventional
25% down · 7.5% · 30yr
- Down + closing
- —
- Monthly P&I
- —
- Monthly cashflow
- —
- DSCR
- —
- Eligible?
- —
Personal DTI + credit; lowest rate.
DSCR
20% down · 8.5% · 30yr
- Down + closing
- —
- Monthly P&I
- —
- Monthly cashflow
- —
- DSCR
- —
- Eligible?
- —
No personal income docs; deal must DSCR.
Hard money
10% down · 12.0% · 12mo
- Down + closing
- —
- Monthly P&I
- —
- Monthly cashflow
- —
- DSCR
- —
- Eligible?
- —
Short-term bridge; refi at stabilization.
Rent comps 25 comps
| Address | Beds | Baths | Sqft | Rent | $/sqft | DOM | Units | Dist |
|---|---|---|---|---|---|---|---|---|
| 13501 Sierra Wind Ln Elgin, TX | 4.0 | 2.5 | 2066 | $2,500 | $1.21 | 20d | 1 | 0.15mi |
| 18436 Weatherby Ln Elgin, TX | 4.0 | 2.5 | 2095 | $2,000 | $0.95 | 4d | 1 | 0.30mi |
| 14129 Tordillo Dr Elgin, TX | 4.0 | 2.5 | 1874 | $2,675 | $1.43 | 24d | 1 | 0.44mi |
| 14129 Tordillo Dr Unit NA Elgin, TX | 4.0 | 2.5 | 1874 | $2,595 | $1.38 | 4d | 1 | 0.44mi |
| 13725 Knights Branch Dr Elgin, TX | 4.0 | 2.5 | 1800 | $2,100 | $1.17 | 24d | 1 | 0.62mi |
| 13121 Blackeyed Susan Trl Elgin, TX | 4.0 | 2.0 | 1586 | $1,800 | $1.13 | 17d | 1 | 0.63mi |
| 13520 Knights Branch Dr Elgin, TX | 3.0 | 2.5 | 1600 | $1,850 | $1.16 | 2d | 1 | 0.71mi |
| 13501 Mussel Run Elgin, TX | 4.0 | 2.0 | 1667 | $1,800 | $1.08 | 16d | 1 | 0.80mi |
| 13305 Banquete St Elgin, TX | 4.0 | 2.0 | 1707 | $1,995 | $1.17 | 43d | 1 | 0.83mi |
| 102 Blanco Woods Blvd Elgin, TX | 3.0 | 2.5 | 2450 | $1,800 | $0.73 | 43d | 1 | 0.94mi |
| 17812 Prairie Verbena Ln Elgin, TX | 3.0 | 2.5 | 2049 | $2,199 | $1.07 | 43d | 1 | 0.96mi |
| 401 Bandara Woods Blvd Elgin, TX | 3.0 | 2.0 | 1665 | $1,875 | $1.13 | 43d | 1 | 1.04mi |
| 18505 Quiet Range Dr Unit 18505 Elgin, TX | 4.0 | 2.0 | 1794 | $1,785 | $0.99 | 4d | 1 | 1.23mi |
| 18505 Quiet Range Dr Elgin, TX | 4.0 | 2.0 | 1794 | $1,950 | $1.09 | 24d | 1 | 1.23mi |
| 18525 Quiet Range Dr Elgin, TX | 4.0 | 2.0 | 1794 | $1,725 | $0.96 | 17d | 1 | 1.26mi |
| 19017 Romano Dr Elgin, TX | 4.0 | 3.0 | 2473 | $2,198 | $0.89 | 4d | 1 | 1.27mi |
| 722 Lavaca Loop Elgin, TX | 4.0 | 2.5 | 2075 | $1,895 | $0.91 | 17d | 1 | 1.27mi |
| 18721 Quiet Range Dr Elgin, TX | 3.0–5.0 | 2.0–3.5 | 1773 | $2,085 | $1.18 | 1d | 1 | 1.30mi |
| 14101 Prospector Way Unit 14101 Elgin, TX | 4.0 | 2.5 | 2198 | $2,099 | $0.95 | 24d | 1 | 1.32mi |
| 14101 Prospector Way Elgin, TX | 4.0 | 2.5 | 2198 | $2,099 | $0.95 | 43d | 1 | 1.32mi |
| 18612 Allen Welch Dr Elgin, TX | 4.0 | 2.0 | 1794 | $1,885 | $1.05 | 4d | 1 | 1.38mi |
| 14300 Boomtown Way Elgin, TX | 4.0 | 2.0 | 1794 | $2,050 | $1.14 | 24d | 1 | 1.41mi |
| 11524 Rush Ln Elgin, TX | 4.0 | 3.0 | 2473 | $2,300 | $0.93 | 43d | 1 | 1.42mi |
| 18224 Speculator Ln Elgin, TX | 3.0 | 2.5 | 1599 | $1,700 | $1.06 | 43d | 1 | 1.42mi |
| 18300 Speculator Ln Elgin, TX | 4.0 | 2.0 | 1794 | $1,995 | $1.11 | 24d | 1 | 1.43mi |
Listing history 3 events
-
2026-06-18days on market $219,999 Active 2 DOM
-
2026-06-17remarks 360-char remark
-
2026-06-17$219,999 Active 1 DOM
ⓘ Source: listings_history table (triggers on properties + properties_extension) + one-shot
backfill from property_details.listing_events for pre-trigger history.
Tax reassessment forecast TX · Resets to sale price
- Current annual tax
- $7,440 · $620/mo
- Projected year-2 tax
- $7,440 · $620/mo
- Expected delta
- $0/yr ($0/mo · -0.0%)
ⓘ Screening estimate from a state-policy table — verify with the county assessor before closing.
Climate risk First Street
- Flood 1/10 Low FEMA zone X (unshaded) · 0% chance over 30 yrs
- Wildfire 4/10 Moderate
- Heat 8/10 Severe 7 d/yr ≥109°F today · 23 d/yr by 30 yrs out
- Wind 8/10 Severe 80% chance of damaging wind over 30 yrs
- Air quality 1/10 Low 0 unhealthy d/yr today · 0 by 30 yrs out
Nearby sold comps map
Loading sold comps map…
Walkable amenities ~0.75 mi
Loading nearby amenities…
Taxation est. · year 1
- Rental income
- $26,495
- − Mortgage interest
- −$12,323
- − Property taxes
- −$7,440
- − Insurance
- −$1,100
- − Repairs & maintenance
- −$2,120
- − Management
- −$2,120
- − Depreciation
- −$6,400
- Taxable loss
- −$5,008
- Est. tax savings @ 24.0%
- +$1,202
- After-tax cash flow
- $-252/yr
For passive investors: Depreciation is non-cash, so a rental often shows a tax loss while cash-flowing — sheltering income. Rental losses are passive: they offset passive income freely, and up to $25,000/yr can offset ordinary (W-2) income if you actively participate and your MAGI is under $100k (phasing out to $0 by $150k); unused losses carry forward. On sale, claimed depreciation is recaptured at up to 25%, and gains may owe capital-gains tax (a 1031 exchange can defer both). Figures are a year-1 estimate at your 24.0% rate — not tax advice; consult a CPA.
Schools (NCES district)
- District
- Elgin ISD
- NCES district ID
- 4818360
- Math proficiency
- 17% ▼ -9.00%
- Reading proficiency
- 26% ▼ -5.00%
- Median HH income
- $55,176
- Composite
- 19.62/100
- National rank
- #8749
- State rank
- #741 of 826 in TX
Livability — Elgin
- Score
- 74/100
- State rank
- #167
- US rank
- #4404
Category grades
Schools grade is shown separately in the Schools card above.
Census & demographics
- Census place
- Elgin, TX
- County
- Bastrop County · 68,601 people
- City population
- 27,860
- Metro
- Austin-Round Rock-Georgetown, TX
- Population (ZIP)
- 30,411
- Household income
- $98,534
- Rent vs Own
- Severe rent burden
- 235.0
Population outlook (Travis County) Hauer SSP2
- Today (2025)
- 1,545,133 people
- By 2030
- 1,729,269 · +11.9%
- By 2040
- 2,097,596 · +35.8%
- By 2050
- 2,463,890 · +59.5%
- By 2075
- 3,249,374 · +110.3%
- By 2100
- 3,801,868 · +146.1%
Race, ethnicity, and origin ACS 2023
- Neighborhood character
- Diverse neighborhood (Simpson 0.64)
- Race & ethnicity
- Hispanic / Latino 46% White 38% Two or more races 19% Black 11% Native American 1%
- Hispanic origin (detail)
- Mexican 38%
- Common ancestry
- Slovak 2% Italian 2% Romanian 1%
- Foreign-born
- 17% · Canada, Vietnam
- Languages at home
- 63% English-only · Spanish 36%
Political lean MEDSL · Travis
- 2024 margin
- Solid D (+39.3) · D 68.8% · R 29.4% · Other 1.8%
- 2008→2024 swing
- +9.9pp toward D · 2008: 29.4pp · 2024: 39.3pp
- All cycles
- 2024: D+39.3 2020: D+45.0 2016: D+38.9 2012: D+23.9 2008: D+29.4
Not yet ingested
- Civics
- —
Market trends
- HPI YoY
- ▲ 29.47%
- Current HPI
- 416.87
- Rent YoY
- ▲ 3.12%
- Metro
- Austin-Round Rock-Georgetown, TX
- State GDP YoY
- ▲ 3.95%
- F500 in state
- 110
Industry mix (Fortune 500 HQ in TX)
| Industry | F500 HQs | Revenue |
|---|---|---|
| Energy | 16 | $1,198B |
|
||
| Technology | 5 | $198B |
|
||
| Engineering / Construction | 4 | $72B |
|
||
| Energy Services | 3 | $60B |
|
||
| Utilities | 3 | $41B |
|
||
| Healthcare | 2 | $330B |
|
||
Price history
12 events — show timeline
- 2026-06-16 Listed $219,999 FSBO.com
- 2021-09-20 Contingent — Unlock MLS
- 2021-09-01 Price Changed — Unlock MLS
- 2021-07-27 Relisted — Unlock MLS
- 2021-07-21 Listed — Unlock MLS
- 2020-07-29 Relisted — Unlock MLS
- 2020-06-27 Pending — Unlock MLS
- 2020-06-22 Listed — Unlock MLS
- 2010-08-18 Delisted — Unlock MLS
- 2010-06-09 Listed — Unlock MLS
- 2010-05-05 Delisted — Unlock MLS
- 2008-11-12 Listed — Unlock MLS
Property tax history
+18.4%/yrLatest (2026): $7,440 · -3.2% YoY. Source: county tax records.
Cash-flow waterfall
monthlySold comps — $/sqft
last 12 mo · ≤1 miLoading sold comps…