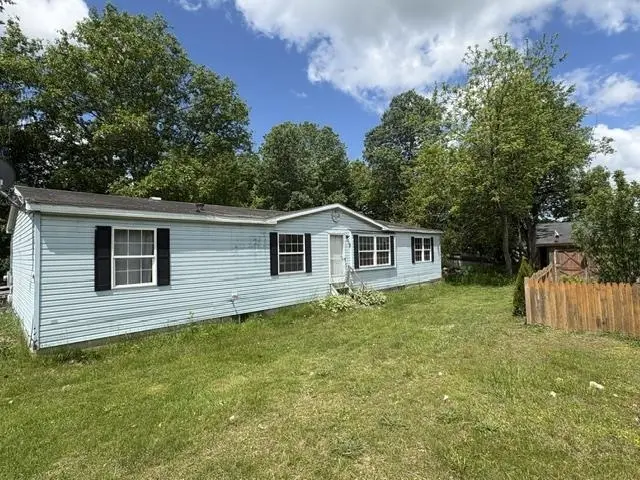
3 Benson Ln · Fair Haven, VT
Flood risk 1/10 · Minimal
- FEMA flood zone
- X (unshaded)
- Chance of flooding over 30 yrs
- 0.0%
- Est. flood insurance / yr
- $473 – $860
Fire risk 1/10 · Minimal
- Est. fire insurance / yr
- $480 – $892
Heat risk 2/10 · Minimal
- Hot days now (above 95°F)
- 7 days/yr
- Hot days in 30 yrs
- 16 days/yr
Wind risk 2/10 · Minimal
- Chance of severe wind over 30 yrs
- 3.0%
Air-quality risk 1/10 · Minimal
- Unhealthy air days now
- 0 days/yr
- Unhealthy air days in 30 yrs
- 0 days/yr
Risk factors via First Street. Map © Google.
Why this score? — see what drove the B- grade
The composite is a weighted blend of 9 inputs, each scored 0–100. Each bar is that input's sub-score; the figure is the points it added to the 100-point composite (weight × sub-score).
- Cash flow +17.2/30.0
- ARV discount +15.0/15.0
- Appreciation +10.0/10.0
- DSCR +5.4/10.0
- Schools +5.0/10.0
- 1% rule +4.1/10.0
- Livability +3.6/5.0
- Rent growth +2.5/5.0
- Condition / age +2.5/5.0
$150,000
🖨 Deal sheet 📄 Offer letter ✓ Due diligence
Listing remarks
Welcome to your next big adventure in Fair Haven, Vermont — a three-bedroom, two-bathroom manufactured double wide home that's practically begging for someone with vision, a toolbelt, and a dream. This property is ideal for buyers who appreciate a fantastic price point and aren't afraid to roll up their sleeves and transform a diamond in the rough into something truly spectacular. Let's talk about that basement. Whether you envision extra storage, a workshop for your weekend projects, or a future finished space for entertaining, the basement adds a layer of versatility that's hard to find at this value. It's the kind of bonus space that opens up exciting possibilities — and this
Key facts
- 0.37 acre lot
- Built 2000
- Listed 13 days
Property features AI
Finance
- Financial info: Foreclosed / Bank-Owned (REO)
Exterior
- Utilities: Public water available at the street; Public sewer on-site; 100 Amp electric service; High-speed internet available on-site; Cable available
- Home design: Manufactured/Mobile style; Existing construction
- Construction: Aluminum exterior; Shingle (asphalt) roof; Built in 2000
- Exterior features: Level lot; Gravel driveway
Interior
- Bathrooms: Two full bathrooms
- Heating & cooling: Propane heating
- Interior features: Six total rooms; Basement with interior access and concrete floor
Neighborhood map
What this means for you Summary
Snapshot
- This is a 3-bed/2.0-bath manufactured listed at $150k.
Deal economics
- At list price, monthly cash flow is $107 ($1k/yr) — positive.
- The deal already cash-flows at list — no discount required.
- To meet the 1% rule (rent ≥ 1% of price), the offer needs to be $136k (9.2% below list).
- Recommended offer: $136k (9.2% below list) — sets the bar for 1% rule.
Location & tenants
- Location reads 71/100 on livability (#31 in VT) — a middle-class / working-renter tenant base. Strengths: cost of living A+, housing A+, crime A; Watch: amenities F, commute F.
- Zoned schools: Fair Haven Grade School (math 19% / reading 37%, grade F, #149 of 192 statewide, top 78%, 264 students, 40% FRL).
- Market conditions: 34 active listings in the ZIP; 90 units permitted in Rutland County in 2024 (0 in 5+ unit buildings).
Forward outlook
- In year one you build about $16k of equity ($1k loan paydown + $15k appreciation (10.0% local appreciation)).
- Rutland County population projected at -28% by 2050 — secular population decline; favor cash flow + early exit over multi-decade hold.
- At projected returns (10.0% appreciation + 3.0% rent growth), your $42k cash investment doubles in ~3 years — after that, you're playing with house money.
- By year 3, paydown + projected appreciation supports a ~$41k cash-out refi (75% LTV) — recoverable capital for the next deal without selling this one.
Negotiation context
- Only 13 days on market — expect competitive offers; lowballing is unlikely to land.
Questions for the listing agent
- Is there a deadline driving the sale (1031 exchange, divorce, estate, relocation)? That informs how much negotiation room exists.
- What's the average days-on-market for RENTAL listings here right now (not sales)? A rising rental-DOM trend means longer vacancies and softer asking-rent achievability than the comps imply.
- What's the recent tenant-quality profile in this submarket — average credit score on applications, eviction rate, late-payment / NSF rate, and stable-employment percentage? A property-management company in the area should have these aggregated.
- How much new for-sale + rental construction is in the pipeline within 1–3 miles? Heavy new supply typically softens prices + rents 12–24 months out; constrained supply supports both.
Investment metrics
- 1% rule
- 0.91% ✗
- Cap rate
- 7.15%
- Cash-on-cash
- 3.07%
- DSCR
- 1.14
- GRM
- 9.2
CMA / ARV
- ARV (on-the-fly)
- $233,280
- Comps found
- 1
Show comp detail 1 sale within ~0.75 mi
| Address | Dist | Beds/Ba | Sqft | Sold | Price | $/sf | Match |
|---|---|---|---|---|---|---|---|
| 68 Montgiven Ave | 0.46mi | 3/2.0 | 1,500 (-7%) | 18mo | $216,000 | $144 | 51 |
Match score weights: distance 35% · size 25% · config 20% · recency 20%. Top-matched comps best support the ARV.
Projected returns pro-forma
10.0% appreciation · 3.0% rent growth · sell at horizon
- IRR
- 26.5%
- Equity multiple
- 3.11×
- Total profit
- $88,507
- Equity at exit
- $135,132
- IRR
- 23.2%
- Equity multiple
- 7.08×
- Total profit
- $255,222
- Equity at exit
- $291,417
Cash invested: $42,000 (down + closing). Projections, not guarantees.
Landlord ↔ Tenant lean methodology
- Overall (STATE)
- 41 Moderately Tenant-Leaning
- State Vermont
- 41 Moderately Tenant-Leaning · D+15
- County
- — inherits STATE
- City
- — inherits STATE
ZIP-level market 05743
- Home prices YoY
- 3.6%
- Active inventory
- 34
- Price-to-rent
- 9.2×
Monthly cashflow live
- Estimated rent
- $1,363 medium interval (Pro) →
- Mortgage (P&I)
- −$787
- Tax from tax record
- −$120 /mo · $1,440/yr
- Insurance
- −$62
- HOA
- −$0
- Vacancy / Maint / Mgmt
- −$286
- Net cashflow
- $107
Break-even live
UW: 25.0% down · 7.5% · 30yr · 1.5% tax · 5.0% vac · 8.0% maint · 8.0% mgmt
Financing live
Cash to close
- Down payment
- $37,500
- Closing costs
- $4,500
- Reserves months
- —
- Total cash needed
- —
Loan-product check · same deal, 3 products live
Conventional
25% down · 7.5% · 30yr
- Down + closing
- —
- Monthly P&I
- —
- Monthly cashflow
- —
- DSCR
- —
- Eligible?
- —
Personal DTI + credit; lowest rate.
DSCR
20% down · 8.5% · 30yr
- Down + closing
- —
- Monthly P&I
- —
- Monthly cashflow
- —
- DSCR
- —
- Eligible?
- —
No personal income docs; deal must DSCR.
Hard money
10% down · 12.0% · 12mo
- Down + closing
- —
- Monthly P&I
- —
- Monthly cashflow
- —
- DSCR
- —
- Eligible?
- —
Short-term bridge; refi at stabilization.
Listing history 12 events
-
2026-06-18days on market $150,000 Active 13 DOM
-
2026-06-17days on market $150,000 Active 12 DOM
-
2026-06-16days on market $150,000 Active 11 DOM
-
2026-06-15days on market $150,000 Active 10 DOM
-
2026-06-15days on market $150,000 Active 9 DOM
-
2026-06-13days on market $150,000 Active 8 DOM
-
2026-06-12days on market $150,000 Active 7 DOM
-
2026-06-09days on market $150,000 Active 4 DOM
-
2026-06-08days on market $150,000 Active 3 DOM
-
2026-06-08days on market $150,000 Active 2 DOM
-
2026-06-07remarks 687-char remark
-
2026-06-07$150,000 Active 1 DOM
ⓘ Source: listings_history table (triggers on properties + properties_extension) + one-shot
backfill from property_details.listing_events for pre-trigger history.
Tax reassessment forecast VT · Partial reset (capped growth)
- Current annual tax
- $1,440 · $120/mo
- Projected year-2 tax
- $2,145 · $179/mo
- Expected delta
- +$705/yr (+$59/mo · 48.9%)
ⓘ Screening estimate from a state-policy table — verify with the county assessor before closing.
Climate risk First Street
- Flood 1/10 Low FEMA zone X (unshaded) · 0% chance over 30 yrs
- Wildfire 1/10 Low
- Heat 2/10 Low 7 d/yr ≥95°F today · 16 d/yr by 30 yrs out
- Wind 2/10 Low 3% chance of damaging wind over 30 yrs
- Air quality 1/10 Low 0 unhealthy d/yr today · 0 by 30 yrs out
Nearby sold comps map
Loading sold comps map…
Walkable amenities ~0.75 mi
Loading nearby amenities…
Taxation est. · year 1
- Rental income
- $16,351
- − Mortgage interest
- −$8,402
- − Property taxes
- −$1,440
- − Insurance
- −$750
- − Repairs & maintenance
- −$1,308
- − Management
- −$1,308
- − Depreciation
- −$4,364
- Taxable loss
- −$1,222
- Est. tax savings @ 24.0%
- +$293
- After-tax cash flow
- $1,581/yr
For passive investors: Depreciation is non-cash, so a rental often shows a tax loss while cash-flowing — sheltering income. Rental losses are passive: they offset passive income freely, and up to $25,000/yr can offset ordinary (W-2) income if you actively participate and your MAGI is under $100k (phasing out to $0 by $150k); unused losses carry forward. On sale, claimed depreciation is recaptured at up to 25%, and gains may owe capital-gains tax (a 1031 exchange can defer both). Figures are a year-1 estimate at your 24.0% rate — not tax advice; consult a CPA.
Schools (NCES district)
No district data.
Livability — Fair Haven
- Score
- 71/100
- State rank
- #31
- US rank
- #7050
Category grades
Schools grade is shown separately in the Schools card above.
Census & demographics
- Census place
- Fair Haven, VT
- Population (ZIP)
- 4,144
Population outlook (Rutland County) Hauer SSP2
- Today (2025)
- 55,307 people
- By 2030
- 52,364 · -5.3%
- By 2040
- 45,751 · -17.3%
- By 2050
- 39,627 · -28.4%
- By 2075
- 29,080 · -47.4%
- By 2100
- 20,673 · -62.6%
Race, ethnicity, and origin ACS 2023
- Neighborhood character
- Predominantly White (95%)
- Race & ethnicity
- White 95% Two or more races 5%
- Common ancestry
- Lithuanian 15% Romanian 3% Slovak 3%
- Foreign-born
- 0%
- Languages at home
- 97% English-only · Spanish 2%
Political lean MEDSL · Rutland
- 2024 margin
- Lean D (+5.3) · D 51.3% · R 46.0% · Other 2.7%
- 2008→2024 swing
- -19.3pp toward R · 2008: 24.6pp · 2024: 5.3pp
- All cycles
- 2024: D+5.3 2020: D+10.5 2016: D+4.2 2012: D+22.0 2008: D+24.6
Not yet ingested
- Civics
- —
Market trends
- HPI YoY
- ▲ 10.19%
- Current HPI
- 289.3746
- Rent YoY
- —
- Metro
- —
- State GDP YoY
- —
- F500 in state
- 0
Price history
1 event — show timeline
- 2026-06-05 Listed $150,000 PrimeMLS
Property tax history
+16.8%/yrLatest (2024): $1,440 · +8.4% YoY. Source: county tax records.
Cash-flow waterfall
monthlySold comps — $/sqft
last 12 mo · ≤1 miLoading sold comps…