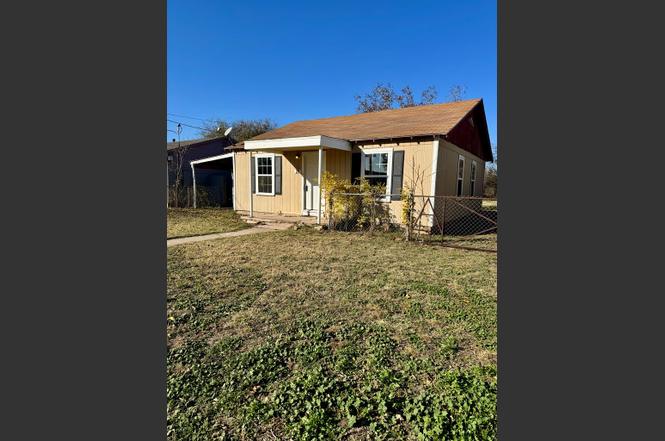
20 E 39th St · San Angelo, TX
Flood risk 4/10 · Minor
- FEMA flood zone
- X (unshaded)
- Chance of flooding over 30 yrs
- 0.24%
- Est. flood insurance / yr
- $507 – $1,088
Fire risk 4/10 · Minor
- Est. fire insurance / yr
- $1,222 – $2,270
Heat risk 7/10 · Major
- Hot days now (above 104°F)
- 7 days/yr
- Hot days in 30 yrs
- 22 days/yr
Wind risk 4/10 · Minor
- Chance of severe wind over 30 yrs
- 16.0%
Air-quality risk 1/10 · Minimal
- Unhealthy air days now
- 0 days/yr
- Unhealthy air days in 30 yrs
- 0 days/yr
Risk factors via First Street. Map © Google.
Why this score? — see what drove the B+ grade
The composite is a weighted blend of 9 inputs, each scored 0–100. Each bar is that input's sub-score; the figure is the points it added to the 100-point composite (weight × sub-score).
- Cash flow +29.3/30.0
- ARV discount +15.0/15.0
- DSCR +10.0/10.0
- 1% rule +9.3/10.0
- Rent growth +4.6/5.0
- Livability +3.7/5.0
- Schools +2.6/10.0
- Condition / age +2.5/5.0
- Appreciation +0.0/10.0
$79,500
🖨 Deal sheet 📄 Offer letter ✓ Due diligence
Listing remarks
This 2 bedroom/1 bath home is move-in ready! This home has been updated on the hardwood floors, updated kitchen area, and updates throughout the bathroom. This home is a must-see for investors that are wanting to either add houses to their portfolio, or to even start one. This home is also vacant and ready for owner occupants looking to venture into the world of home-ownership!
Key facts
- Updated kitchen area
- Hardwood floors
- 7,884 sq ft lot
Tags
Neighborhood map
What this means for you Summary
Snapshot
- This is a 2-bed/1.0-bath single-family listed at $80k.
Deal economics
- At list price, monthly cash flow is $278 ($3k/yr) — positive.
- The deal already cash-flows at list — no discount required.
- Meets the 1% rule at list price ($1k rent vs $80k).
- Recommended offer: $77k (3.0% below list) — sets the bar for market timing.
- Cap rate 10.5% vs local median 3.8% in San Angelo — top-decile yield for the area; either an underpriced asset or a hidden risk that comps aren't pricing in. Stress-test before assuming the spread holds.
Location & tenants
- Location reads 73/100 on livability (#199 in TX) — a middle-class / working-renter tenant base. Strengths: cost of living A+, housing A+, health & safety A+; Watch: employment C-, amenities F, commute F.
- San Angelo ISD (urban): math 27% / reading 33% proficiency, ranked #627 of 826 in TX (top 76%) — families likely to look elsewhere, expect single-tenant / working-renter base with shorter leases.
- Zoned schools: Goliad El (math 27% / reading 24%, grade F, #2,982 of 4,322 statewide, top 70%, 412 students, 81% FRL); Lincoln Middle (math 19% / reading 23%, grade F, #1,387 of 1,662 statewide, top 85%, 844 students, 78% FRL); Lake View H S (math 6% / reading 22%, grade F, #1,527 of 1,632 statewide, top 94%, 1,085 students, 64% FRL) — zoned schools average 75% FRL vs 53% district-wide (22 pts higher); higher-poverty schools than district average — tighter screening recommended.
- Market conditions: Rents rising fast (+8.5%/yr); 227 active listings in the ZIP; 8 comparable units currently listed for rent nearby; rentals at typical pace (median 21d on market — plan ~3-4 weeks tenant-placement turnaround); 233 units permitted in Tom Green County in 2024 (0 in 5+ unit buildings).
Forward outlook
- Local home prices are declining (-3.0%/yr); year-one equity from $550 of loan paydown is wiped out by about $2k of value loss. Plan a longer hold.
- Tom Green County population projected at +35% by 2050 — long-run rental-demand tailwind backs the buy-and-hold thesis.
- At projected returns (-3.0% appreciation + 8.0% rent growth), your $22k cash investment doubles in ~6 years — after that, you're playing with house money.
Negotiation context
- It's been on market 43 days — a 3% lower offer ($77k) is reasonable based on typical stale-listing flexibility.
- 6 sale attempts since 4y ago with the ask held roughly flat each time — persistent listings suggest the price (not the market) is what's stuck; bring a comps-based counter.
Risks & watch-outs
- Watch-outs: property tax is 2.6% of price; built in 1950 — expect roof / HVAC / electrical / plumbing capex.
- Climate carrying-cost: extreme-heat days projected 7→22/yr by 2055 (HVAC capex compounding) — expect insurance premiums to compound above CPI over the hold.
Questions for the listing agent
- It's been on market 43 days. Have you received any prior offers? Is the seller open to a 3% concession, seller financing, or rate buy-down credit?
- Built in 1950 — when were the roof, HVAC, electrical panel, plumbing, and water heater last replaced?
- Property tax is high relative to price — has the assessment been appealed recently, and will the sale trigger a re-assessment?
- Is there a deadline driving the sale (1031 exchange, divorce, estate, relocation)? That informs how much negotiation room exists.
- Schools are F-rated, which usually means shorter tenancies and higher turnover. Who's the typical renter profile here, and what's been the actual vacancy rate?
- What's the average days-on-market for RENTAL listings here right now (not sales)? A rising rental-DOM trend means longer vacancies and softer asking-rent achievability than the comps imply.
- What's the recent tenant-quality profile in this submarket — average credit score on applications, eviction rate, late-payment / NSF rate, and stable-employment percentage? A property-management company in the area should have these aggregated.
- How much new for-sale + rental construction is in the pipeline within 1–3 miles? Heavy new supply typically softens prices + rents 12–24 months out; constrained supply supports both.
Investment metrics
- 1% rule
- 1.43% ✓
- Cap rate
- 10.49%
- Cash-on-cash
- 15.00%
- DSCR
- 1.67
- GRM
- 5.8
CMA / ARV
- ARV (on-the-fly)
- $109,760
- Comps found
- 6
Show comp detail 6 sales within ~0.75 mi
| Address | Dist | Beds/Ba | Sqft | Sold | Price | $/sf | Match |
|---|---|---|---|---|---|---|---|
| 17 E 39th St | 0.03mi | 3/2.0 (+1) | 756 (-4%) | 1mo | $106,000 | $140 | 83 |
| 167 E 42nd St | 0.33mi | 2/1.0 | 768 (-2%) | 2mo | $110,000 | $143 | 80 |
| 3521 Hagelstein St | 0.26mi | 2/1.0 | 784 (0%) | 23mo | $165,000 | $210 | 69 |
| 56 E 32nd St | 0.49mi | 2/1.0 | 840 (+7%) | 4mo | $90,000 | $107 | 62 |
| 319 E 42nd St | 0.51mi | 1/1.0 (-1) | 748 (-5%) | 10mo | $54,999 | $74 | 55 |
| 221 E 41st St | 0.36mi | 1/1.0 (-1) | 858 (+9%) | 21mo | $65,000 | $76 | 45 |
Match score weights: distance 35% · size 25% · config 20% · recency 20%. Top-matched comps best support the ARV.
Projected returns pro-forma
-3.0% appreciation · 8.0% rent growth · sell at horizon
- IRR
- 11.6%
- Equity multiple
- 1.49×
- Total profit
- $10,924
- Equity at exit
- $11,854
- IRR
- 24.6%
- Equity multiple
- 3.70×
- Total profit
- $59,991
- Equity at exit
- $6,874
Cash invested: $22,260 (down + closing). Projections, not guarantees.
Landlord ↔ Tenant lean methodology
- Overall (STATE)
- 87 Strongly Landlord-Friendly
- State Texas
- 87 Strongly Landlord-Friendly · R+5
- County
- — inherits STATE
- City
- — inherits STATE
ZIP-level market 76903
- Rents YoY
- 8.5%
- Active inventory
- 227
- Price-to-rent
- 5.8×
Monthly cashflow live
- Estimated rent
- $1,139 high interval (Pro) →
- Mortgage (P&I)
- −$417
- Tax from tax record
- −$172 /mo · $2,062/yr
- Insurance
- −$33
- HOA
- −$0
- Vacancy / Maint / Mgmt
- −$239
- Net cashflow
- $278
Break-even live
UW: 25.0% down · 7.5% · 30yr · 1.5% tax · 5.0% vac · 8.0% maint · 8.0% mgmt
Financing live
Cash to close
- Down payment
- $19,875
- Closing costs
- $2,385
- Reserves months
- —
- Total cash needed
- —
Loan-product check · same deal, 3 products live
Conventional
25% down · 7.5% · 30yr
- Down + closing
- —
- Monthly P&I
- —
- Monthly cashflow
- —
- DSCR
- —
- Eligible?
- —
Personal DTI + credit; lowest rate.
DSCR
20% down · 8.5% · 30yr
- Down + closing
- —
- Monthly P&I
- —
- Monthly cashflow
- —
- DSCR
- —
- Eligible?
- —
No personal income docs; deal must DSCR.
Hard money
10% down · 12.0% · 12mo
- Down + closing
- —
- Monthly P&I
- —
- Monthly cashflow
- —
- DSCR
- —
- Eligible?
- —
Short-term bridge; refi at stabilization.
Rent comps 8 comps
| Address | Beds | Baths | Sqft | Rent | $/sqft | DOM | Units | Dist |
|---|---|---|---|---|---|---|---|---|
| 3302 N Bryant Blvd San Angelo, TX | 3.0 | 1.0 | 559 | $850 | $1.52 | 21d | 1 | 0.83mi |
| 3310 N Bryant Blvd San Angelo, TX | 2.0 | 1.0 | 610 | $750 | $1.23 | 21d | 1 | 0.83mi |
| 2921 JFK Dr San Angelo, TX | 3.0 | 1.5 | 924 | $1,102 | $1.19 | 21d | 1 | 1.12mi |
| 2917 JFK Dr San Angelo, TX | 3.0 | 1.5 | 924 | $1,102 | $1.19 | 21d | 1 | 1.13mi |
| 510 E 28th St San Angelo, TX | 3.0 | 1.5 | 924 | $1,102 | $1.19 | 21d | 1 | 1.16mi |
| 940 LBJ Dr San Angelo, TX | 3.0 | 1.5 | 924 | $1,102 | $1.19 | 21d | 1 | 1.18mi |
| 939 LBJ Dr San Angelo, TX | 3.0 | 1.5 | 924 | $1,102 | $1.19 | 21d | 1 | 1.19mi |
| 2417 Oaklawn Blvd San Angelo, TX | 2.0 | 2.0 | 897 | $1,550 | $1.73 | 43d | 1 | 1.20mi |
Listing history 22 events
-
2026-01-30status Pending
-
2025-12-18$79,500 Active
-
2025-12-11price $79,500
-
2025-10-30price $79,900
-
2025-09-16price $84,000
-
2025-08-27price $84,500
-
2025-06-17price $89,500
-
2025-06-06price $96,950
-
2025-05-08$99,500 Active
-
2025-01-23soldstatus
-
2024-11-15status Pending
-
2024-04-19$99,500 Active
-
2024-02-27status Active
-
2024-02-27price $99,500
-
2023-12-28price $99,900
-
2023-08-15$104,500 Active
-
2022-10-31soldstatus
-
2022-10-26soldstatus Closed
-
2022-10-06status Pending
-
2022-09-22$80,000 Active
-
2022-01-11soldstatus
-
2021-11-19soldstatus
ⓘ Source: listings_history table (triggers on properties + properties_extension) + one-shot
backfill from property_details.listing_events for pre-trigger history.
Tax reassessment forecast TX · Resets to sale price
- Current annual tax
- $2,062 · $172/mo
- Projected year-2 tax
- $2,062 · $172/mo
- Expected delta
- $0/yr ($0/mo · 0.0%)
ⓘ Screening estimate from a state-policy table — verify with the county assessor before closing.
Climate risk First Street
- Flood 4/10 Moderate FEMA zone X (unshaded) · 24% chance over 30 yrs
- Wildfire 4/10 Moderate
- Heat 7/10 Severe 7 d/yr ≥104°F today · 22 d/yr by 30 yrs out
- Wind 4/10 Moderate 16% chance of damaging wind over 30 yrs
- Air quality 1/10 Low 0 unhealthy d/yr today · 0 by 30 yrs out
Nearby sold comps map
Loading sold comps map…
Walkable amenities ~0.75 mi
Loading nearby amenities…
Taxation est. · year 1
- Rental income
- $13,673
- − Mortgage interest
- −$4,453
- − Property taxes
- −$2,062
- − Insurance
- −$398
- − Repairs & maintenance
- −$1,094
- − Management
- −$1,094
- − Depreciation
- −$2,313
- Taxable income
- $2,260
- Est. tax owed @ 24.0%
- −$542
- After-tax cash flow
- $2,797/yr
For passive investors: Depreciation is non-cash, so a rental often shows a tax loss while cash-flowing — sheltering income. Rental losses are passive: they offset passive income freely, and up to $25,000/yr can offset ordinary (W-2) income if you actively participate and your MAGI is under $100k (phasing out to $0 by $150k); unused losses carry forward. On sale, claimed depreciation is recaptured at up to 25%, and gains may owe capital-gains tax (a 1031 exchange can defer both). Figures are a year-1 estimate at your 24.0% rate — not tax advice; consult a CPA.
Schools (NCES district)
- District
- San Angelo ISD
- NCES district ID
- 4838700
- Math proficiency
- 27% ▼ -9.00%
- Reading proficiency
- 33% ▼ -3.00%
- Median HH income
- $43,501
- Composite
- 25.56/100
- National rank
- #7427
- State rank
- #627 of 826 in TX
Livability — San Angelo
- Score
- 73/100
- State rank
- #199
- US rank
- #5030
Category grades
Schools grade is shown separately in the Schools card above.
Census & demographics
- Census place
- San Angelo, TX
- County
- Tom Green County · 113,188 people
- City population
- 81,357
- Metro
- San Angelo, TX
- Population (ZIP)
- 29,947
- Household income
- $49,498
- Rent vs Own
- Severe rent burden
- 1255.0
Population outlook (Tom Green County) Hauer SSP2
- Today (2025)
- 135,110 people
- By 2030
- 144,090 · +6.6%
- By 2040
- 162,561 · +20.3%
- By 2050
- 182,158 · +34.8%
- By 2075
- 232,274 · +71.9%
- By 2100
- 268,218 · +98.5%
Race, ethnicity, and origin ACS 2023
- Neighborhood character
- Diverse neighborhood (Simpson 0.56)
- Race & ethnicity
- Hispanic / Latino 56% White 36% Two or more races 26% Black 5%
- Hispanic origin (detail)
- Mexican 49% Puerto Rican 1%
- Common ancestry
- Italian 1% Serbian 1% Slovak 1%
- Foreign-born
- 10% · Canada
- Languages at home
- 66% English-only · Spanish 33%
Political lean MEDSL · Tom Green
- 2024 margin
- Solid R (+48.0) · D 25.5% · R 73.5% · Other 1.0%
- 2008→2024 swing
- -6.3pp toward R · 2008: -41.7pp · 2024: -48.0pp
- All cycles
- 2024: R+48.0 2020: R+44.4 2016: R+47.9 2012: R+47.9 2008: R+41.7
Not yet ingested
- Civics
- —
Market trends
- HPI YoY
- ▼ -164.90%
- Current HPI
- 217.0406
- Rent YoY
- ▲ 8.46%
- Metro
- San Angelo, TX
- State GDP YoY
- ▲ 3.95%
- F500 in state
- 110
Industry mix (Fortune 500 HQ in TX)
| Industry | F500 HQs | Revenue |
|---|---|---|
| Energy | 16 | $1,198B |
|
||
| Technology | 5 | $198B |
|
||
| Engineering / Construction | 4 | $72B |
|
||
| Energy Services | 3 | $60B |
|
||
| Utilities | 3 | $41B |
|
||
| Healthcare | 2 | $330B |
|
||
Price history
-0.6% since first listed22 events — show timeline
- 2026-01-30 Pending — SAAR TX
- 2025-12-18 Listed $79,500 SAAR TX
- 2025-12-11 Price Changed $79,500 SAAR TX
- 2025-10-30 Price Changed $79,900 SAAR TX
- 2025-09-16 Price Changed $84,000 SAAR TX
- 2025-08-27 Price Changed $84,500 SAAR TX
- 2025-06-17 Price Changed $89,500 SAAR TX
- 2025-06-06 Price Changed $96,950 SAAR TX
- 2025-05-08 Listed $99,500 SAAR TX
- 2025-01-23 Sold (Public Records) — Public Records
- 2024-11-15 Pending — SAAR TX
- 2024-04-19 Listed $99,500 SAAR TX
- 2024-02-27 Relisted — SAAR TX
- 2024-02-27 Price Changed $99,500 SAAR TX
- 2023-12-28 Price Changed $99,900 SAAR TX
- 2023-08-15 Listed $104,500 SAAR TX
- 2022-10-31 Sold (Public Records) — Public Records
- 2022-10-26 Sold (MLS) — SAAR TX
- 2022-10-06 Pending — SAAR TX
- 2022-09-22 Listed $80,000 SAAR TX
- 2022-01-11 Sold (Public Records) — Public Records
- 2021-11-19 Sold (Public Records) — Public Records
Property tax history
+9.3%/yrLatest (2025): $2,062 · +24.2% YoY. Source: county tax records.
Cash-flow waterfall
monthlySold comps — $/sqft
last 12 mo · ≤1 miLoading sold comps…