 🌊 Lakefront
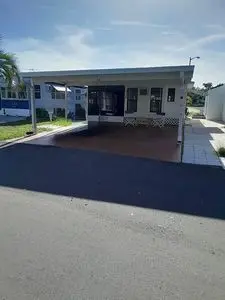
8225 Arevee Dr · New Port Richey East, FL
Flood risk 1/10 · Minimal
- FEMA flood zone
- X (unshaded)
- Chance of flooding over 30 yrs
- 0.0%
- Est. flood insurance / yr
- $507 – $1,088
Fire risk 4/10 · Minor
- Est. fire insurance / yr
- $947 – $1,759
Heat risk 10/10 · Severe
- Hot days now (above 108°F)
- 7 days/yr
- Hot days in 30 yrs
- 26 days/yr
Wind risk 10/10 · Severe
- Chance of severe wind over 30 yrs
- 99.0%
Air-quality risk 2/10 · Minimal
- Unhealthy air days now
- 1 days/yr
- Unhealthy air days in 30 yrs
- 3 days/yr
Risk factors via First Street. Map © Google.
Why this score? — see what drove the D grade
The composite is a weighted blend of 9 inputs, each scored 0–100. Each bar is that input's sub-score; the figure is the points it added to the 100-point composite (weight × sub-score).
- Cash flow +15.0/30.0
- ARV discount +7.5/15.0
- 1% rule +5.0/10.0
- DSCR +5.0/10.0
- Schools +4.3/10.0
- Livability +3.4/5.0
- Condition / age +2.5/5.0
- Rent growth +1.8/5.0
- Appreciation +0.0/10.0
$32,900
🖨 Deal sheet (PDF) 📄 Offer letter ✓ Due diligence
Listing remarks
Located in the beautiful community of Orchid Lake RV Resort. Call or text for more pictures!!! LOW LOT RENT!! This spacious 1 bed, 1 bath mobile home is just immaculate. This beautiful and clean home has a double carport, all appliances, plus washer and dryer, pantry, storage room, air conditioning (installed in the wall so you don't lose a window) and private back patio. The kitchen, living, dining has an open concept and feels spacious!! The floor is leveled and beautifully finished with the addition so it does not feel like an add-on. This home is located in a beautiful well maintained park with low lot rent. Lots of amenities: pool, fitness center, pickleball courts, putt putt, lake for
Key facts
- Fitness center
- Open concept
- Well maintained park
Tags
Property features AI
Exterior
- Home design: House
- Construction: 720 living area (units not specified)
- Exterior features: Lot size approximately 99 (units not specified)
Neighborhood map
What this means for you Summary
Snapshot
- This is a 1-bed/1.0-bath single-family listed at $33k.
Deal economics
- At list price, monthly cash flow is $1k ($13k/yr) — positive.
- The deal already cash-flows at list — no discount required.
- Meets the 1% rule at list price ($2k rent vs $33k).
- Recommended offer: $29k (12.0% below list) — sets the bar for market timing.
- Cap rate 45.7% vs local median 4.3% in New Port Richey East — top-decile yield for the area; either an underpriced asset or a hidden risk that comps aren't pricing in. Stress-test before assuming the spread holds.
Location & tenants
- Location reads 68/100 on livability (#499 in FL) — a middle-class / working-renter tenant base. Strengths: cost of living A+, housing A+, health & safety A+; Watch: amenities F, commute F, employment F.
- Pasco (suburban): math 50% / reading 52% proficiency, ranked #32 of 73 in FL (top 44%) — acceptable for families but not a draw, mixed tenant base, ~2y average lease.
- Zoned schools: Calusa Elementary School (math 26% / reading 27%, grade F, #2,009 of 2,144 statewide, top 94%, 473 students, 85% FRL); Chasco Middle School (math 32% / reading 31%, grade F, #453 of 571 statewide, top 81%, 688 students, 84% FRL) — zoned schools average 85% FRL vs 48% district-wide (36 pts higher); higher-poverty schools than district average — tighter screening recommended.
- Zoned-school proficiency averages 29% at this address vs 51% district-wide (-22 pts) — the specific schools serving this property underperform the Pasco average; the district grade overstates school quality for this exact location.
- Market conditions: Rents soft (-2.9%/yr); 308 active listings in the ZIP; 11 comparable units currently listed for rent nearby; rentals at typical pace (median 22d on market — plan ~3-4 weeks tenant-placement turnaround); 6,765 units permitted in Pasco County in 2024 (1,250 in 5+ unit buildings).
- This rent runs 40% of the median local income ($50k/yr) — at the standard rent-burdened threshold; future hikes will face affordability resistance.
Forward outlook
- Local home prices are declining (-3.0%/yr); year-one equity from $227 of loan paydown is wiped out by about $987 of value loss. Plan a longer hold.
- Pasco County population projected at +29% by 2050 — long-run rental-demand tailwind backs the buy-and-hold thesis.
- At projected returns (-3.0% appreciation + 0.0% rent growth), your $9k cash investment doubles in ~1 year — after that, you're playing with house money.
Negotiation context
- It's been on market 217 days — a 12% lower offer ($29k) is reasonable based on typical stale-listing flexibility.
- 2 sale attempts since 11y ago with the ask held roughly flat each time — persistent listings suggest the price (not the market) is what's stuck; bring a comps-based counter.
Risks & watch-outs
- Climate carrying-cost: severe wind risk, 99% chance of damaging wind over 30y; extreme-heat days projected 7→26/yr by 2055 (HVAC capex compounding) — expect insurance premiums to compound above CPI over the hold.
Questions for the listing agent
- It's been on market 217 days. Have you received any prior offers? Is the seller open to a 12% concession, seller financing, or rate buy-down credit?
- Why hasn't it sold? Are there any deal-killer items the seller is aware of (foundation, flood, title, zoning, code violations)?
- Is there a deadline driving the sale (1031 exchange, divorce, estate, relocation)? That informs how much negotiation room exists.
- Schools are A-rated — typically a magnet for longer-tenancy family renters. What's the average tenant stay here, and is there a school-zone premium baked into asking?
- The area grade is low — what's the realistic commute time and amenity access for the typical tenant pool here? Any planned neighborhood developments (good or bad) we should know about?
- This sits on a lake — are riparian / water-frontage rights deeded with the parcel? Any dock permits, shoreline easements, or HOA water-use restrictions?
- What's the documented flood / surge / shoreline-erosion history here (FEMA AND non-FEMA — e.g., storm surge, creek backup, septic-field saturation)?
- Any water-quality or seasonal algae-bloom issues that affect tenant satisfaction or short-term-rental demand?
- What's the average days-on-market for RENTAL listings here right now (not sales)? A rising rental-DOM trend means longer vacancies and softer asking-rent achievability than the comps imply.
- What's the recent tenant-quality profile in this submarket — average credit score on applications, eviction rate, late-payment / NSF rate, and stable-employment percentage? A property-management company in the area should have these aggregated.
- How much new for-sale + rental construction is in the pipeline within 1–3 miles? Heavy new supply typically softens prices + rents 12–24 months out; constrained supply supports both.
Investment metrics
- 1% rule
- 5.03% ✓
- Cap rate
- 45.66%
- Cash-on-cash
- 140.60%
- DSCR
- 7.26
- GRM
- 1.7
CMA / ARV
- ARV (on-the-fly)
- $279,450
- Comps found
- 12
Show comp detail 12 sales within ~0.75 mi
| Address | Dist | Beds/Ba | Sqft | Sold | Price | $/sf | Match |
|---|---|---|---|---|---|---|---|
| 7823 Radcliffe Cir | 0.57mi | 2/2.0 (+1) | 1,446 (-4%) | 0mo | $150,000 | $104 | 58 |
| 7631 Summertree Ln | 0.67mi | 2/2.0 (+1) | 1,510 (+1%) | 4mo | $264,000 | $175 | 55 |
| 7916 Radcliffe Cir | 0.60mi | 2/2.0 (+1) | 1,446 (-4%) | 4mo | $170,000 | $118 | 54 |
| 7837 Edinburgh Dr | 0.34mi | 2/2.0 (+1) | 1,314 (-12%) | 9mo | $290,000 | $221 | 47 |
| 7601 Cayuga Dr | 0.68mi | 2/2.0 (+1) | 1,510 (+1%) | 18mo | $290,000 | $192 | 43 |
| 7717 Radcliffe Cir | 0.47mi | 2/2.0 (+1) | 1,326 (-12%) | 13mo | $145,000 | $109 | 39 |
| 7933 Radcliffe Cir | 0.61mi | 2/2.0 (+1) | 1,326 (-12%) | 7mo | $137,000 | $103 | 38 |
| 7822 Radcliffe Cir | 0.55mi | 2/2.0 (+1) | 1,338 (-11%) | 14mo | $184,000 | $138 | 36 |
| 7947 Radcliffe Cir | 0.60mi | 2/2.0 (+1) | 1,326 (-12%) | 10mo | $163,000 | $123 | 35 |
| 7819 Cayuga Dr | 0.49mi | 2/2.0 (+1) | 1,325 (-12%) | 21mo | $270,000 | $204 | 31 |
| 7931 Radcliffe Cir | 0.61mi | 2/2.0 (+1) | 1,326 (-12%) | 18mo | $173,000 | $130 | 28 |
| 7352 Sequoia Dr | 0.71mi | 2/2.0 (+1) | 1,304 (-13%) | 12mo | $199,900 | $153 | 26 |
Match score weights: distance 35% · size 25% · config 20% · recency 20%. Top-matched comps best support the ARV.
Projected returns pro-forma
-3.0% appreciation · 0.0% rent growth · sell at horizon
- IRR
- —
- Equity multiple
- 7.36×
- Total profit
- $58,591
- Equity at exit
- $4,905
- IRR
- —
- Equity multiple
- 14.12×
- Total profit
- $120,907
- Equity at exit
- $2,845
Cash invested: $9,212 (down + closing). Projections, not guarantees.
Landlord ↔ Tenant lean methodology
- Overall (STATE)
- 87 Strongly Landlord-Friendly
- State Florida
- 87 Strongly Landlord-Friendly · R+3
- County
- — inherits STATE
- City
- — inherits STATE
ZIP-level market 34653
- Home prices YoY
- -18.4%
- Rents YoY
- -2.9%
- Active inventory
- 308
- Price-to-rent
- 1.7×
Monthly cashflow live
- Estimated rent
- $1,654 high interval (Pro) →
- Mortgage (P&I)
- −$173
- Tax est. 1.5%
- −$41 /mo · $494/yr
- Insurance
- −$14
- HOA
- −$0
- Lot rent
- −$0
- Vacancy / Maint / Mgmt
- −$347
- Net cashflow
- $1,079
Break-even live
Sensitivity live
| Price | -10% $1,102 | -5% $1,091 | +0% $1,079 | +5% $1,068 | +10% $1,057 |
|---|---|---|---|---|---|
| Rent | -10% $949 | -5% $1,014 | +0% $1,079 | +5% $1,145 | +10% $1,210 |
| Rate | -1.0pp $1,096 | -0.5pp $1,088 | base $1,079 | +0.5pp $1,071 | +1.0pp $1,062 |
UW: 25.0% down · 7.5% · 30yr · 1.5% tax · 5.0% vac · 8.0% maint · 8.0% mgmt
Financing live
Cash to close
- Down payment
- $8,225
- Closing costs
- $987
- Reserves months
- —
- Total cash needed
- —
Loan-product check · same deal, 3 products live
Conventional
25% down · 7.5% · 30yr
- Down + closing
- —
- Monthly P&I
- —
- Monthly cashflow
- —
- DSCR
- —
- Eligible?
- —
Personal DTI + credit; lowest rate.
DSCR
20% down · 8.5% · 30yr
- Down + closing
- —
- Monthly P&I
- —
- Monthly cashflow
- —
- DSCR
- —
- Eligible?
- —
No personal income docs; deal must DSCR.
Hard money
10% down · 12.0% · 12mo
- Down + closing
- —
- Monthly P&I
- —
- Monthly cashflow
- —
- DSCR
- —
- Eligible?
- —
Short-term bridge; refi at stabilization.
Rent comps 11 comps
| Address | Beds | Baths | Sqft | Rent | $/sqft | DOM | Units | Dist |
|---|---|---|---|---|---|---|---|---|
| 8228 Chasco Woods Blvd Port Richey, FL | 1.0–3.0 | 1.0–2.0 | 966 | $995 | $1.03 | 1d | 22 | 0.50mi |
| 7810 Cayuga Dr New Port Richey, FL | 2.0 | 2.0 | 1838 | $1,973 | $1.07 | 7d | 1 | 0.53mi |
| 8910 Elm Leaf Ct Port Richey, FL | 2.0 | 2.0 | 1248 | $1,650 | $1.32 | 7d | 1 | 0.88mi |
| 9100 Hunt Club Ln Port Richey, FL | 2.0 | 2.0 | 1365 | $1,850 | $1.36 | 24d | 1 | 1.04mi |
| 7212 Carlton Arms Dr New Port Richey, FL | 2.0 | 1.0–2.0 | 877 | $1,222 | $1.39 | 26d | 1 | 1.04mi |
| 7435 San Miguel Dr Port Richey, FL | 2.0 | 2.0 | 1136 | $1,500 | $1.32 | 22d | 1 | 1.09mi |
| 7125 Sandalwood Dr Port Richey, FL | 2.0 | 2.0 | 1324 | $1,681 | $1.27 | 7d | 1 | 1.13mi |
| 9130 Chatam Ln Port Richey, FL | 2.0 | 2.0 | 1212 | $1,623 | $1.34 | 24d | 1 | 1.20mi |
| 7318 Vienna Ln Port Richey, FL | 2.0 | 2.0 | 1530 | $1,841 | $1.20 | 22d | 1 | 1.31mi |
| 6692 Homebound Way New Port Richey, FL | 2.0 | 2.0 | 1630 | $2,600 | $1.60 | 26d | 1 | 1.43mi |
| 6692 Homebound Way New Port Richey, FL | 2.0 | 2.0 | 1613 | $2,595 | $1.61 | 1d | 1 | 1.43mi |
Listing history 15 events
-
2026-06-15days on market $32,900 Active 217 DOM
-
2026-06-13days on market $32,900 Active 215 DOM
-
2026-06-09days on market $32,900 Active 211 DOM
-
2026-06-08days on market $32,900 Active 210 DOM
-
2026-06-07days on market $32,900 Active 209 DOM
-
2026-06-04days on market $32,900 Active 206 DOM
-
2026-06-03days on market $32,900 Active 205 DOM
-
2026-06-02days on market $32,900 Active 204 DOM
-
2026-06-01days on market $32,900 Active 203 DOM
-
2026-05-31days on market $32,900 Active 202 DOM
-
2025-11-10$32,900 Active
-
2015-06-24historical
-
2015-03-16price $14,000
-
2015-03-02$17,000 Active
-
2006-01-11soldstatus $6,000,000
ⓘ Source: listings_history table (triggers on properties + properties_extension) + one-shot
backfill from property_details.listing_events for pre-trigger history.
Climate risk First Street
- Flood 1/10 Low FEMA zone X (unshaded) · 0% chance over 30 yrs
- Wildfire 4/10 Moderate
- Heat 10/10 Extreme 7 d/yr ≥108°F today · 26 d/yr by 30 yrs out
- Wind 10/10 Extreme 99% chance of damaging wind over 30 yrs
- Air quality 2/10 Low 1 unhealthy d/yr today · 3 by 30 yrs out
Nearby sold comps map
Loading sold comps map…
Walkable amenities ~0.75 mi
Loading nearby amenities…
Taxation est. · year 1
- Rental income
- $19,849
- − Mortgage interest
- −$1,843
- − Property taxes
- −$494
- − Insurance
- −$164
- − Repairs & maintenance
- −$1,588
- − Management
- −$1,588
- − Depreciation
- −$957
- Taxable income
- $13,215
- Est. tax owed @ 24.0%
- −$3,172
- After-tax cash flow
- $9,781/yr
For passive investors: Depreciation is non-cash, so a rental often shows a tax loss while cash-flowing — sheltering income. Rental losses are passive: they offset passive income freely, and up to $25,000/yr can offset ordinary (W-2) income if you actively participate and your MAGI is under $100k (phasing out to $0 by $150k); unused losses carry forward. On sale, claimed depreciation is recaptured at up to 25%, and gains may owe capital-gains tax (a 1031 exchange can defer both). Figures are a year-1 estimate at your 24.0% rate — not tax advice; consult a CPA.
Schools (NCES district)
- District
- Pasco
- NCES district ID
- 1201530
- Math proficiency
- 50% ▼ -10.00%
- Reading proficiency
- 52% ▼ -5.00%
- Median HH income
- $45,039
- Composite
- 43.14/100
- National rank
- #3074
- State rank
- #32 of 73 in FL
Livability — New Port Richey East
- Score
- 68/100
- State rank
- #499
- US rank
- #9203
Category grades
Schools grade is shown separately in the Schools card above.
Census & demographics
- Census place
- New Port Richey East, FL
- County
- Pasco County · 524,098 people
- City population
- 36,086
- Metro
- Tampa-St. Petersburg-Clearwater, FL
- Population (ZIP)
- 35,945
- Household income
- $49,563
- Rent vs Own
- Severe rent burden
- 1439.0
Population outlook (Pasco County) Hauer SSP2
- Today (2025)
- 570,045 people
- By 2030
- 605,844 · +6.3%
- By 2040
- 674,806 · +18.4%
- By 2050
- 736,022 · +29.1%
- By 2075
- 862,900 · +51.4%
- By 2100
- 906,364 · +59.0%
Race, ethnicity, and origin ACS 2023
- Neighborhood character
- Predominantly White (74%)
- Race & ethnicity
- White 74% Hispanic / Latino 14% Two or more races 9% Black 6% Asian 2%
- Hispanic origin (detail)
- Mexican 3% Puerto Rican 4% Cuban 2%
- Common ancestry
- Romanian 3% Lithuanian 2% Slovak 2%
- Foreign-born
- 11% · Canada, Jamaica, China
- Languages at home
- 84% English-only · Spanish 9% Other Indo-European 2% Russian/Polish/Slavic 2%
Political lean MEDSL · Pasco
- 2024 margin
- Strong R (+25.2) · D 36.9% · R 62.1% · Other 1.0%
- 2008→2024 swing
- -21.6pp toward R · 2008: -3.6pp · 2024: -25.2pp
- All cycles
- 2024: R+25.2 2020: R+20.1 2016: R+21.6 2012: R+6.7 2008: R+3.6
Not yet ingested
- Civics
- —
Market trends
- HPI YoY
- ▼ -73.10%
- Current HPI
- 324.6519
- Rent YoY
- ▼ -2.92%
- Metro
- Tampa-St. Petersburg-Clearwater, FL
- State GDP YoY
- ▲ 3.28%
- F500 in state
- 36
Industry mix (Fortune 500 HQ in FL)
| Industry | F500 HQs | Revenue |
|---|---|---|
| Industrial Technology | 2 | $29B |
|
||
| Insurance | 2 | $17B |
|
||
| Retail | 1 | $60B |
|
||
| Technology Distribution | 1 | $58B |
|
||
| Homebuilding | 1 | $35B |
|
||
| Technology Manufacturing | 1 | $35B |
|
||
Price history
-99.5% since first listed5 events — show timeline
- 2025-11-10 Listed $32,900 ForSaleByOwner.com
- 2015-06-24 Listing Removed — Stellar MLS as Distributed by MLS Grid
- 2015-03-16 Price Changed $14,000 Stellar MLS as Distributed by MLS Grid
- 2015-03-02 Listed $17,000 Stellar MLS as Distributed by MLS Grid
- 2006-01-11 Sold (Public Records) $6,000,000 Public Records
Property tax history
+9.4%/yrLatest (2025): $183,329 · +4.2% YoY. Source: county tax records.
Cash-flow waterfall
monthlySold comps — $/sqft
last 12 mo · ≤1 miLoading sold comps…