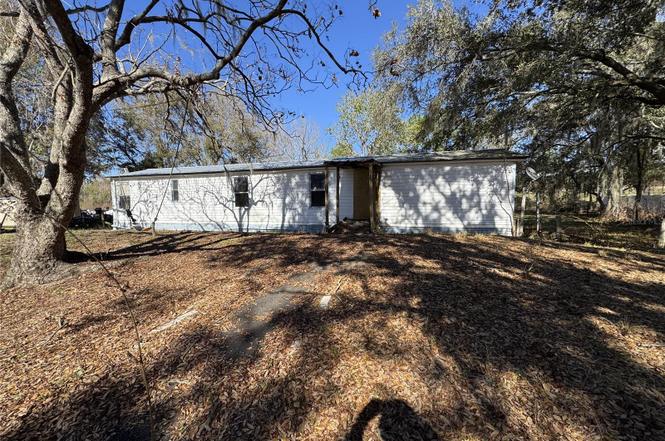
8921 Hammock Loop · Polk City, FL
Flood risk 1/10 · Minimal
- FEMA flood zone
- X (unshaded)
- Chance of flooding over 30 yrs
- 0.0%
- Est. flood insurance / yr
- $507 – $1,088
Fire risk 6/10 · Moderate
- Est. fire insurance / yr
- $947 – $1,759
Heat risk 8/10 · Major
- Hot days now (above 107°F)
- 6 days/yr
- Hot days in 30 yrs
- 20 days/yr
Wind risk 9/10 · Severe
- Chance of severe wind over 30 yrs
- 99.0%
Air-quality risk 2/10 · Minimal
- Unhealthy air days now
- 0 days/yr
- Unhealthy air days in 30 yrs
- 1 days/yr
Risk factors via First Street. Map © Google.
Why this score? — see what drove the B- grade
The composite is a weighted blend of 9 inputs, each scored 0–100. Each bar is that input's sub-score; the figure is the points it added to the 100-point composite (weight × sub-score).
- Cash flow +30.0/30.0
- 1% rule +10.0/10.0
- DSCR +10.0/10.0
- ARV discount +7.5/15.0
- Schools +3.5/10.0
- Livability +3.4/5.0
- Rent growth +2.5/5.0
- Condition / age +2.5/5.0
- Appreciation +0.0/10.0
$63,000
🖨 Deal sheet (PDF) 📄 Offer letter ✓ Due diligence
Listing remarks MLS
Country living with lots of room to play. Above ground pool and fenced yard over an acre. Well-maintained mobile home w/ walkway, gazebo, worksheds, and landscaping.
Key facts
- 1 acre lot
- Endless potential
- Conveniently located
Tags
Property features AI
Finance
- Other: Lot approximately 1 acre (approx. dimensions 145 x 260, paved road); Living area approximately 840 (public records)
- Financial info: Lease restrictions apply
- HOA & community: No HOA/association; Pets allowed
Exterior
- Parking: Carport with 2 spaces
- Security: No security features listed
- Utilities: Public water; Septic tank sewer; Other utilities
- Home design: Manufactured home (Double wide); Single-story; Faces west; Entry level: 1
- Construction: Other construction materials; Other roof; Crawlspace foundation; Built as a double wide manufactured home
- Exterior features: Sidewalk; Shed(s)
Interior
- Kitchen: No appliances listed
- Bedrooms: 2 bedrooms
- Flooring: Other flooring
- Bathrooms: 1 full bathroom
- Heating & cooling: Other heating; Other cooling
- Interior features: No interior features listed
- Laundry & utility: No laundry features
Neighborhood map
What this means for you Summary
Snapshot
- This is a 2-bed/1.0-bath manufactured listed at $63k.
Deal economics
- At list price, monthly cash flow is $686 ($8k/yr) — positive.
- The deal already cash-flows at list — no discount required.
- Meets the 1% rule at list price ($1k rent vs $63k).
- Recommended offer: $62k (1.5% below list) — sets the bar for market timing.
Location & tenants
- Location reads 68/100 on livability (#501 in FL) — a middle-class / working-renter tenant base. Strengths: crime A+, cost of living A+, housing A+; Watch: schools D, amenities F, commute F.
- Polk (suburban): math 39% / reading 43% proficiency, ranked #62 of 73 in FL (top 85%) — families likely to look elsewhere, expect single-tenant / working-renter base with shorter leases.
- Market conditions: 422 active listings in the ZIP; 10,384 units permitted in Polk County in 2024 (1,716 in 5+ unit buildings).
Forward outlook
- Local home prices are declining (-3.0%/yr); year-one equity from $436 of loan paydown is wiped out by about $2k of value loss. Plan a longer hold.
- Polk County population projected at +33% by 2050 — long-run rental-demand tailwind backs the buy-and-hold thesis.
- At projected returns (-3.0% appreciation + 3.0% rent growth), your $18k cash investment doubles in ~3 years — after that, you're playing with house money.
Negotiation context
- It's been on market 22 days — a 2% lower offer ($62k) is reasonable based on typical stale-listing flexibility.
- 4 sale attempts since 21y ago; this cycle's ask has dropped $7k (10%) from the opening price — seller is motivated, your offer sets the floor, not the list.
Risks & watch-outs
- Watch-outs: property tax is 2.7% of price.
- Climate carrying-cost: severe wind risk, 99% chance of damaging wind over 30y; major wildfire risk; extreme-heat days projected 6→20/yr by 2055 (HVAC capex compounding) — expect insurance premiums to compound above CPI over the hold.
Questions for the listing agent
- Property tax is high relative to price — has the assessment been appealed recently, and will the sale trigger a re-assessment?
- Is there a deadline driving the sale (1031 exchange, divorce, estate, relocation)? That informs how much negotiation room exists.
- Schools are D-rated, which usually means shorter tenancies and higher turnover. Who's the typical renter profile here, and what's been the actual vacancy rate?
- What's the average days-on-market for RENTAL listings here right now (not sales)? A rising rental-DOM trend means longer vacancies and softer asking-rent achievability than the comps imply.
- What's the recent tenant-quality profile in this submarket — average credit score on applications, eviction rate, late-payment / NSF rate, and stable-employment percentage? A property-management company in the area should have these aggregated.
- How much new for-sale + rental construction is in the pipeline within 1–3 miles? Heavy new supply typically softens prices + rents 12–24 months out; constrained supply supports both.
Investment metrics
- 1% rule
- 2.38% ✓
- Cap rate
- 19.36%
- Cash-on-cash
- 46.68%
- DSCR
- 3.08
- GRM
- 3.5
CMA / ARV
No comps found within radius.
Projected returns pro-forma
-3.0% appreciation · 3.0% rent growth · sell at horizon
- IRR
- 44.0%
- Equity multiple
- 2.90×
- Total profit
- $33,553
- Equity at exit
- $9,394
- IRR
- 50.0%
- Equity multiple
- 5.86×
- Total profit
- $85,735
- Equity at exit
- $5,447
Cash invested: $17,640 (down + closing). Projections, not guarantees.
Landlord ↔ Tenant lean methodology
- Overall (STATE)
- 87 Strongly Landlord-Friendly
- State Florida
- 87 Strongly Landlord-Friendly · R+3
- County
- — inherits STATE
- City
- — inherits STATE
ZIP-level market 33868
- Home prices YoY
- -9.3%
- Active inventory
- 422
- Price-to-rent
- 3.5×
Monthly cashflow live
- Estimated rent
- $1,497 medium interval (Pro) →
- Mortgage (P&I)
- −$330
- Tax from tax record
- −$140 /mo · $1,679/yr
- Insurance
- −$26
- HOA
- −$0
- Vacancy / Maint / Mgmt
- −$314
- Net cashflow
- $686
Break-even live
Sensitivity live
| Price | -10% $722 | -5% $704 | +0% $686 | +5% $668 | +10% $650 |
|---|---|---|---|---|---|
| Rent | -10% $568 | -5% $627 | +0% $686 | +5% $745 | +10% $804 |
| Rate | -1.0pp $718 | -0.5pp $702 | base $686 | +0.5pp $670 | +1.0pp $653 |
UW: 25.0% down · 7.5% · 30yr · 1.5% tax · 5.0% vac · 8.0% maint · 8.0% mgmt
Financing live
Cash to close
- Down payment
- $15,750
- Closing costs
- $1,890
- Reserves months
- —
- Total cash needed
- —
Loan-product check · same deal, 3 products live
Conventional
25% down · 7.5% · 30yr
- Down + closing
- —
- Monthly P&I
- —
- Monthly cashflow
- —
- DSCR
- —
- Eligible?
- —
Personal DTI + credit; lowest rate.
DSCR
20% down · 8.5% · 30yr
- Down + closing
- —
- Monthly P&I
- —
- Monthly cashflow
- —
- DSCR
- —
- Eligible?
- —
No personal income docs; deal must DSCR.
Hard money
10% down · 12.0% · 12mo
- Down + closing
- —
- Monthly P&I
- —
- Monthly cashflow
- —
- DSCR
- —
- Eligible?
- —
Short-term bridge; refi at stabilization.
Listing history 12 events
-
2026-05-14status Pending
-
2026-05-12price $63,000
-
2026-05-06status Active
-
2026-03-27status Pending
-
2026-03-13$70,000 Active
-
2005-10-04soldstatus $73,000
-
2005-08-31historical
-
2005-07-08$78,000
-
2005-05-10soldstatus $59,900
-
2005-05-03soldstatus $59,900 165-char remark
Show marketing remark (165 chars)
Country living with lots of room to play. Above ground pool and fenced yard over an acre. Well-maintained mobile home w/ walkway, gazebo, worksheds, and landscaping.
-
2005-01-26$59,900 165-char remark
Show marketing remark (165 chars)
Country living with lots of room to play. Above ground pool and fenced yard over an acre. Well-maintained mobile home w/ walkway, gazebo, worksheds, and landscaping.
-
1991-06-01soldstatus $9,500
ⓘ Source: listings_history table (triggers on properties + properties_extension) + one-shot
backfill from property_details.listing_events for pre-trigger history.
Tax reassessment forecast FL · Resets to sale price
- Current annual tax
- $1,679 · $140/mo
- Projected year-2 tax
- $1,679 · $140/mo
- Expected delta
- $0/yr ($0/mo · 0.0%)
ⓘ Screening estimate from a state-policy table — verify with the county assessor before closing.
Climate risk First Street
- Flood 1/10 Low FEMA zone X (unshaded) · 0% chance over 30 yrs
- Wildfire 6/10 Major
- Heat 8/10 Severe 6 d/yr ≥107°F today · 20 d/yr by 30 yrs out
- Wind 9/10 Extreme 99% chance of damaging wind over 30 yrs
- Air quality 2/10 Low 0 unhealthy d/yr today · 1 by 30 yrs out
Nearby sold comps map
Loading sold comps map…
Walkable amenities ~0.75 mi
Loading nearby amenities…
Taxation est. · year 1
- Rental income
- $17,965
- − Mortgage interest
- −$3,529
- − Property taxes
- −$1,679
- − Insurance
- −$315
- − Repairs & maintenance
- −$1,437
- − Management
- −$1,437
- − Depreciation
- −$1,833
- Taxable income
- $7,735
- Est. tax owed @ 24.0%
- −$1,856
- After-tax cash flow
- $6,378/yr
For passive investors: Depreciation is non-cash, so a rental often shows a tax loss while cash-flowing — sheltering income. Rental losses are passive: they offset passive income freely, and up to $25,000/yr can offset ordinary (W-2) income if you actively participate and your MAGI is under $100k (phasing out to $0 by $150k); unused losses carry forward. On sale, claimed depreciation is recaptured at up to 25%, and gains may owe capital-gains tax (a 1031 exchange can defer both). Figures are a year-1 estimate at your 24.0% rate — not tax advice; consult a CPA.
Schools (NCES district)
- District
- Polk
- NCES district ID
- 1201590
- Math proficiency
- 39% ▼ -11.00%
- Reading proficiency
- 43% ▼ -4.00%
- Median HH income
- $43,979
- Composite
- 34.74/100
- National rank
- #5132
- State rank
- #62 of 73 in FL
Livability — Polk City
- Score
- 68/100
- State rank
- #501
- US rank
- #9243
Category grades
Schools grade is shown separately in the Schools card above.
Census & demographics
- Population (ZIP)
- 13,676
Population outlook (Polk County) Hauer SSP2
- Today (2025)
- 752,975 people
- By 2030
- 804,621 · +6.9%
- By 2040
- 906,117 · +20.3%
- By 2050
- 1,000,476 · +32.9%
- By 2075
- 1,197,520 · +59.0%
- By 2100
- 1,271,518 · +68.9%
Race, ethnicity, and origin ACS 2023
- Neighborhood character
- Predominantly White (66%)
- Race & ethnicity
- White 66% Hispanic / Latino 22% Two or more races 14% Black 6%
- Hispanic origin (detail)
- Mexican 6% Puerto Rican 11% Dominican 2%
- Common ancestry
- Lithuanian 1% Italian 1% Slovak 1%
- Foreign-born
- 6% · Canada
- Languages at home
- 80% English-only · Spanish 17% Other Indo-European 1%
Political lean MEDSL · Polk
- 2024 margin
- Strong R (+20.7) · D 39.2% · R 59.9%
- 2008→2024 swing
- -14.6pp toward R · 2008: -6.1pp · 2024: -20.7pp
- All cycles
- 2024: R+20.7 2020: R+14.4 2016: R+14.1 2012: R+6.8 2008: R+6.1
Not yet ingested
- Civics
- —
Market trends
- HPI YoY
- ▼ -33.52%
- Current HPI
- 325.6917
- Rent YoY
- —
- Metro
- —
- State GDP YoY
- ▲ 3.28%
- F500 in state
- 36
Industry mix (Fortune 500 HQ in FL)
| Industry | F500 HQs | Revenue |
|---|---|---|
| Industrial Technology | 2 | $29B |
|
||
| Insurance | 2 | $17B |
|
||
| Retail | 1 | $60B |
|
||
| Technology Distribution | 1 | $58B |
|
||
| Homebuilding | 1 | $35B |
|
||
| Technology Manufacturing | 1 | $35B |
|
||
Price history
+563.2% since first listed12 events — show timeline
- 2026-05-14 Pending — Stellar MLS as Distributed by MLS Grid
- 2026-05-12 Price Changed $63,000 Stellar MLS as Distributed by MLS Grid
- 2026-05-06 Relisted — Stellar MLS as Distributed by MLS Grid
- 2026-03-27 Pending — Stellar MLS as Distributed by MLS Grid
- 2026-03-13 Listed $70,000 Stellar MLS as Distributed by MLS Grid
- 2005-10-04 Sold (Public Records) $73,000 Public Records
- 2005-08-31 Listing Removed — Stellar MLS as Distributed by MLS Grid
- 2005-07-08 Listed $78,000 Stellar MLS as Distributed by MLS Grid
- 2005-05-10 Sold (Public Records) $59,900 Public Records
- 2005-05-03 Sold (MLS) $59,900 Stellar MLS as Distributed by MLS Grid
- 2005-01-26 Listed $59,900 Stellar MLS as Distributed by MLS Grid
- 1991-06-01 Sold (Public Records) $9,500 Public Records
Property tax history
+12.7%/yrLatest (2025): $1,679 · +10.5% YoY. Source: county tax records.
Cash-flow waterfall
monthlySold comps — $/sqft
last 12 mo · ≤1 miLoading sold comps…