 Duplex
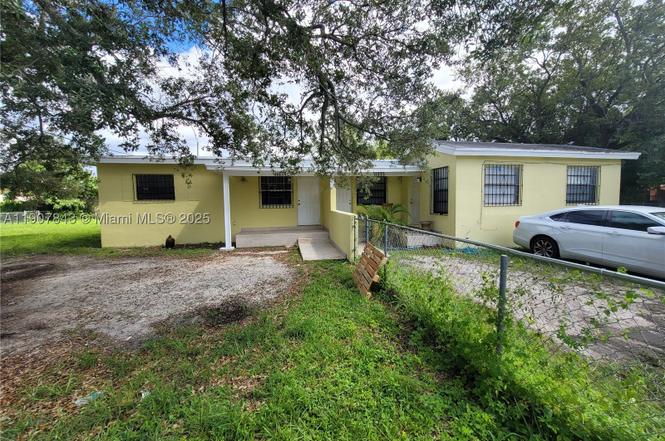
11275 NW 17th Ave · Pinewood, FL
Flood risk 1/10 · Minimal
- FEMA flood zone
- X (unshaded)
- Chance of flooding over 30 yrs
- 0.0%
- Est. flood insurance / yr
- $507 – $1,088
Fire risk 1/10 · Minimal
- Est. fire insurance / yr
- $947 – $1,759
Heat risk 10/10 · Severe
- Hot days now (above 105°F)
- 7 days/yr
- Hot days in 30 yrs
- 29 days/yr
Wind risk 10/10 · Severe
- Chance of severe wind over 30 yrs
- 99.0%
Air-quality risk 2/10 · Minimal
- Unhealthy air days now
- 1 days/yr
- Unhealthy air days in 30 yrs
- 2 days/yr
Risk factors via First Street. Map © Google.
Why this score? — see what drove the C- grade
The composite is a weighted blend of 9 inputs, each scored 0–100. Each bar is that input's sub-score; the figure is the points it added to the 100-point composite (weight × sub-score).
- Cash flow +18.9/30.0
- ARV discount +7.5/15.0
- DSCR +5.9/10.0
- 1% rule +4.7/10.0
- Schools +4.2/10.0
- Livability +4.0/5.0
- Rent growth +2.5/5.0
- Condition / age +2.5/5.0
- Appreciation +0.0/10.0
$579,900
🖨 Deal sheet 📄 Offer letter ✓ Due diligence
Multi-family units
County records classify this as Multi-Family (2-4 Unit). Listing-text estimate: 2 units. confirmed
Listing remarks
Fantastic opportunity for a turn-key, fully remodeled, duplex investment property that generates 6-7% cap rate. Property sits on an over-sized 9,464 Sqft CORNER lot with plenty of parking. The south unit is a 3/1, with an additional room that can be used as a 4th bedroom. It was recently very tastefully remodeled, and is rented for $2,900/mo. The north unit is a 2/1 that is currently vacant. .. .looking to rent for $2,500.00/mo, or for a buyer-occupant that may want to live in it. Perfect for an investor or owner that can live in one unit while the other unit generates monthly income. Great location close to I-95, Gratigny expressway, Wynwood, Mid-Town, Miami Shores, Miami and Ft. Laud airp
Key facts
- Fully remodeled
- Plenty of parking
- High-demand area
Tags
Property features AI
Finance
- Other: (No additional financial amenities provided)
- Financial info: One unit currently reports $2,900 actual rent (month-to-month); Other unit shows $0.00 actual rent reported
- HOA & community: (No HOA information provided)
Exterior
- Parking: Total of 10 parking spaces; Individual unit parking spaces
- Security: (No security information provided)
- Utilities: Septic tank sewer; Cable available; Electric service
- Home design: Single-story building
- Construction: Block construction; Composition/shingle roof; Resale property
- Exterior features: Less than quarter acre lot
Interior
- Kitchen: (No kitchen appliance details provided)
- Bedrooms: One 2-bedroom unit; One 4-bedroom unit (month-to-month)
- Flooring: (No flooring information provided)
- Bathrooms: Each unit has one full bathroom
- Heating & cooling: Central electric heating; Central electric cooling
- Interior features: Trash collection included for rentals; Cable service available
- Laundry & utility: Laundry room available in one unit
Neighborhood map
What this means for you Summary
Snapshot
- This is a 2 × 3-bed/1.0-bath units multifamily listed at $580k.
Deal economics
- At list price, monthly cash flow is $590 ($7k/yr) — positive. Per door: $295/mo.
- The deal already cash-flows at list — no discount required.
- To meet the 1% rule (rent ≥ 1% of price), the offer needs to be $561k (3.3% below list).
- Recommended offer: $510k (12.0% below list) — sets the bar for market timing.
Location & tenants
- Location reads 80/100 on livability (#124 in FL, #1,871 nationally) — a professional / high-income tenant draw. Strengths: commute A+, health & safety A+, cost of living A; Watch: employment D, amenities F.
- Miami-Dade (suburban): math 45% / reading 54% proficiency, ranked #40 of 73 in FL (top 55%) — families likely to look elsewhere, expect single-tenant / working-renter base with shorter leases; 64% free/reduced lunch — lower-income household profile, screen leases tightly.
- Market conditions: 148 active listings in the ZIP; 10,051 units permitted in Miami-Dade County in 2024 (7,758 in 5+ unit buildings).
- At $5,606/mo this rent would consume 107% of the median local household income ($63k/yr) (locally 700% of renters already pay >50% of income on rent) — very limited rent-growth headroom before tenants either downsize or default.
Forward outlook
- Local home prices are declining (-3.0%/yr); year-one equity from $4k of loan paydown is wiped out by about $17k of value loss. Plan a longer hold.
- Miami-Dade County population projected at +28% by 2050 — long-run rental-demand tailwind backs the buy-and-hold thesis.
Negotiation context
- It's been on market 145 days — a 12% lower offer ($510k) is reasonable based on typical stale-listing flexibility.
- 5 sale attempts with the ask held roughly flat each time — persistent listings suggest the price (not the market) is what's stuck; bring a comps-based counter.
- Current owner paid $160k; list at $580k implies a 262% gain — meaningful room to come down on a strong offer.
Risks & watch-outs
- Watch-outs: built in 1957 — expect roof / HVAC / electrical / plumbing capex.
- Climate carrying-cost: severe wind risk, 99% chance of damaging wind over 30y; extreme-heat days projected 7→29/yr by 2055 (HVAC capex compounding) — expect insurance premiums to compound above CPI over the hold.
Questions for the listing agent
- It's been on market 145 days. Have you received any prior offers? Is the seller open to a 12% concession, seller financing, or rate buy-down credit?
- Can we see the unit-by-unit rent roll, current vacancy, and any below-market leases? What's the average tenancy length?
- What capital expenditures (roof, boiler, parking lot, exteriors) have been made in the last 5 years, and what's planned in the next 2?
- Built in 1957 — when were the roof, HVAC, electrical panel, plumbing, and water heater last replaced?
- Why hasn't it sold? Are there any deal-killer items the seller is aware of (foundation, flood, title, zoning, code violations)?
- Is there a deadline driving the sale (1031 exchange, divorce, estate, relocation)? That informs how much negotiation room exists.
- Schools are B-rated — typically a magnet for longer-tenancy family renters. What's the average tenant stay here, and is there a school-zone premium baked into asking?
- What's the average days-on-market for RENTAL listings here right now (not sales)? A rising rental-DOM trend means longer vacancies and softer asking-rent achievability than the comps imply.
- What's the recent tenant-quality profile in this submarket — average credit score on applications, eviction rate, late-payment / NSF rate, and stable-employment percentage? A property-management company in the area should have these aggregated.
- How much new apartment / multifamily construction is in the pipeline within 1–3 miles? Heavy new supply (>2% of stock underway) typically softens rents 12–24 months out; light construction supports rent growth.
Investment metrics
- 1% rule
- 0.97% ✗
- Cap rate
- 7.51%
- Cash-on-cash
- 4.36%
- DSCR
- 1.19
- GRM
- 8.6
CMA / ARV
No comps found within radius.
Projected returns pro-forma
-3.0% appreciation · 3.0% rent growth · sell at horizon
- IRR
- -9.5%
- Equity multiple
- 0.65×
- Total profit
- $-56,401
- Equity at exit
- $86,465
- IRR
- -0.1%
- Equity multiple
- 1.00×
- Total profit
- $-791
- Equity at exit
- $50,139
Cash invested: $162,372 (down + closing). Projections, not guarantees.
Landlord ↔ Tenant lean methodology
- Overall (STATE)
- 87 Strongly Landlord-Friendly
- State Florida
- 87 Strongly Landlord-Friendly · R+3
- County
- — inherits STATE
- City
- — inherits STATE
ZIP-level market 33167
- Home prices YoY
- -14.8%
- Active inventory
- 148
- Price-to-rent
- 17.2×
Monthly cashflow live
- Estimated rent
- $5,606 medium interval (Pro) →
- Mortgage (P&I)
- −$3,041
- Tax from tax record
- −$556 /mo · $6,671/yr
- Insurance
- −$242
- HOA
- −$0
- Vacancy / Maint / Mgmt
- −$1,177
- Net cashflow
- $590
Break-even live
2-unit breakdown (identical units grouped — click to expand)
| Units | Beds | Baths | Est. rent |
|---|---|---|---|
| 2× units | 3 | 1 | $5,606 |
| #1 | 3 | 1 | $2,803 |
| #2 | 3 | 1 | $2,803 |
| Total (2 units) | $5,606 | ||
UW: 25.0% down · 7.5% · 30yr · 1.5% tax · 5.0% vac · 8.0% maint · 8.0% mgmt
Financing live
Cash to close
- Down payment
- $144,975
- Closing costs
- $17,397
- Reserves months
- —
- Total cash needed
- —
Loan-product check · same deal, 3 products live
Conventional
25% down · 7.5% · 30yr
- Down + closing
- —
- Monthly P&I
- —
- Monthly cashflow
- —
- DSCR
- —
- Eligible?
- —
Personal DTI + credit; lowest rate.
DSCR
20% down · 8.5% · 30yr
- Down + closing
- —
- Monthly P&I
- —
- Monthly cashflow
- —
- DSCR
- —
- Eligible?
- —
No personal income docs; deal must DSCR.
Hard money
10% down · 12.0% · 12mo
- Down + closing
- —
- Monthly P&I
- —
- Monthly cashflow
- —
- DSCR
- —
- Eligible?
- —
Short-term bridge; refi at stabilization.
Listing history 18 events
-
2026-05-12status Pending
-
2026-04-03price $579,900
-
2026-04-03status Active
-
2026-03-27status Pending
-
2026-03-12price $589,900
-
2026-02-07status Active
-
2026-01-30status Pending
-
2025-12-16status Active
-
2025-11-17status Pending
-
2025-11-04$599,900 Active
-
2025-10-02historical
-
2025-09-12price $629,900
-
2025-04-03$674,900 Active
-
2004-10-08soldstatus $160,000
-
2004-06-15soldstatus $99,900
-
2001-09-18soldstatus $120,000
-
2001-06-26soldstatus $75,000
-
1985-09-01soldstatus $52,200
ⓘ Source: listings_history table (triggers on properties + properties_extension) + one-shot
backfill from property_details.listing_events for pre-trigger history.
Tax reassessment forecast FL · Resets to sale price
- Current annual tax
- $6,671 · $556/mo
- Projected year-2 tax
- $6,671 · $556/mo
- Expected delta
- $0/yr ($0/mo · 0.0%)
ⓘ Screening estimate from a state-policy table — verify with the county assessor before closing.
Climate risk First Street
- Flood 1/10 Low FEMA zone X (unshaded) · 0% chance over 30 yrs
- Wildfire 1/10 Low
- Heat 10/10 Extreme 7 d/yr ≥105°F today · 29 d/yr by 30 yrs out
- Wind 10/10 Extreme 99% chance of damaging wind over 30 yrs
- Air quality 2/10 Low 1 unhealthy d/yr today · 2 by 30 yrs out
Nearby sold comps map
Loading sold comps map…
Walkable amenities ~0.75 mi
Loading nearby amenities…
Taxation est. · year 1
- Rental income
- $67,272
- − Mortgage interest
- −$32,483
- − Property taxes
- −$6,671
- − Insurance
- −$2,900
- − Repairs & maintenance
- −$5,382
- − Management
- −$5,382
- − Depreciation
- −$16,870
- Taxable loss
- −$2,415
- Est. tax savings @ 24.0%
- +$580
- After-tax cash flow
- $7,661/yr
For passive investors: Depreciation is non-cash, so a rental often shows a tax loss while cash-flowing — sheltering income. Rental losses are passive: they offset passive income freely, and up to $25,000/yr can offset ordinary (W-2) income if you actively participate and your MAGI is under $100k (phasing out to $0 by $150k); unused losses carry forward. On sale, claimed depreciation is recaptured at up to 25%, and gains may owe capital-gains tax (a 1031 exchange can defer both). Figures are a year-1 estimate at your 24.0% rate — not tax advice; consult a CPA.
Schools (NCES district)
- District
- Miami-Dade
- NCES district ID
- 1200390
- Math proficiency
- 45% ▼ -16.00%
- Reading proficiency
- 54% ▼ -5.00%
- Median HH income
- $43,928
- Composite
- 41.76/100
- National rank
- #3397
- State rank
- #40 of 73 in FL
Livability — Pinewood
- Score
- 80/100
- State rank
- #124
- US rank
- #1871
Category grades
Schools grade is shown separately in the Schools card above.
Census & demographics
- Census place
- Pinewood, FL
- County
- Miami-Dade County · 2,697,751 people
- Metro
- Miami-Fort Lauderdale-Pompano Beach, FL
- Population (ZIP)
- 23,768
- Household income
- $62,846
- Rent vs Own
- Severe rent burden
- 700.0
Population outlook (Miami-Dade County) Hauer SSP2
- Today (2025)
- 3,126,439 people
- By 2030
- 3,325,765 · +6.4%
- By 2040
- 3,697,561 · +18.3%
- By 2050
- 4,012,134 · +28.3%
- By 2075
- 4,605,612 · +47.3%
- By 2100
- 4,866,598 · +55.7%
Race, ethnicity, and origin ACS 2023
- Neighborhood character
- Majority Black (63%)
- Race & ethnicity
- Black 63% Hispanic / Latino 31% Two or more races 17% White 1%
- Hispanic origin (detail)
- Puerto Rican 2% Cuban 14% Dominican 3%
- Common ancestry
- Hispanic 32%
- Foreign-born
- 45% · Canada, Jamaica, Dominican Republic
- Languages at home
- 34% English-only · French/Haitian/Cajun 33% Spanish 32%
Political lean MEDSL · Miami-Dade
- 2024 margin
- R (+11.4) · D 43.9% · R 55.4%
- 2008→2024 swing
- -27.6pp toward R · 2008: 16.1pp · 2024: -11.4pp
- All cycles
- 2024: R+11.4 2020: D+7.3 2016: D+29.6 2012: D+23.7 2008: D+16.1
Not yet ingested
- Civics
- —
Market trends
- HPI YoY
- ▼ -95.75%
- Current HPI
- 549.9172
- Rent YoY
- —
- Metro
- Miami-Fort Lauderdale-Pompano Beach, FL
- State GDP YoY
- ▲ 3.28%
- F500 in state
- 36
Industry mix (Fortune 500 HQ in FL)
| Industry | F500 HQs | Revenue |
|---|---|---|
| Industrial Technology | 2 | $29B |
|
||
| Insurance | 2 | $17B |
|
||
| Retail | 1 | $60B |
|
||
| Technology Distribution | 1 | $58B |
|
||
| Homebuilding | 1 | $35B |
|
||
| Technology Manufacturing | 1 | $35B |
|
||
Price history
+1010.9% since first listed18 events — show timeline
- 2026-05-12 Pending — MARMLS
- 2026-04-03 Price Changed $579,900 MARMLS
- 2026-04-03 Relisted — MARMLS
- 2026-03-27 Pending — MARMLS
- 2026-03-12 Price Changed $589,900 MARMLS
- 2026-02-07 Relisted — MARMLS
- 2026-01-30 Pending — MARMLS
- 2025-12-16 Relisted — MARMLS
- 2025-11-17 Pending — MARMLS
- 2025-11-04 Listed $599,900 MARMLS
- 2025-10-02 Listing Removed — MARMLS
- 2025-09-12 Price Changed $629,900 MARMLS
- 2025-04-03 Listed $674,900 MARMLS
- 2004-10-08 Sold (Public Records) $160,000 Public Records
- 2004-06-15 Sold (Public Records) $99,900 Public Records
- 2001-09-18 Sold (Public Records) $120,000 Public Records
- 2001-06-26 Sold (Public Records) $75,000 Public Records
- 1985-09-01 Sold (Public Records) $52,200 Public Records
Property tax history
+5.8%/yrLatest (2025): $6,671 · +2.8% YoY. Source: county tax records.
Cash-flow waterfall
monthlySold comps — $/sqft
last 12 mo · ≤1 miLoading sold comps…