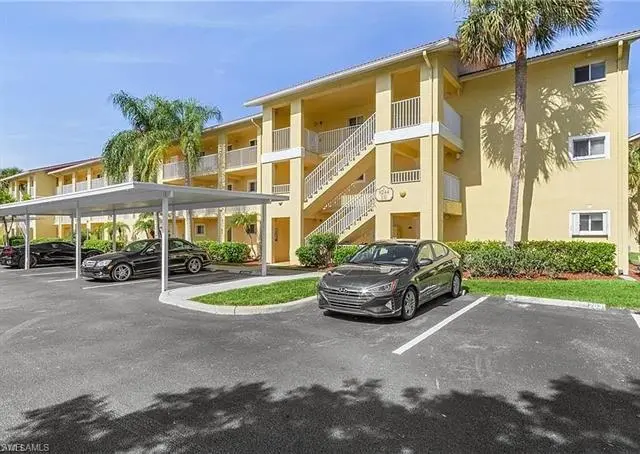
8271 Key Royal Cir #932 · Island Walk, FL
Flood risk 1/10 · Minimal
- FEMA flood zone
- X (unshaded)
- Chance of flooding over 30 yrs
- 0.0%
- Est. flood insurance / yr
- $507 – $1,088
Fire risk 6/10 · Moderate
- Est. fire insurance / yr
- $947 – $1,759
Heat risk 10/10 · Severe
- Hot days now (above 107°F)
- 7 days/yr
- Hot days in 30 yrs
- 30 days/yr
Wind risk 10/10 · Severe
- Chance of severe wind over 30 yrs
- 99.0%
Air-quality risk 2/10 · Minimal
- Unhealthy air days now
- 2 days/yr
- Unhealthy air days in 30 yrs
- 2 days/yr
Risk factors via First Street. Map © Google.
Why this score? — see what drove the D- grade
The composite is a weighted blend of 9 inputs, each scored 0–100. Each bar is that input's sub-score; the figure is the points it added to the 100-point composite (weight × sub-score).
- Cash flow +11.3/30.0
- ARV discount +7.5/15.0
- Schools +5.0/10.0
- 1% rule +4.9/10.0
- DSCR +3.3/10.0
- Livability +3.2/5.0
- Condition / age +2.5/5.0
- Rent growth +1.9/5.0
- Appreciation +0.0/10.0
$228,000
🖨 Deal sheet 📄 Offer letter ✓ Due diligence
Listing remarks
Location, Location! Just off Immokalee Rd, this newly renovated 2-bed, 2-bath, 3rd-floor condo in the gated Key Royal community of Naples is a must-see! Featuring a combo living/dining room, full-size in-unit laundry, and a kitchen with a breakfast bar perfect for entertaining. The spacious master suite offers a walk-in closet and private bath with a tub/shower combo, while the 2nd bedroom also includes a walk-in closet and its own tub/shower combo bath. Enjoy the community pool, spa, picnic area, tiki hut, and more! NEW appliances, water heater, LOW HOAfees, and fantastic rental income potential. Close to top-rated schools. Room dimensions approximate; buyer to verify. Great Income Potenti
Key facts
- Gated community
- Community pool
- Walk in closet
Tags
Property features AI
Finance
- HOA & community: Mandatory HOA; Quarterly condo fee of $1,191 (total annual recurring fees $4,764); Professional management; HOA maintenance covers cable, insurance, lawn/land maintenance, recreation facilities, reserves, sewer, trash removal, and water; Community amenities include bike and jog path, clubhouse, community pool, community spa/hot tub, and exercise room; Gated community
Exterior
- Parking: 1 assigned parking space
- Security: Gated community
- Utilities: Central water; Central sewer; Cable available
- Home design: Residential low-rise building (1–3 stories); Rear exposure facing south; Part of Key Royal Condominiums development
- Construction: Concrete block construction; Tile roof; Built in 2003
- Exterior features: Stucco exterior finish; Sliding windows; Landscaped area view; Regular lot; Canal width: None
Interior
- Kitchen: Cooktop; Range; Microwave; Dishwasher; Refrigerator
- Bedrooms: 2 bedrooms
- Flooring: Carpet; Tile
- Bathrooms: 2 full bathrooms; Master bath with combo tub and shower
- Heating & cooling: Central electric heat; Central electric cooling; Ceiling fans
- Interior features: Walk-in closet; Dining area with breakfast bar and dining/living configuration; Laundry in residence; Unfurnished
- Laundry & utility: Washer; Dryer
Neighborhood map
What this means for you Summary
Snapshot
- This is a 2-bed/2.0-bath condo listed at $228k.
Deal economics
- At list price, monthly cash flow is $-83 ($-1k/yr) — negative.
- To cash-flow at today's rent, offer at most $213k (6.5% below list).
- To meet the 1% rule (rent ≥ 1% of price), the offer needs to be $226k (1.1% below list).
- Recommended offer: $213k (6.5% below list) — sets the bar for cash-flow.
Location & tenants
- Location reads 64/100 on livability (#692 in FL) — a middle-class / working-renter tenant base. Strengths: crime A+, employment A+, housing B+; Watch: health & safety D, amenities F, commute F.
- Collier (suburban): math 60% / reading 56% proficiency, ranked #16 of 73 in FL (top 22%) — acceptable for families but not a draw, mixed tenant base, ~2y average lease.
- Zoned schools: Laurel Oak Elementary School (math 82% / reading 77%, grade A, #116 of 2,144 statewide, top 6%, 1,203 students, 20% FRL); Gulf Coast High School (math 57% / reading 68%, grade B-, #93 of 667 statewide, top 14%, 2,447 students, 20% FRL) — zoned schools average 20% FRL vs 55% district-wide (35 pts lower); this property's tenant base skews higher-income than the district average.
- Zoned-school proficiency averages 71% at this address vs 58% district-wide (+13 pts) — the actual schools serving this property are materially stronger than the Collier average implies; a family-tenant draw the district grade alone would hide.
- Market conditions: Rents soft (-2.5%/yr); 586 active listings in the ZIP; 40 comparable units currently listed for rent nearby; rentals at typical pace (median 23d on market — plan ~3-4 weeks tenant-placement turnaround); high-income renter base; 3,520 units permitted in Collier County in 2024 (959 in 5+ unit buildings).
Forward outlook
- Local home prices are declining (-3.0%/yr); year-one equity from $2k of loan paydown is wiped out by about $7k of value loss. Plan a longer hold.
- Collier County population projected at +30% by 2050 — long-run rental-demand tailwind backs the buy-and-hold thesis.
Negotiation context
- It's been on market 17 days — a 2% lower offer ($225k) is reasonable based on typical stale-listing flexibility.
- 7 sale attempts since 10y ago with the ask held roughly flat each time — persistent listings suggest the price (not the market) is what's stuck; bring a comps-based counter.
- Current owner paid $145k; list at $228k implies a 57% gain — meaningful room to come down on a strong offer.
Risks & watch-outs
- Climate carrying-cost: severe wind risk, 99% chance of damaging wind over 30y; major wildfire risk; extreme-heat days projected 7→30/yr by 2055 (HVAC capex compounding) — expect insurance premiums to compound above CPI over the hold.
Questions for the listing agent
- What do current leases actually rent for vs. the listed asking? Can we see a recent rent roll and the last 12 months of T-12 income?
- What does the HOA fee cover, when was the last increase, and are there any pending special assessments or reserve-fund shortfalls?
- Any open or pending special assessments — roof, HVAC, plumbing, elevator, façade? What's the per-unit balance and payoff schedule, and is the seller paying it off at close or rolling it to the buyer?
- Is there a deadline driving the sale (1031 exchange, divorce, estate, relocation)? That informs how much negotiation room exists.
- The area grade is low — what's the realistic commute time and amenity access for the typical tenant pool here? Any planned neighborhood developments (good or bad) we should know about?
- What's the average days-on-market for RENTAL listings here right now (not sales)? A rising rental-DOM trend means longer vacancies and softer asking-rent achievability than the comps imply.
- What's the recent tenant-quality profile in this submarket — average credit score on applications, eviction rate, late-payment / NSF rate, and stable-employment percentage? A property-management company in the area should have these aggregated.
- How much new apartment / multifamily construction is in the pipeline within 1–3 miles? Heavy new supply (>2% of stock underway) typically softens rents 12–24 months out; light construction supports rent growth.
Investment metrics
- 1% rule
- 0.99% ✗
- Cap rate
- 5.85%
- Cash-on-cash
- -1.57%
- DSCR
- 0.93
- GRM
- 8.4
CMA / ARV
No comps found within radius.
Projected returns pro-forma
-3.0% appreciation · 0.0% rent growth · sell at horizon
- IRR
- -22.9%
- Equity multiple
- 0.24×
- Total profit
- $-48,653
- Equity at exit
- $33,996
- IRR
- -30.8%
- Equity multiple
- -0.16×
- Total profit
- $-73,885
- Equity at exit
- $19,713
Cash invested: $63,840 (down + closing). Projections, not guarantees.
Landlord ↔ Tenant lean methodology
- Overall (STATE)
- 87 Strongly Landlord-Friendly
- State Florida
- 87 Strongly Landlord-Friendly · R+3
- County
- — inherits STATE
- City
- — inherits STATE
ZIP-level market 34119
- Rents YoY
- -2.5%
- Active inventory
- 586
- Price-to-rent
- 8.4×
Monthly cashflow live
- Estimated rent
- $2,255 high interval (Pro) →
- Mortgage (P&I)
- −$1,196
- Tax from tax record
- −$177 /mo · $2,129/yr
- Insurance
- −$95
- HOA
- −$397
- Vacancy / Maint / Mgmt
- −$474
- Net cashflow
- $-83
Break-even live
UW: 25.0% down · 7.5% · 30yr · 1.5% tax · 5.0% vac · 8.0% maint · 8.0% mgmt
Financing live
Cash to close
- Down payment
- $57,000
- Closing costs
- $6,840
- Reserves months
- —
- Total cash needed
- —
Loan-product check · same deal, 3 products live
Conventional
25% down · 7.5% · 30yr
- Down + closing
- —
- Monthly P&I
- —
- Monthly cashflow
- —
- DSCR
- —
- Eligible?
- —
Personal DTI + credit; lowest rate.
DSCR
20% down · 8.5% · 30yr
- Down + closing
- —
- Monthly P&I
- —
- Monthly cashflow
- —
- DSCR
- —
- Eligible?
- —
No personal income docs; deal must DSCR.
Hard money
10% down · 12.0% · 12mo
- Down + closing
- —
- Monthly P&I
- —
- Monthly cashflow
- —
- DSCR
- —
- Eligible?
- —
Short-term bridge; refi at stabilization.
Rent comps 40 comps
| Address | Beds | Baths | Sqft | Rent | $/sqft | DOM | Units | Dist |
|---|---|---|---|---|---|---|---|---|
| 8274 Key Royal Cir Naples, FL | 2.0 | 1.0 | 946 | $1,700 | $1.80 | 23d | 2 | 0.02mi |
| 8264 Key Royal Cir #831 Naples, FL | 2.0 | 2.0 | 1020 | $1,850 | $1.81 | 23d | 1 | 0.02mi |
| 8271 Key Royal Cir #924 Naples, FL | 2.0 | 2.0 | 1100 | $2,100 | $1.91 | 23d | 1 | 0.03mi |
| 8284 Key Royal Cir #1323 Naples, FL | 2.0 | 1.0 | 1010 | $1,850 | $1.83 | 23d | 1 | 0.05mi |
| 8288 Key Royal Ln #1431 Naples, FL | 3.0 | 2.0 | 1186 | $2,195 | $1.85 | 13d | 1 | 0.06mi |
| 8244 Key Royal Cir #615 Naples, FL | 2.0 | 1.0 | 946 | $1,850 | $1.96 | 23d | 1 | 0.08mi |
| 8297 Key Royal Ln Naples, FL | 2.0 | 1.0–2.0 | 981 | $2,250 | $2.29 | 23d | 2 | 0.10mi |
| 8294 Key Royal Cir #1633 Naples, FL | 2.0 | 1.0 | 943 | $1,750 | $1.86 | 23d | 1 | 0.11mi |
| 8304 Key Royal Cir #1712 Naples, FL | 2.0 | 1.0 | 946 | $1,750 | $1.85 | 23d | 1 | 0.15mi |
| 8304 Key Royal Cir #1712 Naples, FL | 2.0 | 1.0 | 1000 | $1,700 | $1.70 | 13d | 1 | 0.15mi |
| 8151 Ibis Cove Cir Naples, FL | 3.0 | 2.0 | 1455 | $2,295 | $1.58 | 13d | 1 | 0.22mi |
| 8207 Ibis Cove Cir Unit Y Naples, FL | 3.0 | 2.0 | 1455 | $2,800 | $1.92 | 23d | 1 | 0.24mi |
| 8207 Ibis Cove Cir Unit S Naples, FL | 3.0 | 2.0 | 1455 | $5,000 | $3.44 | 23d | 1 | 0.24mi |
| 8211 Ibis Cove Cir Unit A119 Naples, FL | 3.0 | 2.0 | 1455 | $2,500 | $1.72 | 23d | 1 | 0.24mi |
| 8164 Ibis Cove Cir Unit B202 Naples, FL | 3.0 | 2.0 | 1455 | $2,750 | $1.89 | 23d | 1 | 0.25mi |
| 8633 Addison Place Cir Naples, FL | 1.0–3.0 | 1.0–2.0 | 1077 | $2,408 | $2.24 | 13d | 31 | 0.37mi |
| 8067 Dream Catcher Cir Naples, FL | 2.0–3.0 | 2.5 | 1430 | $2,134 | $1.49 | 13d | 28 | 0.55mi |
| 7975 Preserve Cir #1013 Naples, FL | 1.0 | 1.0 | 945 | $1,450 | $1.53 | 21d | 1 | 0.56mi |
| 7905 Preserve Cir Naples, FL | 2.0–3.0 | 1.0–2.0 | 1272 | $1,750 | $1.38 | 13d | 3 | 0.56mi |
| 7905 Preserve Cir Naples, FL | 3.0 | 2.0 | 1400 | $3,050 | $2.18 | 23d | 2 | 0.56mi |
| 7940 Preserve Cir #916 Naples, FL | 1.0 | 1.0 | 845 | $1,750 | $2.07 | 23d | 1 | 0.61mi |
| 7940 Preserve Cir Naples, FL | 1.0 | 1.0 | 845 | $1,750 | $2.07 | 13d | 1 | 0.61mi |
| 15077 Cortona Way Naples, FL | 3.0 | 2.0 | 1490 | $2,395 | $1.61 | 13d | 1 | 0.64mi |
| 7950 Preserve Cir #812 Naples, FL | 2.0 | 2.0 | 1215 | $1,895 | $1.56 | 23d | 1 | 0.64mi |
| 8820 Walter Way Unit 5107 Naples, FL | 1.0 | 1.0 | 815 | $2,249 | $2.76 | 23d | 1 | 0.67mi |
| 8820 Walter Way Unit 4101 Naples, FL | 2.0 | 2.0 | 1294 | $3,074 | $2.38 | 13d | 1 | 0.67mi |
| 8820 Walter Way Unit 5201 Naples, FL | 2.0 | 2.0 | 1294 | $2,999 | $2.32 | 21d | 1 | 0.67mi |
| 8820 Walter Way Unit 5215 Naples, FL | 1.0 | 1.0 | 815 | $2,299 | $2.82 | 13d | 1 | 0.67mi |
| 15500 Mark Ln Naples, FL | 1.0–3.0 | 1.0–2.0 | 1090 | $2,585 | $2.37 | 13d | 27 | 0.67mi |
| 9063 Gervais Cir #1204 Naples, FL | 3.0 | 2.0 | 1415 | $2,100 | $1.48 | 23d | 1 | 0.76mi |
| 9051 Gervais Cir #1503 Naples, FL | 2.0 | 2.5 | 1415 | $2,350 | $1.66 | 23d | 1 | 0.78mi |
| 9069 Gervais Cir #1109 Naples, FL | 2.0 | 2.5 | 1200 | $1,950 | $1.62 | 23d | 1 | 0.79mi |
| 14905 Pleasant Bay Ln Unit 6204 Naples, FL | 3.0 | 2.0 | 1252 | $1,995 | $1.59 | 13d | 1 | 0.82mi |
| 1927 Morning Sun Ln Unit F27 Naples, FL | 2.0 | 2.0 | 1307 | $3,000 | $2.30 | 23d | 1 | 0.83mi |
| 14885 Pleasant Bay Ln Unit 4202 Naples, FL | 3.0 | 2.0 | 1252 | $1,700 | $1.36 | 13d | 1 | 0.85mi |
| 14885 Pleasant Bay Ln #202 Naples, FL | 3.0 | 2.0 | 1252 | $1,700 | $1.36 | 21d | 1 | 0.85mi |
| 14890 Pleasant Bay Ln Naples, FL | 1.0–2.0 | 1.0–2.0 | 1100 | $1,850 | $1.68 | 13d | 2 | 0.87mi |
| 9093 Gervais Cir #1906 Naples, FL | 2.0 | 2.5 | 1415 | $2,000 | $1.41 | 23d | 1 | 0.90mi |
| 14815 Triangle Bay Dr Naples, FL | 2.0–4.0 | 2.0–4.0 | 1214 | $1,411 | $1.16 | 13d | 11 | 0.93mi |
| 1677 Morning Sun Ln Naples, FL | 2.0 | 2.0 | 1307 | $2,500 | $1.91 | 23d | 1 | 1.04mi |
HOA detail condo
- Monthly dues
- $397 · $4,764/yr
- Likely covers
- waterpoolsecurity
- Assessments
- None detected in remarks — confirm with the listing agent.
Listing history 12 events
-
2026-06-15days on market $228,000 Active 17 DOM
-
2026-06-14days on market $228,000 Active 15 DOM
-
2026-06-10days on market $228,000 Active 12 DOM
-
2026-06-09days on market $228,000 Active 11 DOM
-
2026-06-08days on market $228,000 Active 10 DOM
-
2026-06-07days on market $228,000 Active 9 DOM
-
2026-06-03days on market $228,000 Active 5 DOM
-
2026-06-02days on market $228,000 Active 4 DOM
-
2026-06-01pricedays on market $228,000 Active 3 DOM
-
2026-05-31days on market $235,000 Active 2 DOM
-
2026-05-30remarks 699-char remark
-
2026-05-30$235,000 Active 1 DOM
ⓘ Source: listings_history table (triggers on properties + properties_extension) + one-shot
backfill from property_details.listing_events for pre-trigger history.
Tax reassessment forecast FL · Resets to sale price
- Current annual tax
- $2,129 · $177/mo
- Projected year-2 tax
- $2,129 · $177/mo
- Expected delta
- $0/yr ($0/mo · 0.0%)
ⓘ Screening estimate from a state-policy table — verify with the county assessor before closing.
Climate risk First Street
- Flood 1/10 Low FEMA zone X (unshaded) · 0% chance over 30 yrs
- Wildfire 6/10 Major
- Heat 10/10 Extreme 7 d/yr ≥107°F today · 30 d/yr by 30 yrs out
- Wind 10/10 Extreme 99% chance of damaging wind over 30 yrs
- Air quality 2/10 Low 2 unhealthy d/yr today · 2 by 30 yrs out
Nearby sold comps map
Loading sold comps map…
Walkable amenities ~0.75 mi
Loading nearby amenities…
Taxation est. · year 1
- Rental income
- $27,064
- − Mortgage interest
- −$12,772
- − Property taxes
- −$2,129
- − Insurance
- −$1,140
- − Repairs & maintenance
- −$2,165
- − Management
- −$2,165
- − HOA
- −$4,764
- − Depreciation
- −$6,633
- Taxable loss
- −$4,704
- Est. tax savings @ 24.0%
- +$1,129
- After-tax cash flow
- $129/yr
For passive investors: Depreciation is non-cash, so a rental often shows a tax loss while cash-flowing — sheltering income. Rental losses are passive: they offset passive income freely, and up to $25,000/yr can offset ordinary (W-2) income if you actively participate and your MAGI is under $100k (phasing out to $0 by $150k); unused losses carry forward. On sale, claimed depreciation is recaptured at up to 25%, and gains may owe capital-gains tax (a 1031 exchange can defer both). Figures are a year-1 estimate at your 24.0% rate — not tax advice; consult a CPA.
Schools (NCES district)
- District
- Collier
- NCES district ID
- 1200330
- Math proficiency
- 60% ▼ -4.00%
- Reading proficiency
- 56% ▼ -2.00%
- Median HH income
- $58,275
- Composite
- 50.23/100
- National rank
- #1892
- State rank
- #16 of 73 in FL
Livability — Island Walk
- Score
- 64/100
- State rank
- #692
- US rank
- #14444
Category grades
Schools grade is shown separately in the Schools card above.
Census & demographics
- County
- Collier County · 396,295 people
- Metro
- Naples-Marco Island, FL
- Population (ZIP)
- 36,807
- Household income
- $113,391
- Rent vs Own
- Severe rent burden
- 741.0
Population outlook (Collier County) Hauer SSP2
- Today (2025)
- 420,858 people
- By 2030
- 450,054 · +6.9%
- By 2040
- 502,232 · +19.3%
- By 2050
- 544,932 · +29.5%
- By 2075
- 627,203 · +49.0%
- By 2100
- 659,015 · +56.6%
Race, ethnicity, and origin ACS 2023
- Neighborhood character
- Predominantly White (74%)
- Race & ethnicity
- White 74% Hispanic / Latino 20% Two or more races 14% Black 1%
- Hispanic origin (detail)
- Mexican 6% Puerto Rican 2% Cuban 4% Dominican 2%
- Common ancestry
- Romanian 4% Lithuanian 2% Italian 2%
- Foreign-born
- 17% · Canada, Jamaica, Dominican Republic
- Languages at home
- 78% English-only · Spanish 15% Other Indo-European 3% Russian/Polish/Slavic 1%
Political lean MEDSL · Collier
- 2024 margin
- Solid R (+33.1) · D 33.1% · R 66.2%
- 2008→2024 swing
- -10.6pp toward R · 2008: -22.5pp · 2024: -33.1pp
- All cycles
- 2024: R+33.1 2020: R+24.7 2016: R+26.0 2012: R+30.1 2008: R+22.5
Not yet ingested
- Civics
- —
Market trends
- HPI YoY
- ▼ -243.12%
- Current HPI
- 269.3208
- Rent YoY
- ▼ -2.51%
- Metro
- Naples-Marco Island, FL
- State GDP YoY
- ▲ 3.28%
- F500 in state
- 36
Industry mix (Fortune 500 HQ in FL)
| Industry | F500 HQs | Revenue |
|---|---|---|
| Industrial Technology | 2 | $29B |
|
||
| Insurance | 2 | $17B |
|
||
| Retail | 1 | $60B |
|
||
| Technology Distribution | 1 | $58B |
|
||
| Homebuilding | 1 | $35B |
|
||
| Technology Manufacturing | 1 | $35B |
|
||
Price history
+62.2% since first listed14 events — show timeline
- 2026-05-29 Listed $235,000 NAPLESMLS
- 2025-03-12 Listing Removed — NAPLESMLS
- 2025-02-03 Rental Removed $1,950 NAPLESMLS
- 2025-01-23 Listed for Rent $1,950 NAPLESMLS
- 2025-01-22 Listed $260,000 NAPLESMLS
- 2025-01-22 Listed $260,000 MIML
- 2016-12-15 Sold (MLS) $144,900 Stellar MLS as Distributed by MLS Grid
- 2016-12-12 Sold (MLS) $144,900 NAPLESMLS
- 2016-11-11 Pending — NAPLESMLS
- 2016-11-01 Price Changed $144,900 NAPLESMLS
- 2016-09-23 Price Changed $154,900 NAPLESMLS
- 2016-08-18 Listed $164,900 NAPLESMLS
- 2016-08-17 Listed $144,900 MIML
- 2016-08-17 Listed $144,900 Stellar MLS as Distributed by MLS Grid
Property tax history
+9.3%/yrLatest (2025): $2,129 · +7.1% YoY. Source: county tax records.
Cash-flow waterfall
monthlySold comps — $/sqft
last 12 mo · ≤1 miLoading sold comps…