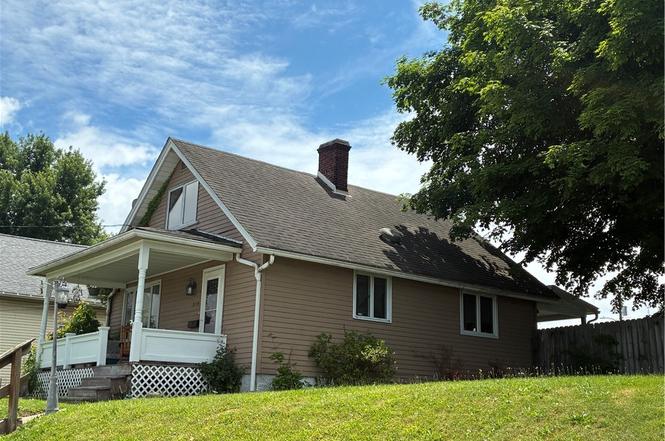
319 Phillips St · Speers, PA
Flood risk 1/10 · Minimal
- FEMA flood zone
- X (unshaded)
- Chance of flooding over 30 yrs
- 0.0%
- Est. flood insurance / yr
- $473 – $860
Fire risk 1/10 · Minimal
- Est. fire insurance / yr
- $511 – $949
Heat risk 4/10 · Minor
- Hot days now (above 98°F)
- 7 days/yr
- Hot days in 30 yrs
- 20 days/yr
Wind risk 2/10 · Minimal
- Chance of severe wind over 30 yrs
- —
Air-quality risk 2/10 · Minimal
- Unhealthy air days now
- 1 days/yr
- Unhealthy air days in 30 yrs
- 2 days/yr
Risk factors via First Street. Map © Google.
Why this score? — see what drove the D- grade
The composite is a weighted blend of 9 inputs, each scored 0–100. Each bar is that input's sub-score; the figure is the points it added to the 100-point composite (weight × sub-score).
- Cash flow +13.2/30.0
- Appreciation +4.1/10.0
- DSCR +4.0/10.0
- Livability +3.6/5.0
- 1% rule +3.5/10.0
- Schools +3.0/10.0
- Rent growth +2.5/5.0
- Condition / age +2.5/5.0
- ARV discount +0.0/15.0
$195,000
🖨 Deal sheet 📄 Offer letter ✓ Due diligence
Listing remarks MLS
Quaint 3BR Bungalow updated throughout with views of the river and fireworks in the summer! Beautiful, gleaming HW floors and rooms decorated in designer palettes set the stage for this well kept home. The entry offers a full closet, built-in desk and opens to the spacious living room with large picture window and crown molding. The 3rd bedroom currently used as a Dining Room, your choice! Enjoy the gourmet kitchen with newer SS appliances, recessed lighting, oak cabinetry, neutral counters and tiled
Key facts
- Covered front porch
- Updated electrical
- Massive basement
Tags
Property features AI
Exterior
- Parking: Detached garage; Off-street parking; Total 2 parking spaces
- Utilities: Public water service; Public sewer service
- Home design: 2-story home; Resale property
- Construction: Aluminum siding; Composition roof
- Exterior features: Public water; Public sewer
Interior
- Flooring: Hardwood; Laminate; Tile
- Bathrooms: 1 full bathroom
- Heating & cooling: Forced air gas heating; Central air conditioning
- Interior features: Hardwood, laminate, and tile flooring; Unfinished basement
Neighborhood map
What this means for you Summary
Snapshot
- This is a 2-bed/1.0-bath single-family listed at $195k.
Deal economics
- At list price, monthly cash flow is $-5 ($-55/yr) — negative.
- To cash-flow at today's rent, offer at most $194k (0.4% below list).
- To meet the 1% rule (rent ≥ 1% of price), the offer needs to be $165k (15.4% below list).
- Recommended offer: $165k (15.4% below list) — sets the bar for 1% rule.
Location & tenants
- Location reads 72/100 on livability (#614 in PA) — a middle-class / working-renter tenant base. Strengths: crime A+, cost of living A+, housing A+; Watch: health & safety D, amenities F, commute F.
- Charleroi SD (rural): math 20% / reading 51% proficiency, ranked #421 of 539 in PA (top 78%) — families likely to look elsewhere, expect single-tenant / working-renter base with shorter leases.
- Market conditions: 87 active listings in the ZIP; 1 comparable units currently listed for rent nearby; 489 units permitted in Washington County in 2024 (30 in 5+ unit buildings).
Forward outlook
- Local home prices are declining (-1.8%/yr); year-one equity from $1k of loan paydown is wiped out by about $4k of value loss. Plan a longer hold.
- Washington County population projected to shrink 6% by 2050 — rents likely to lag national; underwrite the cash flow, not the appreciation.
Negotiation context
- Only 3 days on market — expect competitive offers; lowballing is unlikely to land.
- 5 sale attempts since 23y ago with the ask held roughly flat each time — persistent listings suggest the price (not the market) is what's stuck; bring a comps-based counter.
- Current owner paid $106k; list at $195k implies a 83% gain — meaningful room to come down on a strong offer.
Risks & watch-outs
- Watch-outs: built in 1910 — expect roof / HVAC / electrical / plumbing capex.
Questions for the listing agent
- What do current leases actually rent for vs. the listed asking? Can we see a recent rent roll and the last 12 months of T-12 income?
- Built in 1910 — when were the roof, HVAC, electrical panel, plumbing, and water heater last replaced?
- Is there a deadline driving the sale (1031 exchange, divorce, estate, relocation)? That informs how much negotiation room exists.
- The area grade is low — what's the realistic commute time and amenity access for the typical tenant pool here? Any planned neighborhood developments (good or bad) we should know about?
- What's the average days-on-market for RENTAL listings here right now (not sales)? A rising rental-DOM trend means longer vacancies and softer asking-rent achievability than the comps imply.
- What's the recent tenant-quality profile in this submarket — average credit score on applications, eviction rate, late-payment / NSF rate, and stable-employment percentage? A property-management company in the area should have these aggregated.
- How much new for-sale + rental construction is in the pipeline within 1–3 miles? Heavy new supply typically softens prices + rents 12–24 months out; constrained supply supports both.
Investment metrics
- 1% rule
- 0.85% ✗
- Cap rate
- 6.26%
- Cash-on-cash
- -0.10%
- DSCR
- 1.00
- GRM
- 9.8
CMA / ARV
- ARV (on-the-fly)
- $164,920
- Comps found
- 8
Show comp detail 8 sales within ~0.75 mi
| Address | Dist | Beds/Ba | Sqft | Sold | Price | $/sf | Match |
|---|---|---|---|---|---|---|---|
| 120 Phillips St | 0.25mi | 3/1.0 (+1) | 980 (-10%) | 5mo | $135,000 | $138 | 63 |
| 725 Lewis Ave | 0.19mi | 3/1.0 (+1) | 1,155 (+6%) | 19mo | $180,000 | $156 | 60 |
| 825 Jane Ave | 0.26mi | 3/1.5 (+1) | 1,136 (+5%) | 21mo | $155,000 | $136 | 56 |
| 815 Jane Ave | 0.25mi | 3/2.0 (+1) | 1,204 (+11%) | 14mo | $162,400 | $135 | 50 |
| 257 North Ave | 0.64mi | 3/2.0 (+1) | 1,102 (+2%) | 13mo | $167,300 | $152 | 48 |
| 103 Crest St | 0.18mi | 3/2.0 (+1) | 1,188 (+10%) | 23mo | $194,900 | $164 | 47 |
| 422 Market St | 0.67mi | 3/2.0 (+1) | 1,170 (+8%) | 1mo | $128,000 | $109 | 46 |
| 194 State St | 0.48mi | 3/1.0 (+1) | 1,218 (+12%) | 22mo | $203,000 | $167 | 34 |
Match score weights: distance 35% · size 25% · config 20% · recency 20%. Top-matched comps best support the ARV.
Projected returns pro-forma
-1.83% appreciation · 3.0% rent growth · sell at horizon
- IRR
- -10.1%
- Equity multiple
- 0.59×
- Total profit
- $-22,160
- Equity at exit
- $39,427
- IRR
- -2.5%
- Equity multiple
- 0.80×
- Total profit
- $-10,916
- Equity at exit
- $35,189
Cash invested: $54,600 (down + closing). Projections, not guarantees.
Landlord ↔ Tenant lean methodology
- Overall (STATE)
- 62 Landlord-Friendly
- State Pennsylvania
- 62 Landlord-Friendly · EVEN
- County
- — inherits STATE
- City
- — inherits STATE
ZIP-level market 15022
- Home prices YoY
- -1.0%
- Active inventory
- 87
- Price-to-rent
- 9.8×
Monthly cashflow live
- Estimated rent
- $1,650 medium interval (Pro) →
- Mortgage (P&I)
- −$1,023
- Tax from tax record
- −$204 /mo · $2,451/yr
- Insurance
- −$81
- HOA
- −$0
- Vacancy / Maint / Mgmt
- −$346
- Net cashflow
- $-5
Break-even live
UW: 25.0% down · 7.5% · 30yr · 1.5% tax · 5.0% vac · 8.0% maint · 8.0% mgmt
Financing live
Cash to close
- Down payment
- $48,750
- Closing costs
- $5,850
- Reserves months
- —
- Total cash needed
- —
Loan-product check · same deal, 3 products live
Conventional
25% down · 7.5% · 30yr
- Down + closing
- —
- Monthly P&I
- —
- Monthly cashflow
- —
- DSCR
- —
- Eligible?
- —
Personal DTI + credit; lowest rate.
DSCR
20% down · 8.5% · 30yr
- Down + closing
- —
- Monthly P&I
- —
- Monthly cashflow
- —
- DSCR
- —
- Eligible?
- —
No personal income docs; deal must DSCR.
Hard money
10% down · 12.0% · 12mo
- Down + closing
- —
- Monthly P&I
- —
- Monthly cashflow
- —
- DSCR
- —
- Eligible?
- —
Short-term bridge; refi at stabilization.
Rent comps 1 comps
| Address | Beds | Baths | Sqft | Rent | $/sqft | DOM | Units | Dist |
|---|---|---|---|---|---|---|---|---|
| 383 Fell St Belle Vernon, PA | 2.0 | 2.0 | 1157 | $1,650 | $1.43 | 1d | 1 | 1.12mi |
Listing history 4 events
-
2026-06-18days on market $195,000 Active 3 DOM
-
2026-06-17days on market $195,000 Active 2 DOM
-
2026-06-16remarks 568-char remark
-
2026-06-16$195,000 Active 1 DOM
ⓘ Source: listings_history table (triggers on properties + properties_extension) + one-shot
backfill from property_details.listing_events for pre-trigger history.
Tax reassessment forecast PA · Partial reset (capped growth)
- Current annual tax
- $2,451 · $204/mo
- Projected year-2 tax
- $2,766 · $230/mo
- Expected delta
- +$315/yr (+$26/mo · 12.9%)
ⓘ Screening estimate from a state-policy table — verify with the county assessor before closing.
Climate risk First Street
- Flood 1/10 Low FEMA zone X (unshaded) · 0% chance over 30 yrs
- Wildfire 1/10 Low
- Heat 4/10 Moderate 7 d/yr ≥98°F today · 20 d/yr by 30 yrs out
- Wind 2/10 Low
- Air quality 2/10 Low 1 unhealthy d/yr today · 2 by 30 yrs out
Nearby sold comps map
Loading sold comps map…
Walkable amenities ~0.75 mi
Loading nearby amenities…
Taxation est. · year 1
- Rental income
- $19,800
- − Mortgage interest
- −$10,923
- − Property taxes
- −$2,451
- − Insurance
- −$975
- − Repairs & maintenance
- −$1,584
- − Management
- −$1,584
- − Depreciation
- −$5,673
- Taxable loss
- −$3,390
- Est. tax savings @ 24.0%
- +$814
- After-tax cash flow
- $758/yr
For passive investors: Depreciation is non-cash, so a rental often shows a tax loss while cash-flowing — sheltering income. Rental losses are passive: they offset passive income freely, and up to $25,000/yr can offset ordinary (W-2) income if you actively participate and your MAGI is under $100k (phasing out to $0 by $150k); unused losses carry forward. On sale, claimed depreciation is recaptured at up to 25%, and gains may owe capital-gains tax (a 1031 exchange can defer both). Figures are a year-1 estimate at your 24.0% rate — not tax advice; consult a CPA.
Schools (NCES district)
- District
- Charleroi SD
- NCES district ID
- 4205640
- Math proficiency
- 20% ▼ -19.00%
- Reading proficiency
- 51% ▼ -11.00%
- Median HH income
- $40,410
- Composite
- 29.72/100
- National rank
- #6450
- State rank
- #421 of 539 in PA
Livability — Speers
- Score
- 72/100
- State rank
- #614
- US rank
- #5893
Category grades
Schools grade is shown separately in the Schools card above.
Census & demographics
- Census place
- Speers, PA
- Population (ZIP)
- 10,044
Population outlook (Washington County) Hauer SSP2
- Today (2025)
- 208,060 people
- By 2030
- 207,168 · -0.4%
- By 2040
- 202,738 · -2.6%
- By 2050
- 195,269 · -6.1%
- By 2075
- 175,588 · -15.6%
- By 2100
- 145,827 · -29.9%
Race, ethnicity, and origin ACS 2023
- Neighborhood character
- Predominantly White (87%)
- Race & ethnicity
- White 87% Two or more races 6% Black 6%
- Common ancestry
- Romanian 8% Lithuanian 3% Scotch-Irish 2%
- Foreign-born
- 2% · Canada
- Languages at home
- 98% English-only · Spanish 1%
Political lean MEDSL · Washington
- 2024 margin
- Strong R (+25.5) · D 36.9% · R 62.4%
- 2008→2024 swing
- -20.8pp toward R · 2008: -4.7pp · 2024: -25.5pp
- All cycles
- 2024: R+25.5 2020: R+22.8 2016: R+25.3 2012: R+13.3 2008: R+4.7
Not yet ingested
- Civics
- —
Market trends
- HPI YoY
- ▼ -1.83%
- Current HPI
- 174.218
- Rent YoY
- —
- Metro
- —
- State GDP YoY
- ▲ 1.68%
- F500 in state
- 34
Industry mix (Fortune 500 HQ in PA)
| Industry | F500 HQs | Revenue |
|---|---|---|
| Healthcare | 2 | $309B |
|
||
| Insurance | 2 | $27B |
|
||
| Telecommunications / Media | 1 | $124B |
|
||
| Industrial Distribution | 1 | $22B |
|
||
| Financial Services | 1 | $20B |
|
||
| Chemicals / Materials | 1 | $18B |
|
||
Price history
+200.0% since first listed14 events — show timeline
- 2026-06-12 Listed $195,000 West Penn MLS
- 2014-06-13 Sold (Public Records) $106,500 Public Records
- 2014-05-06 Price Changed $106,500 West Penn MLS
- 2014-05-01 Sold (MLS) $106,500 West Penn MLS
- 2014-05-01 Price Changed $112,000 West Penn MLS
- 2014-02-10 Listed $112,000 West Penn MLS
- 2011-07-08 Sold (Public Records) $88,000 Public Records
- 2010-08-13 Listed $102,500 West Penn MLS
- 2005-09-02 Sold (Public Records) $73,140 Public Records
- 2005-08-29 Sold (MLS) $73,140 West Penn MLS
- 2005-06-28 Listed $73,140 West Penn MLS
- 2003-10-23 Sold (Public Records) $63,000 Public Records
- 2003-10-16 Sold (MLS) $63,000 West Penn MLS
- 2003-09-11 Listed $65,000 West Penn MLS
Property tax history
+6.9%/yrLatest (2026): $2,451 · +3.5% YoY. Source: county tax records.
Cash-flow waterfall
monthlySold comps — $/sqft
last 12 mo · ≤1 miLoading sold comps…