2055 Catalina Dr · Bullhead City, AZ
Flood risk 1/10 · Minimal
- FEMA flood zone
- X (unshaded)
- Chance of flooding over 30 yrs
- 0.0%
- Est. flood insurance / yr
- $507 – $1,088
Fire risk 4/10 · Minor
- Est. fire insurance / yr
- $610 – $1,132
Heat risk 9/10 · Severe
- Hot days now (above 116°F)
- 7 days/yr
- Hot days in 30 yrs
- 16 days/yr
Wind risk 1/10 · Minimal
- Chance of severe wind over 30 yrs
- —
Air-quality risk 1/10 · Minimal
- Unhealthy air days now
- 0 days/yr
- Unhealthy air days in 30 yrs
- 0 days/yr
Risk factors via First Street. Map © Google.
Why this score? — see what drove the B- grade
The composite is a weighted blend of 9 inputs, each scored 0–100. Each bar is that input's sub-score; the figure is the points it added to the 100-point composite (weight × sub-score).
- Cash flow +30.0/30.0
- DSCR +10.0/10.0
- 1% rule +9.8/10.0
- ARV discount +7.5/15.0
- Livability +3.2/5.0
- Condition / age +2.5/5.0
- Rent growth +2.3/5.0
- Schools +1.6/10.0
- Appreciation +0.0/10.0
$79,900
🖨 Deal sheet (PDF) 📄 Offer letter ✓ Due diligence
Listing remarks
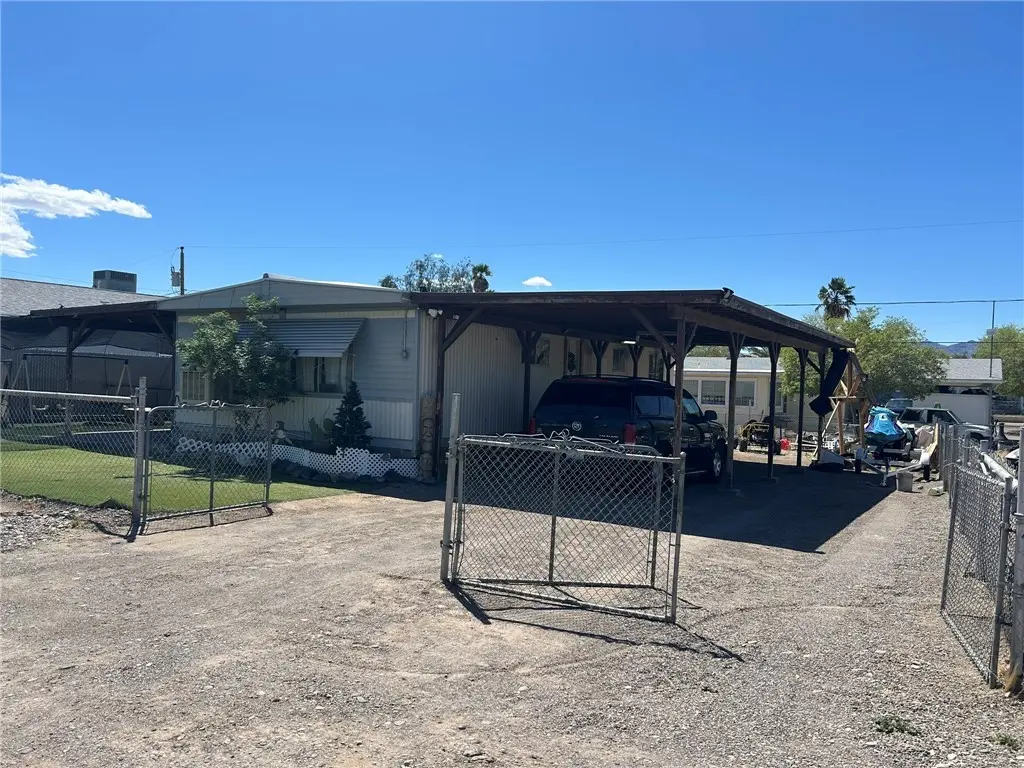
Looking for an investment property? This home is currently rented and the tenants would like to stay, they have been in the house for about 6 years. 2 Bedroom 1 bathroom home on a large lot with 10'+ gates on a fully fenced lot in the heart of Bullhead City. The home has large covered parking and a nice large covered patio to keep you cool on hot days.
Key facts
- Large covered patio
- Fully fenced lot
- 6,534 sq ft lot
Tags
Neighborhood map
What this means for you Summary
Snapshot
- This is a 2-bed/1.0-bath land listed at $80k.
Deal economics
- At list price, monthly cash flow is $461 ($6k/yr) — positive.
- The deal already cash-flows at list — no discount required.
- Meets the 1% rule at list price ($1k rent vs $80k).
- Cap rate 13.2% vs local median 3.7% in Bullhead City — top-decile yield for the area; either an underpriced asset or a hidden risk that comps aren't pricing in. Stress-test before assuming the spread holds.
Location & tenants
- Location reads 64/100 on livability (#103 in AZ) — a middle-class / working-renter tenant base. Strengths: cost of living A+, housing A+; Watch: health & safety C-, employment D, crime D-.
- Bullhead City School District (4378) (town): math 16% / reading 22% proficiency, ranked #189 of 249 in AZ (top 76%) — low school quality limits family demand, transient renter base, plan for 1-2y turnover; 68% free/reduced lunch — lower-income household profile, screen leases tightly.
- Zoned schools: Bullhead City Middle School (math 14% / reading 23%, grade F, #140 of 218 statewide, top 65%, 508 students, 78% FRL); Mohave High School (math 14% / reading 21%, grade F, #245 of 381 statewide, top 65%, 1,175 students, 51% FRL) — zoned schools at 64% FRL track the district average.
- Market conditions: Rents soft (-0.9%/yr); 713 active listings in the ZIP; 33 comparable units currently listed for rent nearby; rentals at typical pace (median 15d on market — plan ~3-4 weeks tenant-placement turnaround); 2,543 units permitted in Mohave County in 2024 (33 in 5+ unit buildings).
Forward outlook
- Local home prices are declining (-3.0%/yr); year-one equity from $552 of loan paydown is wiped out by about $2k of value loss. Plan a longer hold.
- Mohave County population projected to shrink 6% by 2050 — rents likely to lag national; underwrite the cash flow, not the appreciation.
- At projected returns (-3.0% appreciation + 0.0% rent growth), your $22k cash investment doubles in ~6 years — after that, you're playing with house money.
Negotiation context
- Only 3 days on market — expect competitive offers; lowballing is unlikely to land.
Risks & watch-outs
- Climate carrying-cost: extreme-heat days projected 7→16/yr by 2055 (HVAC capex compounding) — expect insurance premiums to compound above CPI over the hold.
Questions for the listing agent
- Built in 1972 — when were the roof, HVAC, electrical panel, plumbing, and water heater last replaced?
- Is there a deadline driving the sale (1031 exchange, divorce, estate, relocation)? That informs how much negotiation room exists.
- Schools are F-rated, which usually means shorter tenancies and higher turnover. Who's the typical renter profile here, and what's been the actual vacancy rate?
- Crime grade is D in this area — have there been break-ins, vandalism, or insurance claims at this property in the last 3 years? What carrier currently insures it and at what premium?
- What's the average days-on-market for RENTAL listings here right now (not sales)? A rising rental-DOM trend means longer vacancies and softer asking-rent achievability than the comps imply.
- What's the recent tenant-quality profile in this submarket — average credit score on applications, eviction rate, late-payment / NSF rate, and stable-employment percentage? A property-management company in the area should have these aggregated.
- How much new for-sale + rental construction is in the pipeline within 1–3 miles? Heavy new supply typically softens prices + rents 12–24 months out; constrained supply supports both.
Investment metrics
- 1% rule
- 1.48% ✓
- Cap rate
- 13.22%
- Cash-on-cash
- 24.73%
- DSCR
- 2.10
- GRM
- 5.6
CMA / ARV
No comps found within radius.
Projected returns pro-forma
-3.0% appreciation · 0.0% rent growth · sell at horizon
- IRR
- 14.9%
- Equity multiple
- 1.58×
- Total profit
- $12,908
- Equity at exit
- $11,913
- IRR
- 21.4%
- Equity multiple
- 2.59×
- Total profit
- $35,494
- Equity at exit
- $6,908
Cash invested: $22,372 (down + closing). Projections, not guarantees.
Landlord ↔ Tenant lean methodology
- Overall (STATE)
- 87 Strongly Landlord-Friendly
- State Arizona
- 87 Strongly Landlord-Friendly · R+3
- County
- — inherits STATE
- City
- — inherits STATE
ZIP-level market 86442
- Home prices YoY
- -27.0%
- Rents YoY
- -0.9%
- Active inventory
- 713
- Price-to-rent
- 5.6×
Monthly cashflow live
- Estimated rent
- $1,186 high interval (Pro) →
- Mortgage (P&I)
- −$419
- Tax from tax record
- −$24 /mo · $286/yr
- Insurance
- −$33
- HOA
- −$0
- Vacancy / Maint / Mgmt
- −$249
- Net cashflow
- $461
Break-even live
Sensitivity live
| Price | -10% $506 | -5% $484 | +0% $461 | +5% $438 | +10% $416 |
|---|---|---|---|---|---|
| Rent | -10% $367 | -5% $414 | +0% $461 | +5% $508 | +10% $555 |
| Rate | -1.0pp $501 | -0.5pp $481 | base $461 | +0.5pp $440 | +1.0pp $419 |
UW: 25.0% down · 7.5% · 30yr · 1.5% tax · 5.0% vac · 8.0% maint · 8.0% mgmt
Financing live
Cash to close
- Down payment
- $19,975
- Closing costs
- $2,397
- Reserves months
- —
- Total cash needed
- —
Loan-product check · same deal, 3 products live
Conventional
25% down · 7.5% · 30yr
- Down + closing
- —
- Monthly P&I
- —
- Monthly cashflow
- —
- DSCR
- —
- Eligible?
- —
Personal DTI + credit; lowest rate.
DSCR
20% down · 8.5% · 30yr
- Down + closing
- —
- Monthly P&I
- —
- Monthly cashflow
- —
- DSCR
- —
- Eligible?
- —
No personal income docs; deal must DSCR.
Hard money
10% down · 12.0% · 12mo
- Down + closing
- —
- Monthly P&I
- —
- Monthly cashflow
- —
- DSCR
- —
- Eligible?
- —
Short-term bridge; refi at stabilization.
Rent comps 33 comps
| Address | Beds | Baths | Sqft | Rent | $/sqft | DOM | Units | Dist |
|---|---|---|---|---|---|---|---|---|
| 2030 Coronado Dr Bullhead City, AZ | 2.0 | 2.0 | 843 | $1,050 | $1.25 | 15d | 1 | 0.41mi |
| 2149 Hermosa Dr Bullhead City, AZ | 2.0 | 1.0 | 765 | $1,250 | $1.63 | 15d | 1 | 0.54mi |
| 644 Swan Dr Bullhead City, AZ | 2.0 | 1.0 | 775 | $1,050 | $1.35 | 15d | 1 | 0.58mi |
| 2175 Riviera Blvd Unit 4 Bullhead City, AZ | 2.0 | 1.0 | 800 | $950 | $1.19 | 15d | 1 | 0.66mi |
| 1235 Navajo Dr Bullhead City, AZ | 2.0 | 1.0 | 800 | $925 | $1.16 | 15d | 1 | 0.75mi |
| 2460 Lakeside Dr Bullhead City, AZ | 2.0 | 2.0 | 1061 | $1,300 | $1.23 | 15d | 1 | 0.77mi |
| 813 Gemstone Ave Bullhead City, AZ | 2.0 | 2.0 | 1000 | $1,200 | $1.20 | 15d | 1 | 0.77mi |
| 1277 Navajo Dr Unit 10 Bullhead City, AZ | 2.0 | 1.0 | 800 | $850 | $1.06 | 15d | 1 | 0.79mi |
| 2081 Diamond Dr Bullhead City, AZ | 2.0 | 2.0 | 720 | $1,050 | $1.46 | 15d | 1 | 0.86mi |
| 2288 Kaibab Dr Bullhead City, AZ | 2.0 | 1.0 | 768 | $1,400 | $1.82 | 15d | 1 | 1.01mi |
| 945 Holly St Bullhead City, AZ | 2.0 | 1.0 | 967 | $1,295 | $1.34 | 15d | 1 | 1.03mi |
| 1645 Palma Cir W Bullhead City, AZ | 2.0 | 1.0 | 682 | $950 | $1.39 | 15d | 1 | 1.10mi |
| 1066 Mobile Ln Bullhead City, AZ | 2.0 | 2.0 | 931 | $1,250 | $1.34 | 15d | 1 | 1.15mi |
| 1190 Ramar Rd Bullhead City, AZ | 1.0–2.0 | 1.0–2.0 | 735 | $1,050 | $1.43 | 22d | 1 | 1.16mi |
| 1190 Ramar Rd Unit C21 Bullhead City, AZ | 2.0 | 2.0 | 858 | $1,200 | $1.40 | 15d | 1 | 1.16mi |
| 1190 Ramar Rd Unit F52 Bullhead City, AZ | 2.0 | 1.0 | 846 | $1,000 | $1.18 | 15d | 1 | 1.16mi |
| 548 Ramar Rd Bullhead City, AZ | 2.0 | 2.0 | 949 | $1,400 | $1.48 | 15d | 1 | 1.18mi |
| 342 Santa Maria Ave Bullhead City, AZ | 3.0 | 2.0 | 1056 | $1,200 | $1.14 | 9d | 1 | 1.22mi |
| 1489 Church Dr Bullhead City, AZ | 1.0 | 1.0 | 672 | $1,100 | $1.64 | 15d | 1 | 1.23mi |
| 1772 Rio Grande Rd Bullhead City, AZ | 2.0 | 1.0 | 823 | $935 | $1.14 | 0d | 5 | 1.25mi |
| 1627 Havasupai Dr Bullhead City, AZ | 1.0 | 1.0 | 980 | $900 | $0.92 | 9d | 1 | 1.28mi |
| 363 Rio Grande Ct Bullhead City, AZ | 2.0 | 2.0 | 940 | $950 | $1.01 | 14d | 1 | 1.29mi |
| 1643 Havasupai Dr Bullhead City, AZ | 2.0 | 2.0 | 878 | $1,011 | $1.15 | 14d | 1 | 1.31mi |
| 346 Rio Grande Ct Bullhead City, AZ | 2.0 | 2.0 | 1030 | $1,200 | $1.17 | 0d | 1 | 1.31mi |
| 546 Roadrunner Dr Bullhead City, AZ | 3.0 | 2.0 | 922 | $1,300 | $1.41 | 15d | 1 | 1.32mi |
| 1280 Mohave Dr Bullhead City, AZ | 2.0 | 1.0 | 819 | $1,149 | $1.40 | 15d | 1 | 1.32mi |
| 1336 Ramar Rd Bullhead City, AZ | 1.0 | 1.0 | 750 | $750 | $1.00 | 9d | 1 | 1.36mi |
| 405 Anna Cir Unit A Bullhead City, AZ | 3.0 | 2.0 | 1076 | $1,350 | $1.25 | 15d | 1 | 1.38mi |
| 370 Riverfront Dr Bullhead City, AZ | 2.0 | 1.0 | 698 | $1,500 | $2.15 | 3d | 1 | 1.42mi |
| 454 Riverfront Dr #105 Bullhead City, AZ | 2.0 | 2.0 | 840 | $1,200 | $1.43 | 15d | 1 | 1.44mi |
| 437 Riverfront Dr Unit 2 Bullhead City, AZ | 2.0 | 1.0 | 682 | $1,400 | $2.05 | 22d | 1 | 1.48mi |
| 437 Riverfront Dr Unit 3 Bullhead City, AZ | 2.0 | 1.5 | 700 | $1,600 | $2.29 | 22d | 1 | 1.48mi |
| 437 Riverfront Dr Unit 4 Bullhead City, AZ | 2.0 | 1.0 | 1080 | $1,650 | $1.53 | 22d | 1 | 1.48mi |
Listing history 3 events
-
2026-05-02status Pending
-
2026-04-04status Pending
-
2026-04-01$79,900 Active
ⓘ Source: listings_history table (triggers on properties + properties_extension) + one-shot
backfill from property_details.listing_events for pre-trigger history.
Tax reassessment forecast AZ · Resets to sale price
- Current annual tax
- $286 · $24/mo
- Projected year-2 tax
- $527 · $44/mo
- Expected delta
- +$241/yr (+$20/mo · 84.2%)
ⓘ Screening estimate from a state-policy table — verify with the county assessor before closing.
Climate risk First Street
- Flood 1/10 Low FEMA zone X (unshaded) · 0% chance over 30 yrs
- Wildfire 4/10 Moderate
- Heat 9/10 Extreme 7 d/yr ≥116°F today · 16 d/yr by 30 yrs out
- Wind 1/10 Low
- Air quality 1/10 Low 0 unhealthy d/yr today · 0 by 30 yrs out
Nearby sold comps map
Loading sold comps map…
Walkable amenities ~0.75 mi
Loading nearby amenities…
Taxation est. · year 1
- Rental income
- $14,235
- − Mortgage interest
- −$4,476
- − Property taxes
- −$286
- − Insurance
- −$400
- − Repairs & maintenance
- −$1,139
- − Management
- −$1,139
- − Depreciation
- −$2,324
- Taxable income
- $4,472
- Est. tax owed @ 24.0%
- −$1,073
- After-tax cash flow
- $4,459/yr
For passive investors: Depreciation is non-cash, so a rental often shows a tax loss while cash-flowing — sheltering income. Rental losses are passive: they offset passive income freely, and up to $25,000/yr can offset ordinary (W-2) income if you actively participate and your MAGI is under $100k (phasing out to $0 by $150k); unused losses carry forward. On sale, claimed depreciation is recaptured at up to 25%, and gains may owe capital-gains tax (a 1031 exchange can defer both). Figures are a year-1 estimate at your 24.0% rate — not tax advice; consult a CPA.
Schools (NCES district)
- District
- Bullhead City School District (4378)
- NCES district ID
- 0401500
- Math proficiency
- 16% ▼ -11.00%
- Reading proficiency
- 22% ▼ -6.00%
- Median HH income
- $37,109
- Composite
- 15.83/100
- National rank
- #9263
- State rank
- #189 of 249 in AZ
Livability — Bullhead City
- Score
- 64/100
- State rank
- #103
- US rank
- #14458
Category grades
Schools grade is shown separately in the Schools card above.
Census & demographics
- Census place
- Bullhead City, AZ
- County
- Mohave County · 181,906 people
- City population
- 43,354
- Metro
- Lake Havasu City-Kingman, AZ
- Population (ZIP)
- 34,735
- Household income
- $48,081
- Rent vs Own
- Severe rent burden
- 1040.0
Population outlook (Mohave County) Hauer SSP2
- Today (2025)
- 209,184 people
- By 2030
- 209,674 · +0.2%
- By 2040
- 205,897 · -1.6%
- By 2050
- 196,810 · -5.9%
- By 2075
- 169,454 · -19.0%
- By 2100
- 136,630 · -34.7%
Race, ethnicity, and origin ACS 2023
- Neighborhood character
- Predominantly White (68%)
- Race & ethnicity
- White 68% Hispanic / Latino 22% Two or more races 12% Black 2% Asian 2%
- Hispanic origin (detail)
- Mexican 19%
- Common ancestry
- Portuguese 3% Romanian 2% Lithuanian 2%
- Foreign-born
- 9% · Canada, South Korea
- Languages at home
- 87% English-only · Spanish 11%
Political lean MEDSL · Mohave
- 2024 margin
- Solid R (+55.8) · D 21.8% · R 77.6%
- 2008→2024 swing
- -22.9pp toward R · 2008: -32.9pp · 2024: -55.8pp
- All cycles
- 2024: R+55.8 2020: R+51.3 2016: R+51.5 2012: R+42.6 2008: R+32.9
Not yet ingested
- Civics
- —
Market trends
- HPI YoY
- ▼ -100.11%
- Current HPI
- 270.3297
- Rent YoY
- ▼ -0.90%
- Metro
- Lake Havasu City-Kingman, AZ
- State GDP YoY
- ▲ 4.54%
- F500 in state
- 20
Industry mix (Fortune 500 HQ in AZ)
| Industry | F500 HQs | Revenue |
|---|---|---|
| Technology | 2 | $13B |
|
||
| Mining / Metals | 1 | $23B |
|
||
| Environmental Services | 1 | $16B |
|
||
| Metals / Steel | 1 | $14B |
|
||
| Technology Distribution | 1 | $9B |
|
||
| Homebuilding | 1 | $8B |
|
||
Price history
3 events — show timeline
- 2026-05-02 Pending — WARDEX
- 2026-04-04 Pending — WARDEX
- 2026-04-01 Listed $79,900 WARDEX
Property tax history
+0.6%/yrLatest (2025): $286 · +3.2% YoY. Source: county tax records.
Cash-flow waterfall
monthlySold comps — $/sqft
last 12 mo · ≤1 miLoading sold comps…