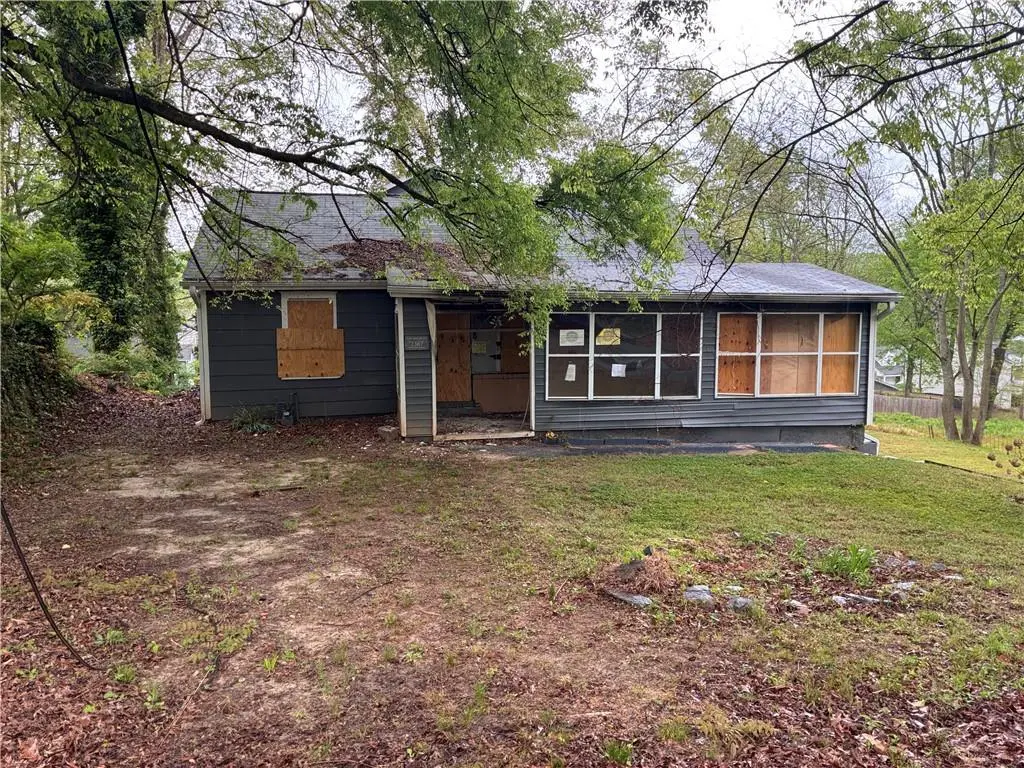
2387 Saint James Dr NW · Atlanta, GA
Flood risk 1/10 · Minimal
- FEMA flood zone
- X (unshaded)
- Chance of flooding over 30 yrs
- 0.0%
- Est. flood insurance / yr
- $473 – $860
Fire risk 1/10 · Minimal
- Est. fire insurance / yr
- $963 – $1,789
Heat risk 5/10 · Moderate
- Hot days now (above 104°F)
- 7 days/yr
- Hot days in 30 yrs
- 17 days/yr
Wind risk 6/10 · Moderate
- Chance of severe wind over 30 yrs
- 27.0%
Air-quality risk 4/10 · Minor
- Unhealthy air days now
- 3 days/yr
- Unhealthy air days in 30 yrs
- 5 days/yr
Risk factors via First Street. Map © Google.
Why this score? — see what drove the B grade
The composite is a weighted blend of 9 inputs, each scored 0–100. Each bar is that input's sub-score; the figure is the points it added to the 100-point composite (weight × sub-score).
- Cash flow +30.0/30.0
- 1% rule +10.0/10.0
- DSCR +10.0/10.0
- ARV discount +7.5/15.0
- Livability +4.2/5.0
- Rent growth +3.3/5.0
- Schools +2.7/10.0
- Condition / age +2.5/5.0
- Appreciation +0.0/10.0
$89,900
🖨 Deal sheet (PDF) 📄 Offer letter ✓ Due diligence
Listing remarks MLS
Prime Development Opportunity in NW Atlanta! Bring your builders and visionaries to this incredible lot located at 2387 Saint James Dr NW. Situated in a rapidly transitioning area, this property is a true tear-down. Perfect for a custom new construction project or a high-end investment hold. Enjoy the benefit of an established neighborhood with easy access to West Midtown and major highways.
Key facts
- Major highways
- 7,405 sq ft lot
- Built 1935
Tags
Neighborhood map
What this means for you Summary
Snapshot
- This is a 5-bed/3.0-bath single-family listed at $90k.
Deal economics
- At list price, monthly cash flow is $1k ($16k/yr) — positive.
- The deal already cash-flows at list — no discount required.
- Meets the 1% rule at list price ($3k rent vs $90k).
- Recommended offer: $85k (6.0% below list) — sets the bar for market timing.
- Cap rate 24.6% vs local median 3.1% in Atlanta — top-decile yield for the area; either an underpriced asset or a hidden risk that comps aren't pricing in. Stress-test before assuming the spread holds.
Location & tenants
- Location reads 83/100 on livability (#6 in GA, #919 nationally) — a professional / high-income tenant draw. Strengths: amenities A+, commute A+, housing A+; Watch: schools C-, cost of living C-.
- Atlanta Public Schools (urban): math 28% / reading 35% proficiency, ranked #80 of 174 in GA (top 46%) — families likely to look elsewhere, expect single-tenant / working-renter base with shorter leases; 71% free/reduced lunch — lower-income household profile, screen leases tightly.
- Market conditions: Rents rising (+3.3%/yr); 722 active listings in the ZIP; 33 comparable units currently listed for rent nearby; rentals at typical pace (median 25d on market — plan ~3-4 weeks tenant-placement turnaround); solid renter incomes; 11,565 units permitted in Fulton County in 2024 (8,159 in 5+ unit buildings).
- This rent runs 41% of the median local income ($83k/yr) — at the standard rent-burdened threshold; future hikes will face affordability resistance.
Forward outlook
- Local home prices are declining (-3.0%/yr); year-one equity from $622 of loan paydown is wiped out by about $3k of value loss. Plan a longer hold.
- Fulton County population projected at +38% by 2050 — long-run rental-demand tailwind backs the buy-and-hold thesis.
- At projected returns (-3.0% appreciation + 3.3% rent growth), your $25k cash investment doubles in ~2 years — after that, you're playing with house money.
Negotiation context
- It's been on market 61 days — a 6% lower offer ($85k) is reasonable based on typical stale-listing flexibility.
- 4 sale attempts; this cycle's ask has dropped $15k (14%) from the opening price — seller is motivated, your offer sets the floor, not the list.
Risks & watch-outs
- Watch-outs: property tax is 4.9% of price; built in 1935 — expect roof / HVAC / electrical / plumbing capex.
- Climate carrying-cost: major wind risk, 27% chance of damaging wind over 30y; extreme-heat days projected 7→17/yr by 2055 (HVAC capex compounding) — expect insurance premiums to compound above CPI over the hold.
Questions for the listing agent
- It's been on market 61 days. Have you received any prior offers? Is the seller open to a 6% concession, seller financing, or rate buy-down credit?
- Built in 1935 — when were the roof, HVAC, electrical panel, plumbing, and water heater last replaced?
- Property tax is high relative to price — has the assessment been appealed recently, and will the sale trigger a re-assessment?
- Why hasn't it sold? Are there any deal-killer items the seller is aware of (foundation, flood, title, zoning, code violations)?
- Is there a deadline driving the sale (1031 exchange, divorce, estate, relocation)? That informs how much negotiation room exists.
- What's the average days-on-market for RENTAL listings here right now (not sales)? A rising rental-DOM trend means longer vacancies and softer asking-rent achievability than the comps imply.
- What's the recent tenant-quality profile in this submarket — average credit score on applications, eviction rate, late-payment / NSF rate, and stable-employment percentage? A property-management company in the area should have these aggregated.
- How much new for-sale + rental construction is in the pipeline within 1–3 miles? Heavy new supply typically softens prices + rents 12–24 months out; constrained supply supports both.
Investment metrics
- 1% rule
- 3.16% ✓
- Cap rate
- 24.56%
- Cash-on-cash
- 65.25%
- DSCR
- 3.90
- GRM
- 2.6
CMA / ARV
- ARV (median comp)
- $407,540
- List price
- $89,900
- Delta
- -77.94%
- Verdict
- UNDERPRICED
- Comps
- 20 within 1.0 mi
Show comp detail 12 sales within ~0.75 mi
| Address | Dist | Beds/Ba | Sqft | Sold | Price | $/sf | Match |
|---|---|---|---|---|---|---|---|
| 1118 Lotus Ave NW | 0.09mi | 4/3.0 (-1) | 1,920 (+3%) | 16mo | $371,000 | $193 | 73 |
| 2353 N Circle Dr NW | 0.11mi | 4/3.0 (-1) | 1,920 (+3%) | 16mo | $385,000 | $201 | 72 |
| 1040 Ada Ave NW | 0.20mi | 4/2.5 (-1) | 1,966 (+5%) | 17mo | $399,900 | $203 | 61 |
| 844 Ridge Ave NW | 0.57mi | 4/2.5 (-1) | 1,887 (+1%) | 15mo | $375,000 | $199 | 53 |
| 864 Capitol View Ave NW | 0.53mi | 4/2.5 (-1) | 1,760 (-6%) | 8mo | $201,000 | $114 | 52 |
| 1070 4th St NW | 0.29mi | 4/2.0 (-1) | 2,132 (+14%) | 4mo | $296,000 | $139 | 50 |
| 2548 Bellview Ave NW | 0.72mi | 4/2.5 (-1) | 1,792 (-4%) | 6mo | $200,000 | $112 | 48 |
| 28 Johnson Rd NW | 0.72mi | 5/4.0 | 1,844 (-1%) | 18mo | $459,900 | $249 | 45 |
| 30 Johnson Rd NW | 0.72mi | 4/3.0 (-1) | 1,739 (-7%) | 7mo | $340,000 | $196 | 44 |
| 2542 Etheridge Dr NW | 0.32mi | 5/3.0 | 1,592 (-15%) | 21mo | $292,500 | $184 | 42 |
| 898 Center Hill Ave NW | 0.44mi | 4/3.0 (-1) | 2,132 (+14%) | 14mo | $350,000 | $164 | 39 |
| 2709 Creek View Ter NW | 0.74mi | 4/3.5 (-1) | 2,129 (+14%) | 12mo | $425,000 | $200 | 26 |
Match score weights: distance 35% · size 25% · config 20% · recency 20%. Top-matched comps best support the ARV.
Projected returns pro-forma
-3.0% appreciation · 3.26% rent growth · sell at horizon
- IRR
- 64.8%
- Equity multiple
- 3.92×
- Total profit
- $73,553
- Equity at exit
- $13,404
- IRR
- 69.3%
- Equity multiple
- 8.16×
- Total profit
- $180,187
- Equity at exit
- $7,773
Cash invested: $25,172 (down + closing). Projections, not guarantees.
Landlord ↔ Tenant lean methodology
- Overall (STATE)
- 90 Strongly Landlord-Friendly
- State Georgia
- 90 Strongly Landlord-Friendly · R+3
- County
- — inherits STATE
- City
- — inherits STATE
ZIP-level market 30318
- Rents YoY
- 3.3%
- Active inventory
- 722
- Price-to-rent
- 2.6×
Monthly cashflow live
- Estimated rent
- $2,842 high interval (Pro) →
- Mortgage (P&I)
- −$471
- Tax from tax record
- −$367 /mo · $4,407/yr
- Insurance
- −$37
- HOA
- −$0
- Vacancy / Maint / Mgmt
- −$597
- Net cashflow
- $1,369
Break-even live
Sensitivity live
| Price | -10% $1,686 | -5% $1,655 | +0% $1,369 | +5% $1,343 | +10% $1,318 |
|---|---|---|---|---|---|
| Rent | -10% $1,144 | -5% $1,256 | +0% $1,369 | +5% $1,481 | +10% $1,593 |
| Rate | -1.0pp $1,414 | -0.5pp $1,392 | base $1,369 | +0.5pp $1,345 | +1.0pp $1,322 |
UW: 25.0% down · 7.5% · 30yr · 1.5% tax · 5.0% vac · 8.0% maint · 8.0% mgmt
Financing live
Cash to close
- Down payment
- $22,475
- Closing costs
- $2,697
- Reserves months
- —
- Total cash needed
- —
Loan-product check · same deal, 3 products live
Conventional
25% down · 7.5% · 30yr
- Down + closing
- —
- Monthly P&I
- —
- Monthly cashflow
- —
- DSCR
- —
- Eligible?
- —
Personal DTI + credit; lowest rate.
DSCR
20% down · 8.5% · 30yr
- Down + closing
- —
- Monthly P&I
- —
- Monthly cashflow
- —
- DSCR
- —
- Eligible?
- —
No personal income docs; deal must DSCR.
Hard money
10% down · 12.0% · 12mo
- Down + closing
- —
- Monthly P&I
- —
- Monthly cashflow
- —
- DSCR
- —
- Eligible?
- —
Short-term bridge; refi at stabilization.
Rent comps 33 comps
| Address | Beds | Baths | Sqft | Rent | $/sqft | DOM | Units | Dist |
|---|---|---|---|---|---|---|---|---|
| 1127 2nd NW Atlanta, GA | 4.0 | 2.5 | 2000 | $3,240 | $1.62 | 15d | 1 | 0.11mi |
| 1127 2nd NW Atlanta, GA | 4.0 | 2.5 | 2000 | $3,240 | $1.62 | 25d | 1 | 0.11mi |
| 2367 Summit Ave NW Atlanta, GA | 4.0 | 2.5 | 1887 | $2,800 | $1.48 | 2d | 1 | 0.14mi |
| 2456 Spring St NW Apt A Atlanta, GA | 4.0 | 2.5 | 1650 | $1,450 | $0.88 | 25d | 1 | 0.18mi |
| 991 Ada Ave NW Atlanta, GA | 4.0 | 2.0 | 1458 | $2,450 | $1.68 | 25d | 1 | 0.31mi |
| 1080 Gun Club Rd NW Atlanta, GA | 5.0 | 3.0 | 2418 | $2,423 | $1.00 | 25d | 1 | 0.52mi |
| 38 Hollywood Dr NW Atlanta, GA | 4.0 | 2.0 | 1400 | $2,200 | $1.57 | 25d | 1 | 0.53mi |
| 854 N Grand Ave NW Atlanta, GA | 4.0 | 2.5 | 1436 | $1,824 | $1.27 | 25d | 1 | 0.56mi |
| 841 Ridge Ave NW Atlanta, GA | 5.0 | 3.0 | 2196 | $2,423 | $1.10 | 21d | 1 | 0.57mi |
| 1120 Wedgewood Dr NW Atlanta, GA | 4.0 | 2.5 | 1904 | $3,100 | $1.63 | 8d | 1 | 0.58mi |
| 2045 Lois Pl NW Unit A Atlanta, GA | 5.0 | 3.0 | 1344 | $3,450 | $2.57 | 19d | 1 | 0.66mi |
| 753 Prince Pl NW Atlanta, GA | 4.0 | 2.0 | 1785 | $2,200 | $1.23 | 25d | 1 | 0.69mi |
| 751 Prince Pl NW Atlanta, GA | 4.0 | 2.0 | 1785 | $2,200 | $1.23 | 25d | 1 | 0.70mi |
| 1445 Creekside Cir NW Atlanta, GA | 4.0 | 3.5 | 2425 | $6,500 | $2.68 | 6d | 1 | 0.70mi |
| 1445 Creekside Cir NW Atlanta, GA | 4.0 | 3.5 | 2425 | $6,500 | $2.68 | 4d | 1 | 0.70mi |
| 739 Prince Pl NW Atlanta, GA | 4.0 | 2.0 | 1903 | $2,200 | $1.16 | 25d | 1 | 0.72mi |
| 740 Prince Pl NW Atlanta, GA | 4.0 | 2.0 | 1903 | $2,200 | $1.16 | 25d | 1 | 0.73mi |
| 738 Prince Pl NW Atlanta, GA | 4.0 | 2.5 | 1903 | $2,250 | $1.18 | 25d | 1 | 0.73mi |
| 2713 Creek View Ter NW Atlanta, GA | 4.0 | 3.5 | 2129 | $2,999 | $1.41 | 8d | 1 | 0.74mi |
| 717 Church St NW Atlanta, GA | 4.0 | 2.0 | 1328 | $2,000 | $1.51 | 25d | 1 | 0.78mi |
| 1955 East Ave NW Unit A Atlanta, GA | 4.0 | 3.0 | 1800 | $1,990 | $1.11 | 15d | 1 | 0.80mi |
| 1026 Sims Ave NW Unit B Atlanta, GA | 4.0 | 3.0 | 1492 | $2,842 | $1.90 | 25d | 1 | 0.80mi |
| 903 Proctor Ranch Dr Unit 903 Atlanta, GA | 4.0 | 3.5 | 2470 | $2,800 | $1.13 | 13d | 1 | 0.91mi |
| 971 Colquitt Pl NW Unit A Atlanta, GA | 4.0 | 3.0 | 1750 | $800 | $0.46 | 25d | 1 | 0.95mi |
| 24 S Eugenia Pl NW Atlanta, GA | 4.0 | 2.5 | 1410 | $1,725 | $1.22 | 25d | 1 | 1.07mi |
| 562 Gary Rd NW Atlanta, GA | 4.0 | 2.0 | 1700 | $2,400 | $1.41 | 25d | 1 | 1.10mi |
| 1647 Bridgeport Dr NW Atlanta, GA | 4.0 | 2.0 | 1250 | $2,100 | $1.68 | 4d | 1 | 1.14mi |
| 2711 Stream Valley Ln NW Atlanta, GA | 4.0 | 3.5 | 2445 | $3,200 | $1.31 | 8d | 1 | 1.15mi |
| 1725 Church St NW Atlanta, GA | 4.0 | 2.0 | 1274 | $2,053 | $1.61 | 21d | 1 | 1.18mi |
| 1409 Northwest Dr NW Unit 1 Atlanta, GA | 4.0 | 2.5 | 2500 | $2,599 | $1.04 | 3d | 1 | 1.18mi |
| 1409 Northwest Dr NW Atlanta, GA | 4.0 | 2.5 | 2000 | $2,998 | $1.50 | 25d | 1 | 1.18mi |
| 7 Edwin Pl NW Atlanta, GA | 4.0 | 2.5 | 2600 | $2,350 | $0.90 | 6d | 1 | 1.21mi |
| 438 Hamilton E Holmes Dr NW Atlanta, GA | 4.0 | 3.0 | 2200 | $5,500 | $2.50 | 25d | 1 | 1.30mi |
Listing history 24 events
-
2026-06-18days on market $89,900 Active 61 DOM
-
2026-06-17pricedays on market $89,900 Active 60 DOM
-
2026-06-16days on market $104,900 Active 59 DOM
-
2026-06-15days on market $104,900 Active 58 DOM
-
2026-06-13days on market $104,900 Active 56 DOM
-
2026-06-13days on market $104,900 Active 55 DOM
-
2026-06-09days on market $104,900 Active 52 DOM
-
2026-06-08days on market $104,900 Active 51 DOM
-
2026-06-07days on market $104,900 Active 50 DOM
-
2026-06-04days on market $104,900 Active 47 DOM
-
2026-06-03days on market $104,900 Active 46 DOM
-
2026-06-02days on market $104,900 Active 45 DOM
-
2026-06-01days on market $104,900 Active 44 DOM
-
2026-05-31days on market $104,900 Active 43 DOM
-
2026-04-17$104,900 New 394-char remark
Show marketing remark (394 chars)
Prime Development Opportunity in NW Atlanta! Bring your builders and visionaries to this incredible lot located at 2387 Saint James Dr NW. Situated in a rapidly transitioning area, this property is a true tear-down. Perfect for a custom new construction project or a high-end investment hold. Enjoy the benefit of an established neighborhood with easy access to West Midtown and major highways.
-
2026-04-17$104,900 Active 394-char remark
Show marketing remark (394 chars)
Prime Development Opportunity in NW Atlanta! Bring your builders and visionaries to this incredible lot located at 2387 Saint James Dr NW. Situated in a rapidly transitioning area, this property is a true tear-down. Perfect for a custom new construction project or a high-end investment hold. Enjoy the benefit of an established neighborhood with easy access to West Midtown and major highways.
-
2025-09-25historical
-
2025-09-25historical
-
2025-08-19price $115,000
-
2025-07-22$130,000 Active
-
2025-07-22$130,000 New
-
2022-04-14soldstatus $210,000
-
2009-06-05soldstatus $135,000
-
1980-12-12soldstatus $9,400
ⓘ Source: listings_history table (triggers on properties + properties_extension) + one-shot
backfill from property_details.listing_events for pre-trigger history.
Tax reassessment forecast GA · Resets to sale price
- Current annual tax
- $4,407 · $367/mo
- Projected year-2 tax
- $4,407 · $367/mo
- Expected delta
- $0/yr ($0/mo · 0.0%)
ⓘ Screening estimate from a state-policy table — verify with the county assessor before closing.
Climate risk First Street
- Flood 1/10 Low FEMA zone X (unshaded) · 0% chance over 30 yrs
- Wildfire 1/10 Low
- Heat 5/10 Major 7 d/yr ≥104°F today · 17 d/yr by 30 yrs out
- Wind 6/10 Major 27% chance of damaging wind over 30 yrs
- Air quality 4/10 Moderate 3 unhealthy d/yr today · 5 by 30 yrs out
Nearby sold comps map
Loading sold comps map…
Walkable amenities ~0.75 mi
Loading nearby amenities…
Taxation est. · year 1
- Rental income
- $34,099
- − Mortgage interest
- −$5,036
- − Property taxes
- −$4,407
- − Insurance
- −$450
- − Repairs & maintenance
- −$2,728
- − Management
- −$2,728
- − Depreciation
- −$2,615
- Taxable income
- $16,136
- Est. tax owed @ 24.0%
- −$3,873
- After-tax cash flow
- $12,552/yr
For passive investors: Depreciation is non-cash, so a rental often shows a tax loss while cash-flowing — sheltering income. Rental losses are passive: they offset passive income freely, and up to $25,000/yr can offset ordinary (W-2) income if you actively participate and your MAGI is under $100k (phasing out to $0 by $150k); unused losses carry forward. On sale, claimed depreciation is recaptured at up to 25%, and gains may owe capital-gains tax (a 1031 exchange can defer both). Figures are a year-1 estimate at your 24.0% rate — not tax advice; consult a CPA.
Schools (NCES district)
- District
- Atlanta Public Schools
- NCES district ID
- 1300120
- Math proficiency
- 28% ▼ -6.00%
- Reading proficiency
- 35% ▼ -2.00%
- Median HH income
- $48,306
- Composite
- 27.27/100
- National rank
- #7006
- State rank
- #80 of 174 in GA
Livability — Atlanta
- Score
- 83/100
- State rank
- #6
- US rank
- #919
Category grades
Schools grade is shown separately in the Schools card above.
Census & demographics
- Census place
- Atlanta, GA
- County
- Fulton County · 1,094,430 people
- City population
- 629,525
- Metro
- Atlanta-Sandy Springs-Alpharetta, GA
- Population (ZIP)
- 59,609
- Household income
- $83,116
- Rent vs Own
- Severe rent burden
- 4182.0
Population outlook (Fulton County) Hauer SSP2
- Today (2025)
- 1,203,707 people
- By 2030
- 1,299,706 · +8.0%
- By 2040
- 1,488,256 · +23.6%
- By 2050
- 1,664,580 · +38.3%
- By 2075
- 2,036,072 · +69.2%
- By 2100
- 2,222,402 · +84.6%
Race, ethnicity, and origin ACS 2023
- Neighborhood character
- Diverse neighborhood (Simpson 0.63)
- Race & ethnicity
- Black 49% White 35% Hispanic / Latino 7% Two or more races 6% Asian 5%
- Hispanic origin (detail)
- Mexican 2% Puerto Rican 1%
- Common ancestry
- Lithuanian 2% Slovak 2% Romanian 1%
- Foreign-born
- 8% · Canada, China, South Korea
- Languages at home
- 88% English-only · Spanish 4% Other Indo-European 2% Other Asian/Pacific 1%
Political lean MEDSL · Fulton
- 2024 margin
- Solid D (+44.9) · D 71.9% · R 27.0% · Other 1.1%
- 2008→2024 swing
- +9.8pp toward D · 2008: 35.0pp · 2024: 44.9pp
- All cycles
- 2024: D+44.9 2020: D+46.4 2016: D+42.1 2012: D+29.6 2008: D+35.0
Not yet ingested
- Civics
- —
Market trends
- HPI YoY
- ▼ -470.82%
- Current HPI
- 224.1493
- Rent YoY
- ▲ 3.26%
- Metro
- Atlanta-Sandy Springs-Alpharetta, GA
- State GDP YoY
- ▲ 2.66%
- F500 in state
- 28
Industry mix (Fortune 500 HQ in GA)
| Industry | F500 HQs | Revenue |
|---|---|---|
| Paper / Packaging | 2 | $29B |
|
||
| Retail | 1 | $160B |
|
||
| Transportation / Logistics | 1 | $91B |
|
||
| Airlines | 1 | $62B |
|
||
| Consumer Goods | 1 | $47B |
|
||
| Utilities | 1 | $25B |
|
||
Price history
+1016.0% since first listed10 events — show timeline
- 2026-04-17 Listed $104,900 FMLS
- 2026-04-17 Listed $104,900 GAMLS
- 2025-09-25 Listing Removed — GAMLS
- 2025-09-25 Listing Removed — FMLS
- 2025-08-19 Price Changed $115,000 FMLS
- 2025-07-22 Listed $130,000 GAMLS
- 2025-07-22 Listed $130,000 FMLS
- 2022-04-14 Sold (Public Records) $210,000 Public Records
- 2009-06-05 Sold (Public Records) $135,000 Public Records
- 1980-12-12 Sold (Public Records) $9,400 Public Records
Property tax history
+11.8%/yrLatest (2025): $4,407 · +4.0% YoY. Source: county tax records.
Cash-flow waterfall
monthlySold comps — $/sqft
last 12 mo · ≤1 miLoading sold comps…