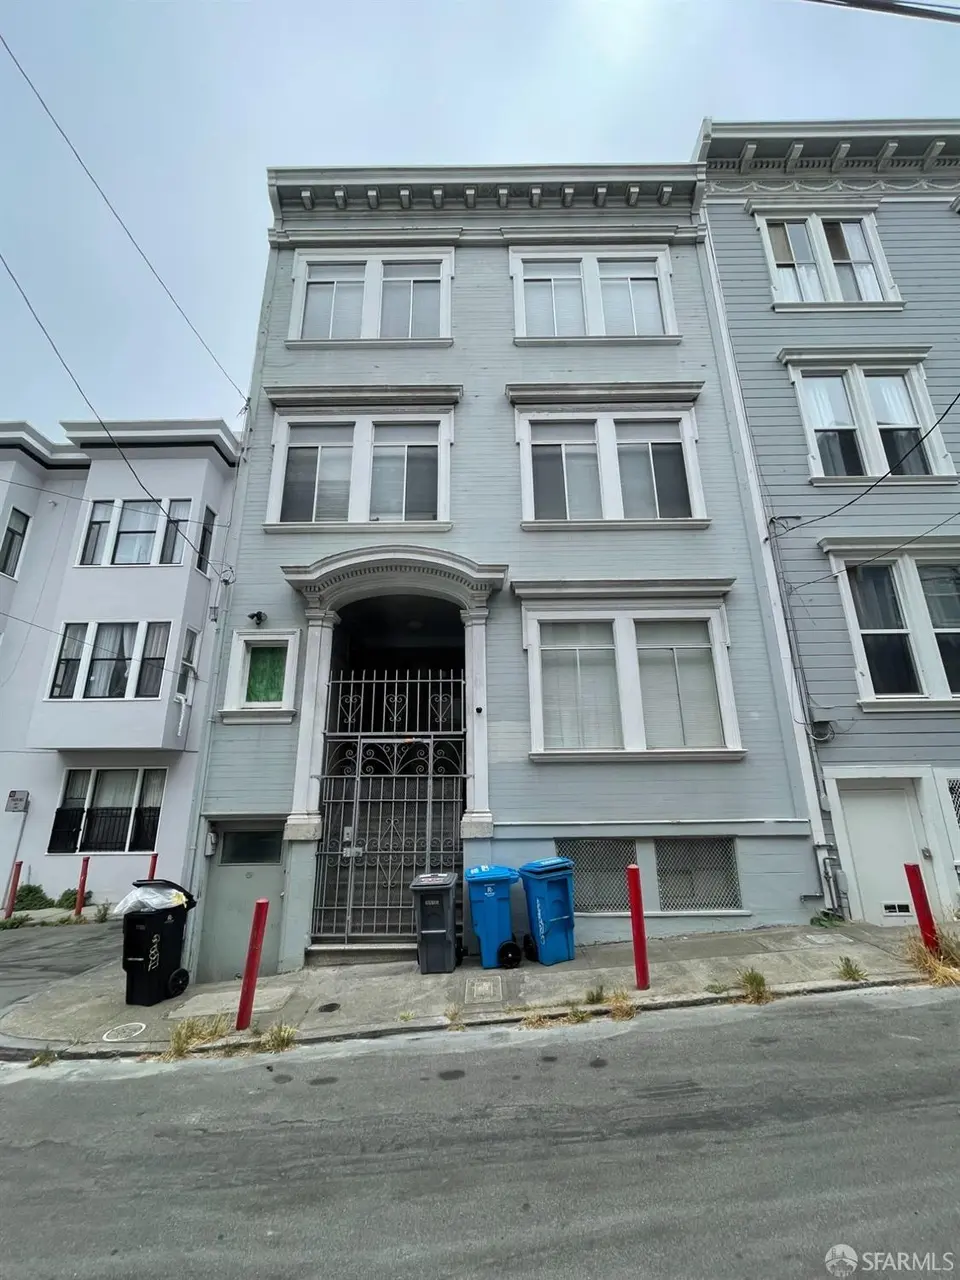
 Triplex
42-46 Wayne Pl · San Francisco, CA
Flood risk 1/10 · Minimal
- FEMA flood zone
- X (unshaded)
- Chance of flooding over 30 yrs
- 0.0%
- Est. flood insurance / yr
- $473 – $860
Fire risk 1/10 · Minimal
- Est. fire insurance / yr
- $659 – $1,223
Heat risk 2/10 · Minimal
- Hot days now (above 79°F)
- 7 days/yr
- Hot days in 30 yrs
- 16 days/yr
Wind risk 1/10 · Minimal
- Chance of severe wind over 30 yrs
- —
Air-quality risk 8/10 · Major
- Unhealthy air days now
- 15 days/yr
- Unhealthy air days in 30 yrs
- 15 days/yr
Risk factors via First Street. Map © Google.
Why this score? — see what drove the C- grade
The composite is a weighted blend of 9 inputs, each scored 0–100. Each bar is that input's sub-score; the figure is the points it added to the 100-point composite (weight × sub-score).
- Cash flow +16.9/30.0
- Appreciation +8.2/10.0
- DSCR +5.2/10.0
- Rent growth +5.0/5.0
- Schools +5.0/10.0
- 1% rule +4.6/10.0
- Livability +3.8/5.0
- Condition / age +2.5/5.0
- ARV discount +0.0/15.0
$1,850,000
🖨 Deal sheet (PDF) 📄 Offer letter ✓ Due diligence
Multi-family units
County records classify this as Multi-Family (2-4 Unit). Listing-text estimate: 3 units. confirmed
Listing remarks
42-46 Wayne Place is a well-maintained three-flat apartment building located in the heart of North Beach / Chinatown. The property consists of 2 two-bedroom flats and 1 three-bedroom flat. Flats have been lightly renovated and feature modern kitchens. The property benefits from low operating expenses, with separately metered gas and electrical systems. Additional features include a small ground-floor storage or office space and on-site coin-operated laundry. Located just one block from the cable car line, the property offers strong rental income, and upside from future renovations and ADU development.
Key facts
- Modern kitchens
- Ground-floor storage
- Strong rental income
Tags
Property features AI
Finance
- HOA & community: No association fee
Exterior
- Home design: Residential income property (Triplex); Built in 1913
- Construction: Building area approximately 3,104 sq ft
- Exterior features: Lot approximately 1,398 sq ft
Interior
- Interior features: Three-unit building; Two units are flats
Neighborhood map
What this means for you Summary
Snapshot
- This is a 2×2bd/1ba + 1×3bd/1ba units multifamily listed at $1.85M.
Deal economics
- At list price, monthly cash flow is $1k ($14k/yr) — positive. Per door: $401/mo.
- The deal already cash-flows at list — no discount required.
- To meet the 1% rule (rent ≥ 1% of price), the offer needs to be $1.77M (4.3% below list).
- Recommended offer: $1.77M (4.3% below list) — sets the bar for 1% rule.
- Cap rate 7.1% vs local median 2.1% in San Francisco — top-decile yield for the area; either an underpriced asset or a hidden risk that comps aren't pricing in. Stress-test before assuming the spread holds.
Location & tenants
- Location reads 76/100 on livability (#90 in CA, #3,143 nationally) — a middle-class / working-renter tenant base. Strengths: amenities A+, commute A+, employment A+; Watch: crime F, cost of living F.
- San Francisco Unified (urban): math 50% / reading 56% proficiency, ranked #322 of 1,400 in CA (top 23%) — acceptable for families but not a draw, mixed tenant base, ~2y average lease.
- Zoned schools: Lilienthal (Claire) Elementary (669 students, 19% FRL); Giannini (A.P.) Middle (1,192 students, 34% FRL); Lowell High (2,632 students, 37% FRL) — zoned schools average 30% FRL vs 49% district-wide (19 pts lower); this property's tenant base skews higher-income than the district average.
- Market conditions: Rents rising fast (+16.9%/yr); 61 active listings in the ZIP; 2 comparable units currently listed for rent nearby; solid renter incomes; 750 units permitted in San Francisco County in 2024 (688 in 5+ unit buildings).
- At $17,707/mo this rent would consume 244% of the median local household income ($87k/yr) (locally 2027% of renters already pay >50% of income on rent) — very limited rent-growth headroom before tenants either downsize or default.
Forward outlook
- In year one you build about $132k of equity ($13k loan paydown + $119k appreciation (6.4% local appreciation)).
- San Francisco County population projected at +39% by 2050 — long-run rental-demand tailwind backs the buy-and-hold thesis.
- At projected returns (6.4% appreciation + 8.0% rent growth), your $518k cash investment doubles in ~4 years — after that, you're playing with house money.
- By year 2, paydown + projected appreciation supports a ~$211k cash-out refi (75% LTV) — recoverable capital for the next deal without selling this one.
Negotiation context
- It's been on market 44 days — a 3% lower offer ($1.79M) is reasonable based on typical stale-listing flexibility.
Risks & watch-outs
- Watch-outs: built in 1913 — expect roof / HVAC / electrical / plumbing capex.
Questions for the listing agent
- It's been on market 44 days. Have you received any prior offers? Is the seller open to a 4% concession, seller financing, or rate buy-down credit?
- Can we see the unit-by-unit rent roll, current vacancy, and any below-market leases? What's the average tenancy length?
- What capital expenditures (roof, boiler, parking lot, exteriors) have been made in the last 5 years, and what's planned in the next 2?
- Built in 1913 — when were the roof, HVAC, electrical panel, plumbing, and water heater last replaced?
- Is there a deadline driving the sale (1031 exchange, divorce, estate, relocation)? That informs how much negotiation room exists.
- Schools are B-rated — typically a magnet for longer-tenancy family renters. What's the average tenant stay here, and is there a school-zone premium baked into asking?
- Crime grade is F in this area — have there been break-ins, vandalism, or insurance claims at this property in the last 3 years? What carrier currently insures it and at what premium?
- What's the average days-on-market for RENTAL listings here right now (not sales)? A rising rental-DOM trend means longer vacancies and softer asking-rent achievability than the comps imply.
- What's the recent tenant-quality profile in this submarket — average credit score on applications, eviction rate, late-payment / NSF rate, and stable-employment percentage? A property-management company in the area should have these aggregated.
- How much new apartment / multifamily construction is in the pipeline within 1–3 miles? Heavy new supply (>2% of stock underway) typically softens rents 12–24 months out; light construction supports rent growth.
Investment metrics
- 1% rule
- 0.96% ✗
- Cap rate
- 7.07%
- Cash-on-cash
- 2.79%
- DSCR
- 1.12
- GRM
- 8.7
CMA / ARV
- ARV (median comp)
- $1,450,743
- List price
- $1,850,000
- Delta
- 27.52%
- Verdict
- OVERPRICED
- Comps
- 20 within 1.0 mi
Show comp detail 12 sales within ~0.75 mi
| Address | Dist | Beds/Ba | Sqft | Sold | Price | $/sf | Match |
|---|---|---|---|---|---|---|---|
| 1312-1314 Powell St | 0.06mi | 6/3.0 | 3,215 (+4%) | 4mo | $1,650,000 | $513 | 88 |
| 82-86 Valparaiso St | 0.35mi | 5/3.0 | 3,000 (-3%) | 1mo | $1,425,000 | $475 | 77 |
| 1100 Clay St | 0.23mi | 3/— | 3,390 (+9%) | 1mo | $2,040,000 | $602 | 74 |
| 7 Varennes St | 0.31mi | 5/— | 2,940 (-5%) | 6mo | $1,050,000 | $357 | 71 |
| 117-119 Trenton St | 0.11mi | 4/4.0 | 2,640 (-15%) | 2mo | $930,000 | $352 | 68 |
| 1162-1164 Vallejo St | 0.31mi | 6/— | 2,890 (-7%) | 9mo | $2,750,000 | $952 | 66 |
| 17-19 Card Aly | 0.16mi | 6/3.0 | 2,649 (-15%) | 4mo | $2,500,000 | $944 | 65 |
| 33 - 37 Glover St | 0.28mi | 5/1.0 | 2,678 (-14%) | 1mo | $1,950,000 | $728 | 63 |
| 822-824 Union St | 0.25mi | 6/4.0 | 2,767 (-11%) | 9mo | $3,500,000 | $1,265 | 63 |
| 301 Green St | 0.41mi | 6/4.0 | 2,908 (-6%) | 12mo | $1,796,850 | $618 | 61 |
| 168-170 Bernard St | 0.30mi | 7/3.0 | 2,724 (-12%) | 9mo | $1,800,000 | $661 | 58 |
| 1358-1360 Union St | 0.61mi | 5/— | 3,333 (+7%) | 9mo | $3,550,000 | $1,065 | 52 |
Match score weights: distance 35% · size 25% · config 20% · recency 20%. Top-matched comps best support the ARV.
Projected returns pro-forma
6.44% appreciation · 8.0% rent growth · sell at horizon
- IRR
- 20.9%
- Equity multiple
- 2.45×
- Total profit
- $753,384
- Equity at exit
- $1,214,842
- IRR
- 21.8%
- Equity multiple
- 5.59×
- Total profit
- $2,377,084
- Equity at exit
- $2,249,266
Cash invested: $518,000 (down + closing). Projections, not guarantees.
Landlord ↔ Tenant lean methodology
- Overall (CITY)
- 0 Strongly Tenant-Friendly
- State California
- 18 Strongly Tenant-Friendly · D+13
- County
- — inherits STATE
- City San Francisco
- 0 Strongly Tenant-Friendly · D+57
ZIP-level market 94133
- Home prices YoY
- 4.0%
- Rents YoY
- 16.9%
- Active inventory
- 61
- Price-to-rent
- 27.0×
Monthly cashflow live
- Estimated rent
- $17,707 high interval (Pro) →
- Mortgage (P&I)
- −$9,702
- Tax est. 1.5%
- −$2,312 /mo · $27,750/yr
- Insurance
- −$771
- HOA
- −$0
- Vacancy / Maint / Mgmt
- −$3,718
- Net cashflow
- $1,204
Break-even live
Sensitivity live
| Price | -10% $2,482 | -5% $1,843 | +0% $1,204 | +5% $564 | +10% $-75 |
|---|---|---|---|---|---|
| Rent | -10% $-195 | -5% $504 | +0% $1,204 | +5% $1,903 | +10% $2,602 |
| Rate | -1.0pp $2,135 | -0.5pp $1,674 | base $1,204 | +0.5pp $724 | +1.0pp $237 |
3-unit breakdown (identical units grouped — click to expand)
| Units | Beds | Baths | Est. rent |
|---|---|---|---|
| 2× units | 2 | 1 | $11,402 |
| #1 | 2 | 1 | $5,701 |
| #2 | 2 | 1 | $5,701 |
| 1× unit | 3 | 1 | $6,305 |
| Total (3 units) | $17,707 | ||
UW: 25.0% down · 7.5% · 30yr · 1.5% tax · 5.0% vac · 8.0% maint · 8.0% mgmt
Financing live
Cash to close
- Down payment
- $462,500
- Closing costs
- $55,500
- Reserves months
- —
- Total cash needed
- —
Loan-product check · same deal, 3 products live
Conventional
25% down · 7.5% · 30yr
- Down + closing
- —
- Monthly P&I
- —
- Monthly cashflow
- —
- DSCR
- —
- Eligible?
- —
Personal DTI + credit; lowest rate.
DSCR
20% down · 8.5% · 30yr
- Down + closing
- —
- Monthly P&I
- —
- Monthly cashflow
- —
- DSCR
- —
- Eligible?
- —
No personal income docs; deal must DSCR.
Hard money
10% down · 12.0% · 12mo
- Down + closing
- —
- Monthly P&I
- —
- Monthly cashflow
- —
- DSCR
- —
- Eligible?
- —
Short-term bridge; refi at stabilization.
Rent comps 2 comps
| Address | Beds | Baths | Sqft | Rent | $/sqft | DOM | Units | Dist |
|---|---|---|---|---|---|---|---|---|
| 1107 Broadway Unit 1309749P San Francisco, CA | 3.0 | 1.5 | 2142 | $17,588 | $8.21 | 25d | 1 | 0.24mi |
| 39 Tehama St San Francisco, CA | 1.0–2.0 | 1.0–2.0 | 1291 | $20,493 | $15.87 | 0d | 13 | 1.05mi |
Listing history 24 events
-
2026-06-21days on market $1,850,000 Active 44 DOM
-
2026-06-18days on market $1,850,000 Active 41 DOM
-
2026-06-17days on market $1,850,000 Active 40 DOM
-
2026-06-16days on market $1,850,000 Active 39 DOM
-
2026-06-15days on market $1,850,000 Active 38 DOM
-
2026-06-13days on market $1,850,000 Active 36 DOM
-
2026-06-13days on market $1,850,000 Active 35 DOM
-
2026-06-09days on market $1,850,000 Active 32 DOM
-
2026-06-08days on market $1,850,000 Active 31 DOM
-
2026-06-07days on market $1,850,000 Active 30 DOM
-
2026-06-04days on market $1,850,000 Active 27 DOM
-
2026-06-03days on market $1,850,000 Active 26 DOM
-
2026-06-02days on market $1,850,000 Active 25 DOM
-
2026-06-01days on market $1,850,000 Active 24 DOM
-
2026-05-31days on market $1,850,000 Active 23 DOM
-
2026-05-08$1,850,000 Active 608-char remark
-
2016-06-24soldstatus $1,795,000 251-char remark
-
2016-06-24soldstatus $1,795,000 Sold
-
2016-06-10status Pending (Do Not Show)
-
2016-05-20historical Contingent
-
2016-04-08$1,950,000 Active
-
2016-04-08$1,950,000 251-char remark
-
2016-02-08historical
-
2015-10-01$1,998,000
ⓘ Source: listings_history table (triggers on properties + properties_extension) + one-shot
backfill from property_details.listing_events for pre-trigger history.
Climate risk First Street
- Flood 1/10 Low FEMA zone X (unshaded) · 0% chance over 30 yrs
- Wildfire 1/10 Low
- Heat 2/10 Low 7 d/yr ≥79°F today · 16 d/yr by 30 yrs out
- Wind 1/10 Low
- Air quality 8/10 Severe 15 unhealthy d/yr today · 15 by 30 yrs out
Nearby sold comps map
Loading sold comps map…
Walkable amenities ~0.75 mi
Loading nearby amenities…
Taxation est. · year 1
- Rental income
- $212,484
- − Mortgage interest
- −$103,629
- − Property taxes
- −$27,750
- − Insurance
- −$9,250
- − Repairs & maintenance
- −$16,999
- − Management
- −$16,999
- − Depreciation
- −$53,818
- Taxable loss
- −$15,960
- Est. tax savings @ 24.0%
- +$3,830
- After-tax cash flow
- $18,274/yr
For passive investors: Depreciation is non-cash, so a rental often shows a tax loss while cash-flowing — sheltering income. Rental losses are passive: they offset passive income freely, and up to $25,000/yr can offset ordinary (W-2) income if you actively participate and your MAGI is under $100k (phasing out to $0 by $150k); unused losses carry forward. On sale, claimed depreciation is recaptured at up to 25%, and gains may owe capital-gains tax (a 1031 exchange can defer both). Figures are a year-1 estimate at your 24.0% rate — not tax advice; consult a CPA.
Schools (NCES district)
- District
- San Francisco Unified
- NCES district ID
- 0634410
- Math proficiency
- 50% ▬ 0.00%
- Reading proficiency
- 56% ▲ 1.00%
- Median HH income
- $81,249
- Composite
- 50.14/100
- National rank
- #4088
- State rank
- #322 of 1400 in CA
Livability — San Francisco
- Score
- 76/100
- State rank
- #90
- US rank
- #3143
Category grades
Schools grade is shown separately in the Schools card above.
Census & demographics
- Census place
- San Francisco, CA
- County
- San Francisco County · 827,552 people
- City population
- 827,552
- Metro
- San Francisco-Oakland-Berkeley, CA
- Population (ZIP)
- 23,804
- Household income
- $87,191
- Rent vs Own
- Severe rent burden
- 2027.0
Population outlook (San Francisco County) Hauer SSP2
- Today (2025)
- 1,030,936 people
- By 2030
- 1,110,409 · +7.7%
- By 2040
- 1,270,010 · +23.2%
- By 2050
- 1,435,001 · +39.2%
- By 2075
- 1,779,074 · +72.6%
- By 2100
- 1,966,767 · +90.8%
Race, ethnicity, and origin ACS 2023
- Neighborhood character
- Diverse neighborhood (Simpson 0.65)
- Race & ethnicity
- Asian 48% White 34% Hispanic / Latino 11% Two or more races 9% Black 3%
- Hispanic origin (detail)
- Mexican 5%
- Common ancestry
- Romanian 3% Slovak 2% Lithuanian 2%
- Foreign-born
- 40% · China, Canada, South Korea
- Languages at home
- 53% English-only · Chinese 34% Spanish 5% Other Indo-European 3%
Political lean MEDSL · San Francisco
- 2024 margin
- Solid D (+64.8) · D 80.3% · R 15.5% · Other 4.1%
- 2008→2024 swing
- -5.7pp toward R · 2008: 70.5pp · 2024: 64.8pp
- All cycles
- 2024: D+64.8 2020: D+72.5 2016: D+76.1 2012: D+70.2 2008: D+70.5
Not yet ingested
- Civics
- —
Market trends
- HPI YoY
- ▲ 6.44%
- Current HPI
- 168.565
- Rent YoY
- ▲ 16.95%
- Metro
- San Francisco-Oakland-Berkeley, CA
- State GDP YoY
- ▲ 3.21%
- F500 in state
- 116
Industry mix (Fortune 500 HQ in CA)
| Industry | F500 HQs | Revenue |
|---|---|---|
| Technology | 27 | $1,492B |
|
||
| Financial Services | 3 | $174B |
|
||
| Retail | 3 | $44B |
|
||
| Insurance | 3 | $26B |
|
||
| Media / Entertainment | 2 | $115B |
|
||
| Pharmaceuticals / Biotech | 2 | $62B |
|
||
Price history
1 event — show timeline
- 2026-05-08 Listed $1,850,000 San Francisco MLS
Cash-flow waterfall
monthlySold comps — $/sqft
last 12 mo · ≤1 miLoading sold comps…