 🏷️ Likely Rental
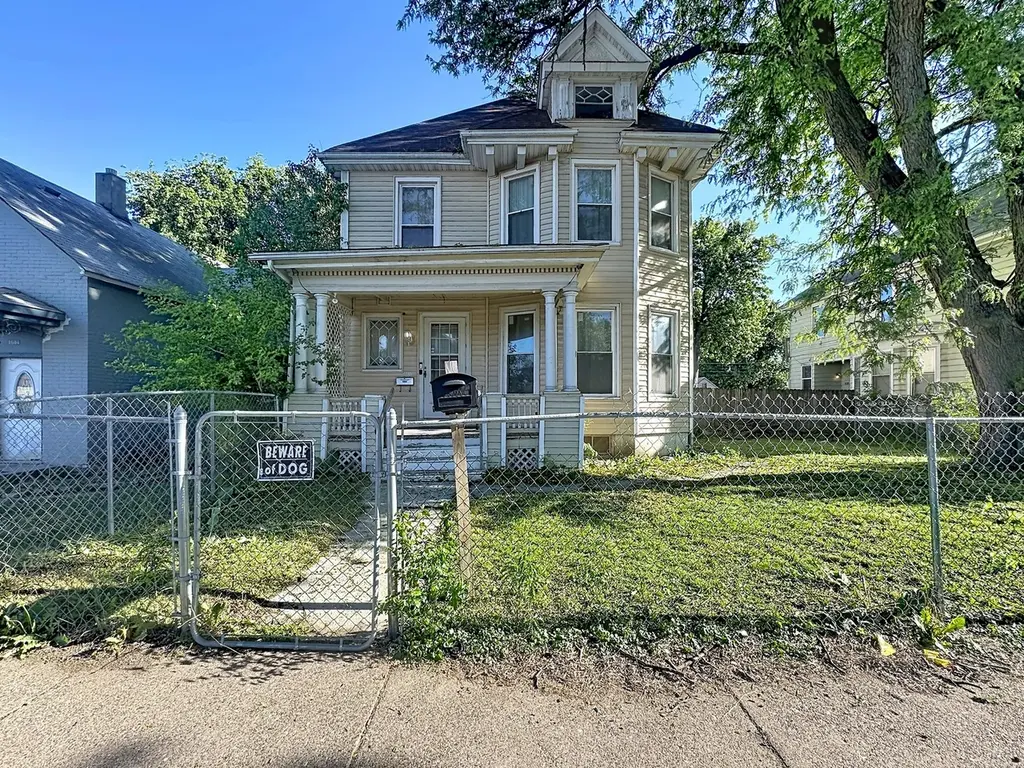
1640 W 3rd St · Davenport, IA
Flood risk 1/10 · Minimal
- FEMA flood zone
- X (unshaded)
- Chance of flooding over 30 yrs
- 0.0%
- Est. flood insurance / yr
- $473 – $860
Fire risk 1/10 · Minimal
- Est. fire insurance / yr
- $902 – $1,676
Heat risk 3/10 · Minor
- Hot days now (above 104°F)
- 7 days/yr
- Hot days in 30 yrs
- 16 days/yr
Wind risk 2/10 · Minimal
- Chance of severe wind over 30 yrs
- —
Air-quality risk 3/10 · Minor
- Unhealthy air days now
- 2 days/yr
- Unhealthy air days in 30 yrs
- 3 days/yr
Risk factors via First Street. Map © Google.
Why this score? — see what drove the B grade
The composite is a weighted blend of 9 inputs, each scored 0–100. Each bar is that input's sub-score; the figure is the points it added to the 100-point composite (weight × sub-score).
- Cash flow +26.2/30.0
- ARV discount +15.0/15.0
- DSCR +8.9/10.0
- 1% rule +7.5/10.0
- Livability +4.0/5.0
- Schools +3.9/10.0
- Rent growth +2.5/5.0
- Condition / age +2.5/5.0
- Appreciation +0.0/10.0
$110,000
🖨 Deal sheet 📄 Offer letter ✓ Due diligence
Listing remarks MLS
4-bed, 1.5-bath home in Davenport offering over 2,000 sq. ft. of finished space and filled with original character. This 2-story home features hardwood floors, original trim, and classic interior doors that highlight its timeless style. The main level includes a living room, dining room, kitchen, bathroom, and the primary bedroom for convenient main-floor living. Upstairs, three additional bedrooms and a second bathroom provide plenty of space. The unfinished attic offers potential for additional finished space such as a large primary suite or rec room. Outside, the property includes a fenced backyard with a large deck, along with a detached 3-car garage and a storage shed that stays with the home. The property was previously tenant occupied, with the most recent tenant paying $1,525 per month in rent. Schedule your showing today to see everything this Davenport home has to offer.
Key facts
- Large deck
- Original trim
- Fenced backyard
Tags
Neighborhood map
What this means for you Summary
Snapshot
- This is a 3-bed/1.5-bath single-family listed at $110k.
Deal economics
- At list price, monthly cash flow is $282 ($3k/yr) — positive.
- The deal already cash-flows at list — no discount required.
- Meets the 1% rule at list price ($1k rent vs $110k).
- Recommended offer: $100k (9.0% below list) — sets the bar for market timing.
- Cap rate 9.4% vs local median 4.4% in Davenport — top-decile yield for the area; either an underpriced asset or a hidden risk that comps aren't pricing in. Stress-test before assuming the spread holds.
Location & tenants
- Location reads 79/100 on livability (#126 in IA, #2,312 nationally) — a middle-class / working-renter tenant base. Strengths: cost of living A+, housing A+, health & safety A+; Watch: employment C-, crime F.
- Davenport Community School District (urban): math 43% / reading 50% proficiency, ranked #288 of 289 in IA (top 100%) — families likely to look elsewhere, expect single-tenant / working-renter base with shorter leases.
- Market conditions: 68 active listings in the ZIP; 6 comparable units currently listed for rent nearby; rentals at typical pace (median 21d on market — plan ~3-4 weeks tenant-placement turnaround); 805 units permitted in Scott County in 2024 (479 in 5+ unit buildings).
- This rent runs 30% of the median local income ($54k/yr) — at the standard rent-burdened threshold; future hikes will face affordability resistance.
Forward outlook
- Local home prices are declining (-3.0%/yr); year-one equity from $761 of loan paydown is wiped out by about $3k of value loss. Plan a longer hold.
- Scott County population projected at +19% by 2050 — long-run rental-demand tailwind backs the buy-and-hold thesis.
- At projected returns (-3.0% appreciation + 3.0% rent growth), your $31k cash investment doubles in ~10 years — after that, you're playing with house money.
Negotiation context
- It's been on market 93 days — a 9% lower offer ($100k) is reasonable based on typical stale-listing flexibility.
- 3 sale attempts since 18y ago; this cycle's ask has dropped $10k (8%) from the opening price — seller is motivated, your offer sets the floor, not the list.
Risks & watch-outs
- Watch-outs: built in 1905 — expect roof / HVAC / electrical / plumbing capex.
Questions for the listing agent
- It's been on market 93 days. Have you received any prior offers? Is the seller open to a 9% concession, seller financing, or rate buy-down credit?
- Built in 1905 — when were the roof, HVAC, electrical panel, plumbing, and water heater last replaced?
- Why hasn't it sold? Are there any deal-killer items the seller is aware of (foundation, flood, title, zoning, code violations)?
- Is there a deadline driving the sale (1031 exchange, divorce, estate, relocation)? That informs how much negotiation room exists.
- Crime grade is F in this area — have there been break-ins, vandalism, or insurance claims at this property in the last 3 years? What carrier currently insures it and at what premium?
- What's the average days-on-market for RENTAL listings here right now (not sales)? A rising rental-DOM trend means longer vacancies and softer asking-rent achievability than the comps imply.
- What's the recent tenant-quality profile in this submarket — average credit score on applications, eviction rate, late-payment / NSF rate, and stable-employment percentage? A property-management company in the area should have these aggregated.
- How much new for-sale + rental construction is in the pipeline within 1–3 miles? Heavy new supply typically softens prices + rents 12–24 months out; constrained supply supports both.
Investment metrics
- 1% rule
- 1.25% ✓
- Cap rate
- 9.37%
- Cash-on-cash
- 10.98%
- DSCR
- 1.49
- GRM
- 6.7
CMA / ARV
- ARV (median comp)
- $150,590
- List price
- $110,000
- Delta
- -26.95%
- Verdict
- UNDERPRICED
- Comps
- 19 within 1.0 mi
Show comp detail 3 sales within ~0.75 mi
| Address | Dist | Beds/Ba | Sqft | Sold | Price | $/sf | Match |
|---|---|---|---|---|---|---|---|
| 1819 W 6th St | 0.22mi | 3/1.0 | 2,054 (-8%) | 2mo | $127,000 | $62 | 73 |
| 2218 Newberry St | 0.67mi | 3/1.5 | 2,228 (-0%) | 0mo | $255,000 | $114 | 68 |
| 817 Marquette St | 0.66mi | 4/2.0 (+1) | 2,144 (-4%) | 4mo | $130,000 | $61 | 52 |
Match score weights: distance 35% · size 25% · config 20% · recency 20%. Top-matched comps best support the ARV.
Projected returns pro-forma
-3.0% appreciation · 3.0% rent growth · sell at horizon
- IRR
- 0.1%
- Equity multiple
- 1.01×
- Total profit
- $166
- Equity at exit
- $16,401
- IRR
- 9.8%
- Equity multiple
- 1.76×
- Total profit
- $23,441
- Equity at exit
- $9,511
Cash invested: $30,800 (down + closing). Projections, not guarantees.
Landlord ↔ Tenant lean methodology
- Overall (STATE)
- 83 Strongly Landlord-Friendly
- State Iowa
- 83 Strongly Landlord-Friendly · R+6
- County
- — inherits STATE
- City
- — inherits STATE
ZIP-level market 52802
- Home prices YoY
- -28.3%
- Active inventory
- 68
- Price-to-rent
- 6.7×
Monthly cashflow live
- Estimated rent
- $1,374 high interval (Pro) →
- Mortgage (P&I)
- −$577
- Tax from tax record
- −$181 /mo · $2,169/yr
- Insurance
- −$46
- HOA
- −$0
- Vacancy / Maint / Mgmt
- −$288
- Net cashflow
- $282
Break-even live
UW: 25.0% down · 7.5% · 30yr · 1.5% tax · 5.0% vac · 8.0% maint · 8.0% mgmt
Financing live
Cash to close
- Down payment
- $27,500
- Closing costs
- $3,300
- Reserves months
- —
- Total cash needed
- —
Loan-product check · same deal, 3 products live
Conventional
25% down · 7.5% · 30yr
- Down + closing
- —
- Monthly P&I
- —
- Monthly cashflow
- —
- DSCR
- —
- Eligible?
- —
Personal DTI + credit; lowest rate.
DSCR
20% down · 8.5% · 30yr
- Down + closing
- —
- Monthly P&I
- —
- Monthly cashflow
- —
- DSCR
- —
- Eligible?
- —
No personal income docs; deal must DSCR.
Hard money
10% down · 12.0% · 12mo
- Down + closing
- —
- Monthly P&I
- —
- Monthly cashflow
- —
- DSCR
- —
- Eligible?
- —
Short-term bridge; refi at stabilization.
Rent comps 6 comps
| Address | Beds | Baths | Sqft | Rent | $/sqft | DOM | Units | Dist |
|---|---|---|---|---|---|---|---|---|
| 2424 Telegraph Rd Davenport, IA | 4.0 | 2.0 | 2000 | $1,750 | $0.88 | 43d | 1 | 0.81mi |
| 1723 W Locust St Davenport, IA | 3.0 | 1.0 | 1690 | $1,395 | $0.83 | 43d | 1 | 1.04mi |
| 1323 N Gaines St Davenport, IA | 4.0 | 2.0 | 1733 | $1,350 | $0.78 | 21d | 1 | 1.21mi |
| 621 W 15th St Davenport, IA | 4.0 | 2.0 | 1833 | $1,500 | $0.82 | 13d | 1 | 1.27mi |
| 212 N Brady St Davenport, IA | 2.0–3.0 | 2.0–3.0 | 1428 | $2,600 | $1.82 | 13d | 4 | 1.39mi |
| 1511 N Ripley St Davenport, IA | 4.0 | 2.0 | 1872 | $1,450 | $0.77 | 21d | 1 | 1.46mi |
Listing history 21 events
-
2026-06-18days on market $110,000 Active 93 DOM
-
2026-06-17days on market $110,000 Active 92 DOM
-
2026-06-16days on market $110,000 Active 91 DOM
-
2026-06-15days on market $110,000 Active 90 DOM
-
2026-06-14days on market $110,000 Active 88 DOM
-
2026-06-13days on market $110,000 Active 87 DOM
-
2026-06-10days on market $110,000 Active 85 DOM
-
2026-06-09days on market $110,000 Active 84 DOM
-
2026-06-08days on market $110,000 Active 83 DOM
-
2026-06-07days on market $110,000 Active 82 DOM
-
2026-06-03status $110,000 Active 78 DOM
-
2026-04-15price $110,000 893-char remark
Show marketing remark (893 chars)
4-bed, 1.5-bath home in Davenport offering over 2,000 sq. ft. of finished space and filled with original character. This 2-story home features hardwood floors, original trim, and classic interior doors that highlight its timeless style. The main level includes a living room, dining room, kitchen, bathroom, and the primary bedroom for convenient main-floor living. Upstairs, three additional bedrooms and a second bathroom provide plenty of space. The unfinished attic offers potential for additional finished space such as a large primary suite or rec room. Outside, the property includes a fenced backyard with a large deck, along with a detached 3-car garage and a storage shed that stays with the home. The property was previously tenant occupied, with the most recent tenant paying $1,525 per month in rent. Schedule your showing today to see everything this Davenport home has to offer.
-
2026-03-09$120,000 Active 893-char remark
Show marketing remark (893 chars)
4-bed, 1.5-bath home in Davenport offering over 2,000 sq. ft. of finished space and filled with original character. This 2-story home features hardwood floors, original trim, and classic interior doors that highlight its timeless style. The main level includes a living room, dining room, kitchen, bathroom, and the primary bedroom for convenient main-floor living. Upstairs, three additional bedrooms and a second bathroom provide plenty of space. The unfinished attic offers potential for additional finished space such as a large primary suite or rec room. Outside, the property includes a fenced backyard with a large deck, along with a detached 3-car garage and a storage shed that stays with the home. The property was previously tenant occupied, with the most recent tenant paying $1,525 per month in rent. Schedule your showing today to see everything this Davenport home has to offer.
-
2021-08-06historical
-
2021-02-08soldstatus $190,000
-
2016-08-08soldstatus $92,000
-
2008-10-30soldstatus $84,500
-
2008-10-27soldstatus $84,500
-
2008-10-27soldstatus $84,500
-
2008-06-08$86,001
-
2008-06-08$86,001
ⓘ Source: listings_history table (triggers on properties + properties_extension) + one-shot
backfill from property_details.listing_events for pre-trigger history.
Tax reassessment forecast IA · Partial reset (capped growth)
- Current annual tax
- $2,169 · $181/mo
- Projected year-2 tax
- $2,169 · $181/mo
- Expected delta
- $0/yr ($0/mo · 0.0%)
ⓘ Screening estimate from a state-policy table — verify with the county assessor before closing.
Climate risk First Street
- Flood 1/10 Low FEMA zone X (unshaded) · 0% chance over 30 yrs
- Wildfire 1/10 Low
- Heat 3/10 Moderate 7 d/yr ≥104°F today · 16 d/yr by 30 yrs out
- Wind 2/10 Low
- Air quality 3/10 Moderate 2 unhealthy d/yr today · 3 by 30 yrs out
Nearby sold comps map
Loading sold comps map…
Walkable amenities ~0.75 mi
Loading nearby amenities…
Taxation est. · year 1
- Rental income
- $16,484
- − Mortgage interest
- −$6,162
- − Property taxes
- −$2,169
- − Insurance
- −$550
- − Repairs & maintenance
- −$1,319
- − Management
- −$1,319
- − Depreciation
- −$3,200
- Taxable income
- $1,765
- Est. tax owed @ 24.0%
- −$424
- After-tax cash flow
- $2,957/yr
For passive investors: Depreciation is non-cash, so a rental often shows a tax loss while cash-flowing — sheltering income. Rental losses are passive: they offset passive income freely, and up to $25,000/yr can offset ordinary (W-2) income if you actively participate and your MAGI is under $100k (phasing out to $0 by $150k); unused losses carry forward. On sale, claimed depreciation is recaptured at up to 25%, and gains may owe capital-gains tax (a 1031 exchange can defer both). Figures are a year-1 estimate at your 24.0% rate — not tax advice; consult a CPA.
Schools (NCES district)
- District
- Davenport Community School District
- NCES district ID
- 1908580
- Math proficiency
- 43% ▼ -11.00%
- Reading proficiency
- 50% ▼ -3.00%
- Median HH income
- $46,157
- Composite
- 39.49/100
- National rank
- #3951
- State rank
- #288 of 289 in IA
Livability — Davenport
- Score
- 79/100
- State rank
- #126
- US rank
- #2312
Category grades
Schools grade is shown separately in the Schools card above.
Census & demographics
- Census place
- Davenport, IA
- County
- Scott County · 144,583 people
- City population
- 103,319
- Metro
- Davenport-Moline-Rock Island, IA-IL
- Population (ZIP)
- 9,466
- Household income
- $54,380
- Rent vs Own
- Severe rent burden
- 244.0
Population outlook (Scott County) Hauer SSP2
- Today (2025)
- 188,878 people
- By 2030
- 196,648 · +4.1%
- By 2040
- 210,860 · +11.6%
- By 2050
- 224,359 · +18.8%
- By 2075
- 258,884 · +37.1%
- By 2100
- 286,447 · +51.7%
Race, ethnicity, and origin ACS 2023
- Neighborhood character
- Predominantly White (71%)
- Race & ethnicity
- White 71% Hispanic / Latino 14% Two or more races 10% Black 5% Asian 1%
- Hispanic origin (detail)
- Mexican 13%
- Common ancestry
- Romanian 2% Lithuanian 1% Italian 1%
- Foreign-born
- 4% · Canada, Vietnam
- Languages at home
- 92% English-only · Spanish 7%
Political lean MEDSL · Scott
- 2024 margin
- Toss-up / Even · D 47.3% · R 51.2% · Other 1.4%
- 2008→2024 swing
- -18.4pp toward R · 2008: 14.6pp · 2024: -3.9pp
- All cycles
- 2024: R+3.9 2020: D+3.5 2016: D+1.4 2012: D+13.8 2008: D+14.6
Not yet ingested
- Civics
- —
Market trends
- HPI YoY
- ▼ -59.59%
- Current HPI
- 151.2076
- Rent YoY
- —
- Metro
- Davenport-Moline-Rock Island, IA-IL
- State GDP YoY
- ▲ 2.48%
- F500 in state
- 4
Industry mix (Fortune 500 HQ in IA)
| Industry | F500 HQs | Revenue |
|---|---|---|
| Financial Services | 1 | $16B |
|
||
| Retail / Convenience | 1 | $15B |
|
||
Price history
+27.9% since first listed10 events — show timeline
- 2026-04-15 Price Changed $110,000 MRED as Distributed by MLS Grid
- 2026-03-09 Listed $120,000 MRED as Distributed by MLS Grid
- 2021-08-06 Listing Removed — RMLSA as Distributed by MLS Grid
- 2021-02-08 Sold (Public Records) $190,000 Public Records
- 2016-08-08 Sold (Public Records) $92,000 Public Records
- 2008-10-30 Sold (Public Records) $84,500 Public Records
- 2008-10-27 Sold (MLS) $84,500 MRED as Distributed by MLS Grid
- 2008-10-27 Sold (MLS) $84,500 RMLSA as Distributed by MLS Grid
- 2008-06-08 Listed $86,001 MRED as Distributed by MLS Grid
- 2008-06-08 Listed $86,001 RMLSA as Distributed by MLS Grid
Property tax history
+3.2%/yrLatest (2025): $2,169 · +50.8% YoY. Source: county tax records.
Cash-flow waterfall
monthlySold comps — $/sqft
last 12 mo · ≤1 miLoading sold comps…