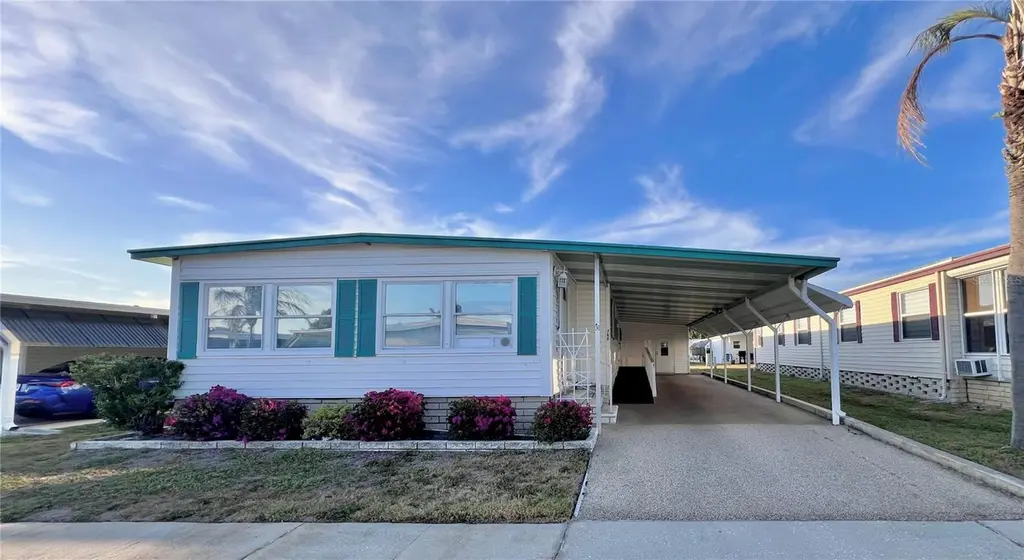
1100 Belcher Rd S #760 · Largo, FL
Flood risk 2/10 · Minimal
- FEMA flood zone
- X (unshaded)
- Chance of flooding over 30 yrs
- 0.03%
- Est. flood insurance / yr
- $507 – $1,088
Fire risk 1/10 · Minimal
- Est. fire insurance / yr
- $947 – $1,759
Heat risk 10/10 · Severe
- Hot days now (above 107°F)
- 7 days/yr
- Hot days in 30 yrs
- 23 days/yr
Wind risk 10/10 · Severe
- Chance of severe wind over 30 yrs
- 99.0%
Air-quality risk 3/10 · Minor
- Unhealthy air days now
- 3 days/yr
- Unhealthy air days in 30 yrs
- 3 days/yr
Risk factors via First Street. Map © Google.
Why this score? — see what drove the D- grade
The composite is a weighted blend of 9 inputs, each scored 0–100. Each bar is that input's sub-score; the figure is the points it added to the 100-point composite (weight × sub-score).
- Cash flow +14.8/30.0
- 1% rule +5.8/10.0
- DSCR +4.5/10.0
- Schools +4.3/10.0
- Livability +4.1/5.0
- Condition / age +2.5/5.0
- Rent growth +2.2/5.0
- ARV discount +0.8/15.0
- Appreciation +0.0/10.0
$180,000
🖨 Deal sheet 📄 Offer letter ✓ Due diligence
Listing remarks
Welcome to this spacious and well-maintained 2-bedroom, 2-bath home featuring a desirable large floor plan designed for comfortable living. This home offers an inviting layout with an inside laundry area and a versatile bonus room at the rear—perfect for a home office, hobby space, or additional relaxation area. Recent updates include beautiful new flooring and upgraded windows, enhancing both style and energy efficiency. The home is being offered furnished, making it truly move-in ready for its next owner. Most appliances have been updated, providing added convenience and peace of mind. Enjoy your morning coffee or unwind in the bright front Florida room with its desirable southern e
Key facts
- 2 parking spots
- Community pool
- Built 1978
Neighborhood map
What this means for you Summary
Snapshot
- This is a 2-bed/2.0-bath manufactured listed at $180k.
Deal economics
- At list price, monthly cash flow is $50 ($596/yr) — positive.
- The deal already cash-flows at list — no discount required.
- Meets the 1% rule at list price ($2k rent vs $180k).
- Cap rate 6.6% vs local median 4.2% in Largo — top-decile yield for the area; either an underpriced asset or a hidden risk that comps aren't pricing in. Stress-test before assuming the spread holds.
Location & tenants
- Location reads 82/100 on livability (#82 in FL, #1,240 nationally) — a professional / high-income tenant draw. Strengths: commute A+, cost of living A+, housing A+; Watch: employment D+, amenities F.
- Pinellas (suburban): math 51% / reading 51% proficiency, ranked #31 of 73 in FL (top 42%) — acceptable for families but not a draw, mixed tenant base, ~2y average lease.
- Market conditions: Rents soft (-1.1%/yr); 220 active listings in the ZIP; 40 comparable units currently listed for rent nearby; rentals at typical pace (median 22d on market — plan ~3-4 weeks tenant-placement turnaround); 2,676 units permitted in Pinellas County in 2024 (1,422 in 5+ unit buildings).
- This rent runs 39% of the median local income ($60k/yr) — at the standard rent-burdened threshold; future hikes will face affordability resistance.
Forward outlook
- Local home prices are declining (-3.0%/yr); year-one equity from $1k of loan paydown is wiped out by about $5k of value loss. Plan a longer hold.
- Pinellas County population projected at +14% by 2050 — modest demand growth; plan on rents tracking national, not racing it.
Negotiation context
- Only 1 days on market — expect competitive offers; lowballing is unlikely to land.
- Current owner paid $86k; list at $180k implies a 109% gain — meaningful room to come down on a strong offer.
Risks & watch-outs
- Watch-outs: HOA is 22% of rent.
- Climate carrying-cost: severe wind risk, 99% chance of damaging wind over 30y; extreme-heat days projected 7→23/yr by 2055 (HVAC capex compounding) — expect insurance premiums to compound above CPI over the hold.
Questions for the listing agent
- Built in 1978 — when were the roof, HVAC, electrical panel, plumbing, and water heater last replaced?
- What does the HOA fee cover, when was the last increase, and are there any pending special assessments or reserve-fund shortfalls?
- Is there a deadline driving the sale (1031 exchange, divorce, estate, relocation)? That informs how much negotiation room exists.
- The area grade is low — what's the realistic commute time and amenity access for the typical tenant pool here? Any planned neighborhood developments (good or bad) we should know about?
- What's the average days-on-market for RENTAL listings here right now (not sales)? A rising rental-DOM trend means longer vacancies and softer asking-rent achievability than the comps imply.
- What's the recent tenant-quality profile in this submarket — average credit score on applications, eviction rate, late-payment / NSF rate, and stable-employment percentage? A property-management company in the area should have these aggregated.
- How much new for-sale + rental construction is in the pipeline within 1–3 miles? Heavy new supply typically softens prices + rents 12–24 months out; constrained supply supports both.
Investment metrics
- 1% rule
- 1.08% ✓
- Cap rate
- 6.62%
- Cash-on-cash
- 1.18%
- DSCR
- 1.05
- GRM
- 7.7
CMA / ARV
- ARV (on-the-fly)
- $156,672
- Comps found
- 12
Show comp detail 12 sales within ~0.75 mi
| Address | Dist | Beds/Ba | Sqft | Sold | Price | $/sf | Match |
|---|---|---|---|---|---|---|---|
| 1100 Belcher Rd S #232 | 0.00mi | 2/2.0 | 1,152 (0%) | 1mo | $55,000 | $48 | 99 |
| 1100 Belcher Rd S #749 | 0.00mi | 2/2.0 | 1,200 (+4%) | 2mo | $149,900 | $125 | 91 |
| 1100 Belcher Rd S #605 | 0.00mi | 2/2.0 | 1,104 (-4%) | 3mo | $110,000 | $100 | 91 |
| 1100 Belcher Rd S #123 | 0.00mi | 2/2.0 | 1,208 (+5%) | 5mo | $168,500 | $139 | 88 |
| 1100 Belcher Rd S #558 | 0.00mi | 2/2.0 | 1,222 (+6%) | 7mo | $175,000 | $143 | 84 |
| 1100 Belcher Rd S #23 | 0.00mi | 2/1.5 | 1,036 (-10%) | 3mo | $109,900 | $106 | 79 |
| 1100 Belcher Rd S #366 | 0.00mi | 2/2.0 | 1,300 (+13%) | 3mo | $193,000 | $148 | 76 |
| 1100 Belcher Rd S #760 | 0.00mi | 2/2.0 | 1,321 (+15%) | 1mo | $175,000 | $132 | 75 |
| 1100 Belcher Rd S #105 | 0.00mi | 2/2.0 | 1,290 (+12%) | 7mo | $175,000 | $136 | 74 |
| 1100 Belcher Rd S #403 | 0.00mi | 2/2.0 | 1,008 (-12%) | 8mo | $240,000 | $238 | 72 |
| 1100 Belcher Rd S #121 | 0.00mi | 2/2.0 | 1,008 (-12%) | 9mo | $190,000 | $188 | 72 |
| 1001 Starkey Rd #476 | 0.52mi | 2/2.0 | 1,199 (+4%) | 3mo | $160,000 | $133 | 67 |
Match score weights: distance 35% · size 25% · config 20% · recency 20%. Top-matched comps best support the ARV.
Projected returns pro-forma
-3.0% appreciation · 0.0% rent growth · sell at horizon
- IRR
- -18.4%
- Equity multiple
- 0.37×
- Total profit
- $-31,505
- Equity at exit
- $26,839
- IRR
- -20.0%
- Equity multiple
- 0.12×
- Total profit
- $-44,581
- Equity at exit
- $15,563
Cash invested: $50,400 (down + closing). Projections, not guarantees.
Landlord ↔ Tenant lean methodology
- Overall (STATE)
- 87 Strongly Landlord-Friendly
- State Florida
- 87 Strongly Landlord-Friendly · R+3
- County
- — inherits STATE
- City
- — inherits STATE
ZIP-level market 33771
- Home prices YoY
- -30.2%
- Rents YoY
- -1.1%
- Active inventory
- 220
- Price-to-rent
- 7.7×
Monthly cashflow live
- Estimated rent
- $1,936 high interval (Pro) →
- Mortgage (P&I)
- −$944
- Tax from tax record
- −$41 /mo · $490/yr
- Insurance
- −$75
- HOA
- −$420
- Vacancy / Maint / Mgmt
- −$407
- Net cashflow
- $50
Break-even live
UW: 25.0% down · 7.5% · 30yr · 1.5% tax · 5.0% vac · 8.0% maint · 8.0% mgmt
Financing live
Cash to close
- Down payment
- $45,000
- Closing costs
- $5,400
- Reserves months
- —
- Total cash needed
- —
Loan-product check · same deal, 3 products live
Conventional
25% down · 7.5% · 30yr
- Down + closing
- —
- Monthly P&I
- —
- Monthly cashflow
- —
- DSCR
- —
- Eligible?
- —
Personal DTI + credit; lowest rate.
DSCR
20% down · 8.5% · 30yr
- Down + closing
- —
- Monthly P&I
- —
- Monthly cashflow
- —
- DSCR
- —
- Eligible?
- —
No personal income docs; deal must DSCR.
Hard money
10% down · 12.0% · 12mo
- Down + closing
- —
- Monthly P&I
- —
- Monthly cashflow
- —
- DSCR
- —
- Eligible?
- —
Short-term bridge; refi at stabilization.
Rent comps 40 comps
| Address | Beds | Baths | Sqft | Rent | $/sqft | DOM | Units | Dist |
|---|---|---|---|---|---|---|---|---|
| 1601 Palm Way Largo, FL | 3.0 | 1.0 | 1084 | $1,950 | $1.80 | 24d | 1 | 0.24mi |
| 3331 Whispering Dr N Largo, FL | 2.0 | 2.0 | 1053 | $2,190 | $2.08 | 23d | 1 | 0.29mi |
| 3736 141st Pl Largo, FL | 2.0 | 1.0 | 805 | $1,650 | $2.05 | 24d | 1 | 0.30mi |
| 779 34th St SE Unit 1319966P Largo, FL | 2.0 | 1.0 | 990 | $2,941 | $2.97 | 7d | 1 | 0.34mi |
| 14875 Cromwell Dr Clearwater, FL | 3.0 | 2.0 | 1485 | $2,195 | $1.48 | 16d | 1 | 0.44mi |
| 3030 Whispering Dr N Largo, FL | 3.0 | 2.0 | 1348 | $3,600 | $2.67 | 24d | 1 | 0.44mi |
| 3767 138th Ave N Unit B Largo, FL | 2.0 | 1.0 | 780 | $1,495 | $1.92 | 1d | 1 | 0.48mi |
| 2871 S Pines Dr #24 Largo, FL | 2.0 | 1.5 | 1048 | $1,800 | $1.72 | 24d | 1 | 0.50mi |
| 3718 138th Ave N Unit 2 Largo, FL | 2.0 | 1.0 | 750 | $1,500 | $2.00 | 24d | 1 | 0.50mi |
| 3135 Pine Tree Ave Largo, FL | 2.0 | 1.0 | 923 | $1,395 | $1.51 | 10d | 1 | 0.57mi |
| 3135 Pine Tree Ave Unit A Largo, FL | 2.0 | 1.0 | 923 | $1,395 | $1.51 | 21d | 1 | 0.57mi |
| 636 Lake Palms Dr Unit Stylish Largo, FL | 2.0 | 2.0 | 870 | $2,000 | $2.30 | 4d | 1 | 0.58mi |
| 636 Lake Palms Dr Unit Stylish Largo, FL | 3.0 | 2.0 | 1000 | $2,200 | $2.20 | 24d | 1 | 0.58mi |
| 3073 Pine Tree Ave Largo, FL | 2.0 | 1.0 | 825 | $1,350 | $1.64 | 24d | 1 | 0.59mi |
| 8775 Christie Dr Largo, FL | 2.0 | 3.0 | 1300 | $2,198 | $1.69 | 17d | 1 | 0.69mi |
| 3022 Meadow Lake Ave Largo, FL | 2.0 | 1.0 | 900 | $1,450 | $1.61 | 4d | 1 | 0.74mi |
| 3022 Meadow Lake Ave Largo, FL | 2.0 | 1.0 | 900 | $1,450 | $1.61 | 10d | 1 | 0.74mi |
| 3377 Sherwood Dr Unit A Largo, FL | 2.0 | 1.0 | 1064 | $1,650 | $1.55 | 7d | 1 | 0.88mi |
| 7001 142nd Ave Largo, FL | 2.0 | 2.0 | 1100 | $1,700 | $1.55 | 24d | 1 | 0.88mi |
| 7001 142nd Ave N Lot 179 Largo, FL | 2.0 | 2.0 | 1100 | $2,495 | $2.27 | 16d | 1 | 0.91mi |
| 2505 E Bay Dr Lot 77 Largo, FL | 2.0 | 1.5 | 1080 | $1,395 | $1.29 | 20d | 1 | 0.92mi |
| 7001 142nd Ave N #157 Largo, FL | 2.0 | 1.0 | 800 | $1,795 | $2.24 | 17d | 1 | 0.94mi |
| 9122 Jakes Path Largo, FL | 3.0 | 2.5 | 1461 | $2,600 | $1.78 | 24d | 1 | 0.95mi |
| 199 Fulton St NE Unit 4 Largo, FL | 2.0 | 1.0 | 760 | $1,600 | $2.11 | 14d | 1 | 0.95mi |
| 960 Starkey Rd #8402 Largo, FL | 2.0 | 2.0 | 1324 | $2,200 | $1.66 | 24d | 1 | 0.95mi |
| 960 Starkey Rd #5105 Largo, FL | 2.0 | 2.0 | 1324 | $2,295 | $1.73 | 24d | 1 | 0.98mi |
| 301 Seacrest Dr Largo, FL | 1.0–2.0 | 1.0–1.5 | 975 | $1,625 | $1.67 | 21d | 1 | 0.99mi |
| 2227 Rose Ln Clearwater, FL | 2.0 | 1.5 | 1200 | $3,200 | $2.67 | 24d | 1 | 1.00mi |
| 600 Starkey Rd Largo, FL | 1.0–3.0 | 1.0–2.0 | 982 | $1,774 | $1.81 | 2d | 21 | 1.02mi |
| 4500 E Bay Dr #138 Clearwater, FL | 2.0 | 2.0 | 1050 | $1,350 | $1.29 | 24d | 1 | 1.03mi |
| 4500 E Bay Dr #149 Clearwater, FL | 2.0 | 2.0 | 1050 | $1,850 | $1.76 | 24d | 1 | 1.03mi |
| 13635 Forest Lake Dr Largo, FL | 2.0 | 1.5 | 1250 | $1,990 | $1.59 | 24d | 1 | 1.03mi |
| 2234 Rose Ln Clearwater, FL | 2.0 | 2.0 | 1462 | $2,400 | $1.64 | 4d | 1 | 1.04mi |
| 960 Starkey Rd #10305 Largo, FL | 2.0 | 2.0 | 1324 | $2,200 | $1.66 | 14d | 1 | 1.04mi |
| 7360 Ulmerton Rd Unit 3C Largo, FL | 1.0 | 1.0 | 846 | $1,599 | $1.89 | 24d | 1 | 1.05mi |
| 7360 Ulmerton Rd Unit 3C Largo, FL | 1.0 | 1.0 | 846 | $1,498 | $1.77 | 7d | 1 | 1.05mi |
| 7360 Ulmerton Rd Unit NA Largo, FL | 2.0 | 2.0 | 1155 | $2,050 | $1.77 | 24d | 1 | 1.05mi |
| 305 Glades Cir Largo, FL | 1.0–3.0 | 1.0–1.5 | 875 | $1,563 | $1.79 | 1d | 34 | 1.06mi |
| 1200 Country Club Dr #1502 Largo, FL | 2.0 | 2.0 | 1320 | $2,350 | $1.78 | 3d | 1 | 1.09mi |
| 1200 Country Club Dr #3302 Largo, FL | 2.0 | 2.0 | 1320 | $2,200 | $1.67 | 3d | 1 | 1.09mi |
HOA detail
- Monthly dues
- $420 · $5,040/yr
Listing history 3 events
-
2026-04-27status Pending
-
2026-04-26$180,000 Active
-
2004-04-06soldstatus $86,000
ⓘ Source: listings_history table (triggers on properties + properties_extension) + one-shot
backfill from property_details.listing_events for pre-trigger history.
Tax reassessment forecast FL · Resets to sale price
- Current annual tax
- $490 · $41/mo
- Projected year-2 tax
- $1,494 · $124/mo
- Expected delta
- +$1,004/yr (+$84/mo · 204.7%)
ⓘ Screening estimate from a state-policy table — verify with the county assessor before closing.
Climate risk First Street
- Flood 2/10 Low FEMA zone X (unshaded) · 3% chance over 30 yrs
- Wildfire 1/10 Low
- Heat 10/10 Extreme 7 d/yr ≥107°F today · 23 d/yr by 30 yrs out
- Wind 10/10 Extreme 99% chance of damaging wind over 30 yrs
- Air quality 3/10 Moderate 3 unhealthy d/yr today · 3 by 30 yrs out
Nearby sold comps map
Loading sold comps map…
Walkable amenities ~0.75 mi
Loading nearby amenities…
Taxation est. · year 1
- Rental income
- $23,232
- − Mortgage interest
- −$10,083
- − Property taxes
- −$490
- − Insurance
- −$900
- − Repairs & maintenance
- −$1,859
- − Management
- −$1,859
- − HOA
- −$5,040
- − Depreciation
- −$5,236
- Taxable loss
- −$2,235
- Est. tax savings @ 24.0%
- +$536
- After-tax cash flow
- $1,132/yr
For passive investors: Depreciation is non-cash, so a rental often shows a tax loss while cash-flowing — sheltering income. Rental losses are passive: they offset passive income freely, and up to $25,000/yr can offset ordinary (W-2) income if you actively participate and your MAGI is under $100k (phasing out to $0 by $150k); unused losses carry forward. On sale, claimed depreciation is recaptured at up to 25%, and gains may owe capital-gains tax (a 1031 exchange can defer both). Figures are a year-1 estimate at your 24.0% rate — not tax advice; consult a CPA.
Schools (NCES district)
- District
- Pinellas
- NCES district ID
- 1201560
- Math proficiency
- 51% ▼ -5.00%
- Reading proficiency
- 51% ▼ -3.00%
- Median HH income
- $46,270
- Composite
- 43.27/100
- National rank
- #3046
- State rank
- #31 of 73 in FL
Livability — Largo
- Score
- 82/100
- State rank
- #82
- US rank
- #1240
Category grades
Schools grade is shown separately in the Schools card above.
Census & demographics
- Census place
- Largo, FL
- County
- Pinellas County · 939,478 people
- City population
- 106,311
- Metro
- Tampa-St. Petersburg-Clearwater, FL
- Population (ZIP)
- 27,596
- Household income
- $59,993
- Rent vs Own
- Severe rent burden
- 1243.0
Population outlook (Pinellas County) Hauer SSP2
- Today (2025)
- 1,027,532 people
- By 2030
- 1,063,586 · +3.5%
- By 2040
- 1,125,020 · +9.5%
- By 2050
- 1,168,637 · +13.7%
- By 2075
- 1,265,188 · +23.1%
- By 2100
- 1,260,357 · +22.7%
Race, ethnicity, and origin ACS 2023
- Neighborhood character
- Predominantly White (74%)
- Race & ethnicity
- White 74% Hispanic / Latino 14% Two or more races 9% Black 4% Asian 3%
- Hispanic origin (detail)
- Mexican 3% Puerto Rican 6% Dominican 2%
- Common ancestry
- Romanian 4% Lithuanian 3% Slovak 2%
- Foreign-born
- 13% · Canada, Jamaica, Guatemala
- Languages at home
- 82% English-only · Spanish 12% Other Indo-European 2% Russian/Polish/Slavic 2%
Political lean MEDSL · Pinellas
- 2024 margin
- Lean R (+5.2) · D 46.9% · R 52.1%
- 2008→2024 swing
- -13.5pp toward R · 2008: 8.3pp · 2024: -5.2pp
- All cycles
- 2024: R+5.2 2020: D+0.2 2016: R+1.1 2012: D+5.6 2008: D+8.3
Not yet ingested
- Civics
- —
Market trends
- HPI YoY
- ▼ -135.36%
- Current HPI
- 313.5044
- Rent YoY
- ▼ -1.06%
- Metro
- Tampa-St. Petersburg-Clearwater, FL
- State GDP YoY
- ▲ 3.28%
- F500 in state
- 36
Industry mix (Fortune 500 HQ in FL)
| Industry | F500 HQs | Revenue |
|---|---|---|
| Industrial Technology | 2 | $29B |
|
||
| Insurance | 2 | $17B |
|
||
| Retail | 1 | $60B |
|
||
| Technology Distribution | 1 | $58B |
|
||
| Homebuilding | 1 | $35B |
|
||
| Technology Manufacturing | 1 | $35B |
|
||
Price history
+109.3% since first listed3 events — show timeline
- 2026-04-27 Pending — Stellar MLS as Distributed by MLS Grid
- 2026-04-26 Listed $180,000 Stellar MLS as Distributed by MLS Grid
- 2004-04-06 Sold (Public Records) $86,000 Public Records
Property tax history
-6.8%/yrLatest (2025): $490 · +5.9% YoY. Source: county tax records.
Cash-flow waterfall
monthlySold comps — $/sqft
last 12 mo · ≤1 miLoading sold comps…