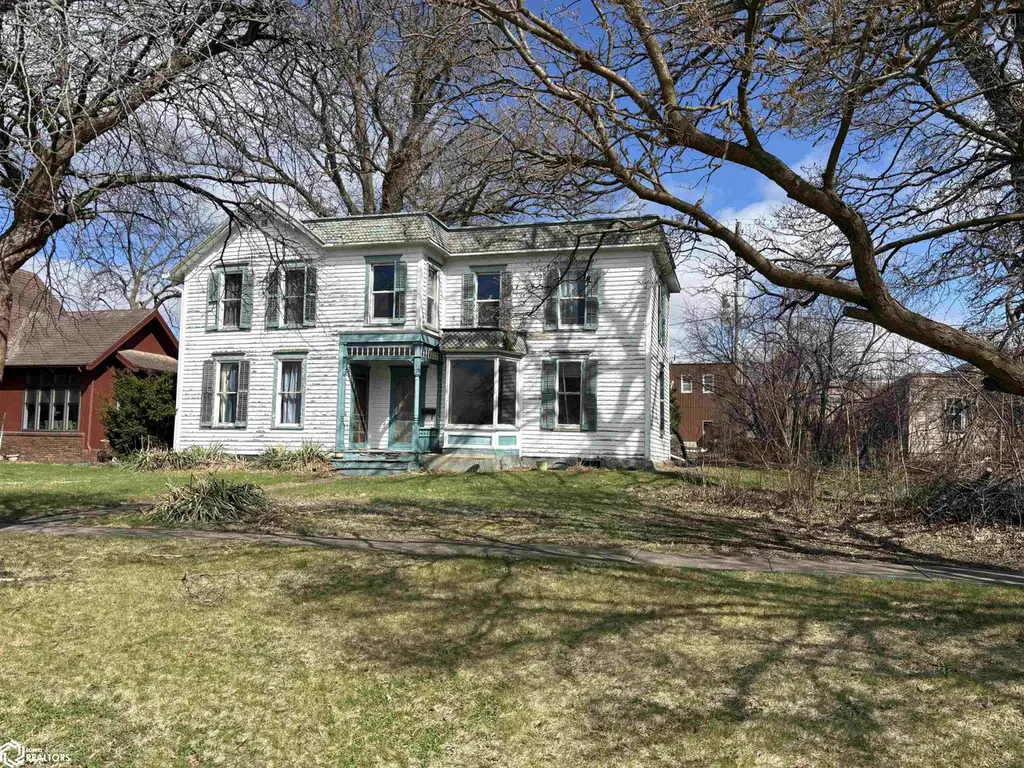
615 1st Ave · Ackley, IA
Flood risk 1/10 · Minimal
- FEMA flood zone
- X (unshaded)
- Chance of flooding over 30 yrs
- 0.0%
- Est. flood insurance / yr
- $473 – $860
Fire risk 3/10 · Minor
- Est. fire insurance / yr
- $902 – $1,676
Heat risk 3/10 · Minor
- Hot days now (above 102°F)
- 7 days/yr
- Hot days in 30 yrs
- 15 days/yr
Wind risk 2/10 · Minimal
- Chance of severe wind over 30 yrs
- —
Air-quality risk 1/10 · Minimal
- Unhealthy air days now
- 0 days/yr
- Unhealthy air days in 30 yrs
- 0 days/yr
Risk factors via First Street. Map © Google.
Why this score? — see what drove the B+ grade
The composite is a weighted blend of 9 inputs, each scored 0–100. Each bar is that input's sub-score; the figure is the points it added to the 100-point composite (weight × sub-score).
- Cash flow +30.0/30.0
- 1% rule +10.0/10.0
- DSCR +10.0/10.0
- ARV discount +7.5/15.0
- Appreciation +6.4/10.0
- Schools +5.5/10.0
- Livability +3.5/5.0
- Rent growth +2.5/5.0
- Condition / age +2.5/5.0
$55,000
🖨 Deal sheet (PDF) 📄 Offer letter ✓ Due diligence
Listing remarks MLS
Looking for a fixer upper or possible investment property? Make sure to add this one to your list! With 4 bedrooms, 2 baths, and over 2,000 sq ft this property could make a great family home. This home includes two lots giving you a half-acre in town with tons of fruit trees and off-street parking! A brand-new boiler system has been added along with new windows and flooring in the huge master bedroom/den upstairs.
Key facts
- Two lots
- Half-acre
- Fruit trees
Tags
Neighborhood map
What this means for you Summary
Snapshot
- This is a 4-bed/1.5-bath single-family listed at $55k.
Deal economics
- At list price, monthly cash flow is $578 ($7k/yr) — positive.
- The deal already cash-flows at list — no discount required.
- Meets the 1% rule at list price ($1k rent vs $55k).
- Recommended offer: $48k (12.0% below list) — sets the bar for market timing.
Location & tenants
- Location reads 70/100 on livability (#377 in IA) — a middle-class / working-renter tenant base. Strengths: crime A+, cost of living A+, housing A+; Watch: amenities F, commute F, health & safety F.
- Agwsr Community School District (rural): math 60% / reading 69% proficiency, ranked #198 of 289 in IA (top 68%) — acceptable for families but not a draw, mixed tenant base, ~2y average lease.
- Market conditions: 29 active listings in the ZIP; 6 units permitted in Hardin County in 2024 (0 in 5+ unit buildings).
Forward outlook
- In year one you build about $2k of equity ($380 loan paydown + $2k appreciation (2.8% local appreciation)).
- Hardin County population projected to shrink 6% by 2050 — rents likely to lag national; underwrite the cash flow, not the appreciation.
- At projected returns (2.8% appreciation + 3.0% rent growth), your $15k cash investment doubles in ~2 years — after that, you're playing with house money.
Negotiation context
- It's been on market 143 days — a 12% lower offer ($48k) is reasonable based on typical stale-listing flexibility.
- 3 sale attempts since 7y ago with the ask held roughly flat each time — persistent listings suggest the price (not the market) is what's stuck; bring a comps-based counter.
- Current owner paid $13k; list at $55k implies a 315% gain — meaningful room to come down on a strong offer.
Risks & watch-outs
- Watch-outs: built in 1872 — expect roof / HVAC / electrical / plumbing capex.
Questions for the listing agent
- It's been on market 143 days. Have you received any prior offers? Is the seller open to a 12% concession, seller financing, or rate buy-down credit?
- Built in 1872 — when were the roof, HVAC, electrical panel, plumbing, and water heater last replaced?
- Why hasn't it sold? Are there any deal-killer items the seller is aware of (foundation, flood, title, zoning, code violations)?
- Is there a deadline driving the sale (1031 exchange, divorce, estate, relocation)? That informs how much negotiation room exists.
- Schools are B-rated — typically a magnet for longer-tenancy family renters. What's the average tenant stay here, and is there a school-zone premium baked into asking?
- What's the average days-on-market for RENTAL listings here right now (not sales)? A rising rental-DOM trend means longer vacancies and softer asking-rent achievability than the comps imply.
- What's the recent tenant-quality profile in this submarket — average credit score on applications, eviction rate, late-payment / NSF rate, and stable-employment percentage? A property-management company in the area should have these aggregated.
- How much new for-sale + rental construction is in the pipeline within 1–3 miles? Heavy new supply typically softens prices + rents 12–24 months out; constrained supply supports both.
Investment metrics
- 1% rule
- 2.12% ✓
- Cap rate
- 18.91%
- Cash-on-cash
- 45.08%
- DSCR
- 3.01
- GRM
- 3.9
CMA / ARV
- ARV (median comp)
- $165,834
- List price
- $55,000
- Delta
- -66.83%
- Verdict
- UNDERPRICED
- Comps
- 20 within 1.0 mi
Show comp detail 7 sales within ~0.75 mi
| Address | Dist | Beds/Ba | Sqft | Sold | Price | $/sf | Match |
|---|---|---|---|---|---|---|---|
| 918 1st Ave Ave | 0.25mi | 4/2.0 | 2,142 (-0%) | 5mo | $162,000 | $76 | 81 |
| 1004 2nd Ave Ave | 0.32mi | 4/1.5 | 2,332 (+8%) | 1mo | $200,000 | $86 | 71 |
| 101 Hilltop Dr | 0.66mi | 3/2.0 (-1) | 2,162 (+0%) | 6mo | $162,000 | $75 | 56 |
| 1009 Main | 0.32mi | 4/1.5 | 1,860 (-14%) | 13mo | $172,900 | $93 | 51 |
| 1113 State St | 0.57mi | 4/2.0 | 2,238 (+4%) | 23mo | $219,900 | $98 | 46 |
| 917 2nd Ave | 0.27mi | 4/1.5 | 2,444 (+14%) | 24mo | $240,000 | $98 | 45 |
| 905 10th Ave | 0.67mi | 5/2.0 (+1) | 2,089 (-3%) | 23mo | $196,000 | $94 | 38 |
Match score weights: distance 35% · size 25% · config 20% · recency 20%. Top-matched comps best support the ARV.
Projected returns pro-forma
2.83% appreciation · 3.0% rent growth · sell at horizon
- IRR
- 50.1%
- Equity multiple
- 3.79×
- Total profit
- $42,966
- Equity at exit
- $24,201
- IRR
- 50.0%
- Equity multiple
- 7.62×
- Total profit
- $101,944
- Equity at exit
- $36,890
Cash invested: $15,400 (down + closing). Projections, not guarantees.
Landlord ↔ Tenant lean methodology
- Overall (STATE)
- 83 Strongly Landlord-Friendly
- State Iowa
- 83 Strongly Landlord-Friendly · R+6
- County
- — inherits STATE
- City
- — inherits STATE
ZIP-level market 50601
- Home prices YoY
- 1.9%
- Active inventory
- 29
- Price-to-rent
- 3.9×
Monthly cashflow live
- Estimated rent
- $1,166 medium interval (Pro) →
- Mortgage (P&I)
- −$288
- Tax from tax record
- −$31 /mo · $376/yr
- Insurance
- −$23
- HOA
- −$0
- Vacancy / Maint / Mgmt
- −$245
- Net cashflow
- $578
Break-even live
Sensitivity live
| Price | -10% $610 | -5% $594 | +0% $578 | +5% $563 | +10% $547 |
|---|---|---|---|---|---|
| Rent | -10% $486 | -5% $532 | +0% $578 | +5% $625 | +10% $671 |
| Rate | -1.0pp $606 | -0.5pp $592 | base $578 | +0.5pp $564 | +1.0pp $550 |
UW: 25.0% down · 7.5% · 30yr · 1.5% tax · 5.0% vac · 8.0% maint · 8.0% mgmt
Financing live
Cash to close
- Down payment
- $13,750
- Closing costs
- $1,650
- Reserves months
- —
- Total cash needed
- —
Loan-product check · same deal, 3 products live
Conventional
25% down · 7.5% · 30yr
- Down + closing
- —
- Monthly P&I
- —
- Monthly cashflow
- —
- DSCR
- —
- Eligible?
- —
Personal DTI + credit; lowest rate.
DSCR
20% down · 8.5% · 30yr
- Down + closing
- —
- Monthly P&I
- —
- Monthly cashflow
- —
- DSCR
- —
- Eligible?
- —
No personal income docs; deal must DSCR.
Hard money
10% down · 12.0% · 12mo
- Down + closing
- —
- Monthly P&I
- —
- Monthly cashflow
- —
- DSCR
- —
- Eligible?
- —
Short-term bridge; refi at stabilization.
Listing history 21 events
-
2026-06-21days on market $55,000 Active 143 DOM
-
2026-06-18days on market $55,000 Active 141 DOM
-
2026-06-17days on market $55,000 Active 140 DOM
-
2026-06-16days on market $55,000 Active 139 DOM
-
2026-06-15days on market $55,000 Active 138 DOM
-
2026-06-13days on market $55,000 Active 136 DOM
-
2026-06-12days on market $55,000 Active 135 DOM
-
2026-06-09days on market $55,000 Active 132 DOM
-
2026-06-08days on market $55,000 Active 131 DOM
-
2026-06-07days on market $55,000 Active 130 DOM
-
2026-06-07days on market $55,000 Active 129 DOM
-
2026-06-04days on market $55,000 Active 126 DOM
-
2026-06-02days on market $55,000 Active 125 DOM
-
2026-06-01days on market $55,000 Active 124 DOM
-
2026-05-31days on market $55,000 Active 123 DOM
-
2026-05-31days on market $55,000 Active 122 DOM
-
2026-01-27$55,000 Active 417-char remark
Show marketing remark (417 chars)
Looking for a fixer upper or possible investment property? Make sure to add this one to your list! With 4 bedrooms, 2 baths, and over 2,000 sq ft this property could make a great family home. This home includes two lots giving you a half-acre in town with tons of fruit trees and off-street parking! A brand-new boiler system has been added along with new windows and flooring in the huge master bedroom/den upstairs.
-
2019-10-03soldstatus $13,250 289-char remark
Show marketing remark (289 chars)
2 story vintage home with that do it yourself feel. Is being sold as is. Cash 4 bedrooms. Close to downtown Ackley. Has a large detached garage with alley access. Adjacent vacant to the east ( 891902252018) lot is being sold along with house property. Estate listing. No seller disclosures
-
2019-10-03soldstatus $13,250
Show marketing remark (289 chars)
2 story vintage home with that do it yourself feel. Is being sold as is. Cash 4 bedrooms. Close to downtown Ackley. Has a large detached garage with alley access. Adjacent vacant to the east ( 891902252018) lot is being sold along with house property. Estate listing. No seller disclosures
-
2019-06-17$17,500 289-char remark
Show marketing remark (289 chars)
2 story vintage home with that do it yourself feel. Is being sold as is. Cash 4 bedrooms. Close to downtown Ackley. Has a large detached garage with alley access. Adjacent vacant to the east ( 891902252018) lot is being sold along with house property. Estate listing. No seller disclosures
-
2019-06-17$17,500
Show marketing remark (289 chars)
2 story vintage home with that do it yourself feel. Is being sold as is. Cash 4 bedrooms. Close to downtown Ackley. Has a large detached garage with alley access. Adjacent vacant to the east ( 891902252018) lot is being sold along with house property. Estate listing. No seller disclosures
ⓘ Source: listings_history table (triggers on properties + properties_extension) + one-shot
backfill from property_details.listing_events for pre-trigger history.
Tax reassessment forecast IA · Partial reset (capped growth)
- Current annual tax
- $376 · $31/mo
- Projected year-2 tax
- $620 · $52/mo
- Expected delta
- +$244/yr (+$20/mo · 64.8%)
ⓘ Screening estimate from a state-policy table — verify with the county assessor before closing.
Climate risk First Street
- Flood 1/10 Low FEMA zone X (unshaded) · 0% chance over 30 yrs
- Wildfire 3/10 Moderate
- Heat 3/10 Moderate 7 d/yr ≥102°F today · 15 d/yr by 30 yrs out
- Wind 2/10 Low
- Air quality 1/10 Low 0 unhealthy d/yr today · 0 by 30 yrs out
Nearby sold comps map
Loading sold comps map…
Walkable amenities ~0.75 mi
Loading nearby amenities…
Taxation est. · year 1
- Rental income
- $13,992
- − Mortgage interest
- −$3,081
- − Property taxes
- −$376
- − Insurance
- −$275
- − Repairs & maintenance
- −$1,119
- − Management
- −$1,119
- − Depreciation
- −$1,600
- Taxable income
- $6,422
- Est. tax owed @ 24.0%
- −$1,541
- After-tax cash flow
- $5,401/yr
For passive investors: Depreciation is non-cash, so a rental often shows a tax loss while cash-flowing — sheltering income. Rental losses are passive: they offset passive income freely, and up to $25,000/yr can offset ordinary (W-2) income if you actively participate and your MAGI is under $100k (phasing out to $0 by $150k); unused losses carry forward. On sale, claimed depreciation is recaptured at up to 25%, and gains may owe capital-gains tax (a 1031 exchange can defer both). Figures are a year-1 estimate at your 24.0% rate — not tax advice; consult a CPA.
Schools (NCES district)
- District
- Agwsr Community School District
- NCES district ID
- 1903060
- Math proficiency
- 60% ▼ -9.00%
- Reading proficiency
- 69% ▼ -1.00%
- Median HH income
- $51,863
- Composite
- 54.95/100
- National rank
- #1304
- State rank
- #198 of 289 in IA
Livability — Ackley
- Score
- 70/100
- State rank
- #377
- US rank
- #7968
Category grades
Schools grade is shown separately in the Schools card above.
Census & demographics
- Census place
- Ackley, IA
- Population (ZIP)
- 2,377
Population outlook (Hardin County) Hauer SSP2
- Today (2025)
- 17,474 people
- By 2030
- 17,369 · -0.6%
- By 2040
- 17,018 · -2.6%
- By 2050
- 16,454 · -5.8%
- By 2075
- 14,665 · -16.1%
- By 2100
- 12,404 · -29.0%
Race, ethnicity, and origin ACS 2023
- Neighborhood character
- Predominantly White (90%)
- Race & ethnicity
- White 90% Hispanic / Latino 8% Two or more races 4%
- Hispanic origin (detail)
- Mexican 8%
- Common ancestry
- Portuguese 4% Iranian 3% Slovak 2%
- Foreign-born
- 5% · Canada, South Korea
- Languages at home
- 93% English-only · Spanish 7%
Political lean MEDSL · Hardin
- 2024 margin
- Solid R (+38.4) · D 30.3% · R 68.7% · Other 1.1%
- 2008→2024 swing
- -39.3pp toward R · 2008: 0.9pp · 2024: -38.4pp
- All cycles
- 2024: R+38.4 2020: R+32.0 2016: R+29.2 2012: R+7.1 2008: D+0.9
Not yet ingested
- Civics
- —
Market trends
- HPI YoY
- ▲ 2.83%
- Current HPI
- 154.031
- Rent YoY
- —
- Metro
- —
- State GDP YoY
- ▲ 2.48%
- F500 in state
- 4
Industry mix (Fortune 500 HQ in IA)
| Industry | F500 HQs | Revenue |
|---|---|---|
| Financial Services | 1 | $16B |
|
||
| Retail / Convenience | 1 | $15B |
|
||
Price history
+214.3% since first listed5 events — show timeline
- 2026-01-27 Listed $55,000 IAR
- 2019-10-03 Sold (MLS) $13,250 NEIRBR as distributed by MLS GRID
- 2019-10-03 Sold (MLS) $13,250 IAR
- 2019-06-17 Listed $17,500 NEIRBR as distributed by MLS GRID
- 2019-06-17 Listed $17,500 IAR
Property tax history
-2.5%/yrLatest (2025): $376 · -9.2% YoY. Source: county tax records.
Cash-flow waterfall
monthlySold comps — $/sqft
last 12 mo · ≤1 miLoading sold comps…