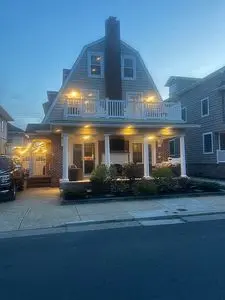
10 N Iroquois Ave · Margate City, NJ
Flood risk 9/10 · Severe
- FEMA flood zone
- AE
- Chance of flooding over 30 yrs
- 0.99%
- Est. flood insurance / yr
- $1,737 – $8,500
Fire risk 1/10 · Minimal
- Est. fire insurance / yr
- $526 – $976
Heat risk 9/10 · Severe
- Hot days now (above 95°F)
- 7 days/yr
- Hot days in 30 yrs
- 16 days/yr
Wind risk 8/10 · Major
- Chance of severe wind over 30 yrs
- 80.0%
Air-quality risk 2/10 · Minimal
- Unhealthy air days now
- 1 days/yr
- Unhealthy air days in 30 yrs
- 2 days/yr
Risk factors via First Street. Map © Google.
Why this score? — see what drove the D+ grade
The composite is a weighted blend of 9 inputs, each scored 0–100. Each bar is that input's sub-score; the figure is the points it added to the 100-point composite (weight × sub-score).
- Cash flow +13.5/30.0
- ARV discount +11.9/15.0
- Schools +4.8/10.0
- Rent growth +4.7/5.0
- DSCR +4.1/10.0
- Livability +3.8/5.0
- 1% rule +2.8/10.0
- Condition / age +2.5/5.0
- Appreciation +0.0/10.0
$1,799,000
🖨 Deal sheet 📄 Offer letter ✓ Due diligence
Listing remarks
Stunning updated 3-story beach home just 2 blocks from the shore! This spacious getaway features 5 bedrooms and 3 full baths, offering plenty of room for family and guests. The bright and inviting family room includes two sliding glass doors that open to a large porch, perfect for entertaining or relaxing by the outdoor gas fireplace while enjoying the mounted television. Inside, a cozy gas fireplace adds warmth and charm. After a day at the beach, rinse off in the convenient outdoor shower. Located steps from shopping, dining, and attractions in a great neighborhood, this home combines coastal living with modern comfort in the perfect beachside location.
Key facts
- Cozy gas fireplace
- Large porch
- Outdoor shower
Tags
Neighborhood map
What this means for you Summary
Snapshot
- This is a 5-bed/3.0-bath single-family listed at $1.80M.
Deal economics
- At list price, monthly cash flow is $-364 ($-4k/yr) — negative.
- To cash-flow at today's rent, offer at most $1.73M (3.6% below list).
- To meet the 1% rule (rent ≥ 1% of price), the offer needs to be $1.40M (22.1% below list).
- Recommended offer: $1.40M (22.1% below list) — sets the bar for 1% rule.
Location & tenants
- Location reads 75/100 on livability (#149 in NJ, #3,893 nationally) — a middle-class / working-renter tenant base. Strengths: schools A+, crime A+, employment A+; Watch: amenities F, commute F, cost of living F.
- Margate City School District (suburban): math 50% / reading 58% proficiency, ranked #113 of 472 in NJ (top 24%) — acceptable for families but not a draw, mixed tenant base, ~2y average lease; only 8% free/reduced lunch — higher-income household profile.
- Market conditions: Rents rising fast (+8.9%/yr); 147 active listings in the ZIP; 14 comparable units currently listed for rent nearby; rentals at typical pace (median 21d on market — plan ~3-4 weeks tenant-placement turnaround); high-income renter base; 672 units permitted in Atlantic County in 2024 (258 in 5+ unit buildings).
- At $14,015/mo this rent would consume 138% of the median local household income ($122k/yr) (locally 23% of renters already pay >50% of income on rent) — very limited rent-growth headroom before tenants either downsize or default.
Forward outlook
- Local home prices are declining (-3.0%/yr); year-one equity from $12k of loan paydown is wiped out by about $54k of value loss. Plan a longer hold.
- Atlantic County population projected at -12% by 2050 — secular population decline; favor cash flow + early exit over multi-decade hold.
Negotiation context
- It's been on market 24 days — a 2% lower offer ($1.77M) is reasonable based on typical stale-listing flexibility.
Risks & watch-outs
- Watch-outs: flood insurance adds $427/mo; built in 1925 — expect roof / HVAC / electrical / plumbing capex.
- Climate carrying-cost: in FEMA flood zone AE (mandatory federal flood insurance); severe wind risk, 80% chance of damaging wind over 30y; extreme-heat days projected 7→16/yr by 2055 (HVAC capex compounding) — expect insurance premiums to compound above CPI over the hold.
Questions for the listing agent
- What do current leases actually rent for vs. the listed asking? Can we see a recent rent roll and the last 12 months of T-12 income?
- Built in 1925 — when were the roof, HVAC, electrical panel, plumbing, and water heater last replaced?
- What's the actual annual flood-insurance premium (NFIP or private), and is the property in a SFHA with mandatory coverage?
- Is there a deadline driving the sale (1031 exchange, divorce, estate, relocation)? That informs how much negotiation room exists.
- Schools are A-rated — typically a magnet for longer-tenancy family renters. What's the average tenant stay here, and is there a school-zone premium baked into asking?
- The area grade is low — what's the realistic commute time and amenity access for the typical tenant pool here? Any planned neighborhood developments (good or bad) we should know about?
- What's the average days-on-market for RENTAL listings here right now (not sales)? A rising rental-DOM trend means longer vacancies and softer asking-rent achievability than the comps imply.
- What's the recent tenant-quality profile in this submarket — average credit score on applications, eviction rate, late-payment / NSF rate, and stable-employment percentage? A property-management company in the area should have these aggregated.
- How much new for-sale + rental construction is in the pipeline within 1–3 miles? Heavy new supply typically softens prices + rents 12–24 months out; constrained supply supports both.
Investment metrics
- 1% rule
- 0.78% ✗
- Cap rate
- 6.33%
- Cash-on-cash
- 0.15%
- DSCR
- 1.01
- GRM
- 10.7
CMA / ARV
- ARV (on-the-fly)
- $1,995,452
- Comps found
- 12
Show comp detail 12 sales within ~0.75 mi
| Address | Dist | Beds/Ba | Sqft | Sold | Price | $/sf | Match |
|---|---|---|---|---|---|---|---|
| 17 N Lancaster Ave | 0.14mi | 5/4.5 | 2,700 (+2%) | 4mo | $2,800,000 | $1,037 | 80 |
| 8211 Ventnor Ave | 0.04mi | 4/3.0 (-1) | 2,972 (+13%) | 3mo | $1,600,000 | $538 | 70 |
| 26 N Delavan Ave Ave | 0.38mi | 5/4.5 | 2,750 (+4%) | 0mo | $2,750,000 | $1,000 | 69 |
| 111 N Brunswick Ave | 0.51mi | 5/3.5 | 2,500 (-5%) | 0mo | $2,175,000 | $870 | 65 |
| 214 N Brunswick Dr | 0.56mi | 6/4.0 (+1) | 2,650 (+0%) | 1mo | $1,995,000 | $753 | 63 |
| 7 S Hanover Ave | 0.12mi | 4/3.0 (-1) | 2,240 (-15%) | 3mo | $1,695,000 | $757 | 62 |
| 403 N Lancaster Ave | 0.40mi | 5/3.5 | 2,950 (+12%) | 4mo | $2,050,000 | $695 | 56 |
| 21 N Douglas Ave | 0.37mi | 6/4.5 (+1) | 2,842 (+8%) | 4mo | $2,575,000 | $906 | 56 |
| 1 S Douglas Ave | 0.37mi | 4/3.5 (-1) | 2,357 (-11%) | 3mo | $1,425,000 | $605 | 56 |
| 29 East Dr | 0.59mi | 4/2.5 (-1) | 2,426 (-8%) | 1mo | $1,525,000 | $629 | 51 |
| 212 N Union Ave | 0.57mi | 4/3.5 (-1) | 2,390 (-9%) | 1mo | $2,225,000 | $931 | 50 |
| 420 N Delavan Ave | 0.63mi | 4/3.5 (-1) | 2,850 (+8%) | 1mo | $1,670,000 | $586 | 49 |
Match score weights: distance 35% · size 25% · config 20% · recency 20%. Top-matched comps best support the ARV.
Projected returns pro-forma
-3.0% appreciation · 8.0% rent growth · sell at horizon
- IRR
- -12.7%
- Equity multiple
- 0.52×
- Total profit
- $-241,025
- Equity at exit
- $268,237
- IRR
- 2.2%
- Equity multiple
- 1.19×
- Total profit
- $95,761
- Equity at exit
- $155,545
Cash invested: $503,720 (down + closing). Projections, not guarantees.
Landlord ↔ Tenant lean methodology
- Overall (STATE)
- 21 Tenant-Leaning
- State New Jersey
- 21 Tenant-Leaning · D+6
- County
- — inherits STATE
- City
- — inherits STATE
ZIP-level market 08402
- Rents YoY
- 8.9%
- Active inventory
- 147
- Price-to-rent
- 10.7×
Monthly cashflow live
- Estimated rent
- $14,015 medium interval (Pro) →
- Mortgage (P&I)
- −$9,434
- Tax from tax record
- −$826 /mo · $9,909/yr
- Insurance
- −$750
- Flood insurance flood zone
- −$427 /mo · $5,118/yr
- HOA
- −$0
- Vacancy / Maint / Mgmt
- −$2,943
- Net cashflow
- $-364
Break-even live
UW: 25.0% down · 7.5% · 30yr · 1.5% tax · 5.0% vac · 8.0% maint · 8.0% mgmt
Financing live
Cash to close
- Down payment
- $449,750
- Closing costs
- $53,970
- Reserves months
- —
- Total cash needed
- —
Loan-product check · same deal, 3 products live
Conventional
25% down · 7.5% · 30yr
- Down + closing
- —
- Monthly P&I
- —
- Monthly cashflow
- —
- DSCR
- —
- Eligible?
- —
Personal DTI + credit; lowest rate.
DSCR
20% down · 8.5% · 30yr
- Down + closing
- —
- Monthly P&I
- —
- Monthly cashflow
- —
- DSCR
- —
- Eligible?
- —
No personal income docs; deal must DSCR.
Hard money
10% down · 12.0% · 12mo
- Down + closing
- —
- Monthly P&I
- —
- Monthly cashflow
- —
- DSCR
- —
- Eligible?
- —
Short-term bridge; refi at stabilization.
Rent comps 14 comps
| Address | Beds | Baths | Sqft | Rent | $/sqft | DOM | Units | Dist |
|---|---|---|---|---|---|---|---|---|
| 8606 Monmouth Ave Unit August 9/13 Margate City, NJ | 4.0 | 3.5 | 2430 | $20,000 | $8.23 | 44d | 1 | 0.30mi |
| 106 S Essex Ave Margate City, NJ | 5.0 | 3.0 | 2034 | $9,500 | $4.67 | 21d | 1 | 0.37mi |
| 107 N Douglas Ave Margate City, NJ | 5.0 | 3.5 | 2312 | $36,000 | $15.57 | 44d | 1 | 0.38mi |
| 107 N Douglas Ave Unit AUGUST Margate City, NJ | 5.0 | 3.5 | 2312 | $33,000 | $14.27 | 21d | 1 | 0.39mi |
| 7611 Ventnor Ave Margate City, NJ | 6.0 | 4.0 | 2717 | $34,000 | $12.51 | 21d | 1 | 0.43mi |
| 204 N Union Ave Margate City, NJ | 5.0 | 4.0 | 2393 | $5,000 | $2.09 | 44d | 1 | 0.56mi |
| 111 N Belmont Ave Margate City, NJ | 5.0 | 3.5 | 3200 | $35,000 | $10.94 | 21d | 1 | 0.57mi |
| 119 N Belmont Ave Unit June 2026 Margate City, NJ | 4.0 | 2.5 | 2044 | $10,000 | $4.89 | 13d | 1 | 0.58mi |
| 8208 Lagoon Dr Margate City, NJ | 4.0 | 2.5 | 2480 | $18,000 | $7.26 | 13d | 1 | 0.77mi |
| 6 N Melbourne Ave Ventnor City, NJ | 4.0 | 3.5 | 2028 | $3,000 | $1.48 | 44d | 1 | 0.78mi |
| 7103 Ventnor Ave Ventnor City, NJ | 4.0 | 3.0 | 2288 | $5,500 | $2.40 | 13d | 1 | 0.81mi |
| 9411 Winchester Ave Margate City, NJ | 5.0 | 3.5 | 2776 | $11,500 | $4.14 | 44d | 1 | 0.83mi |
| 9406 Amherst Ave Margate City, NJ | 4.0 | 4.0 | 2554 | $47,000 | $18.40 | 21d | 1 | 0.86mi |
| 109 N Wissahickon Ave Unit B Ventnor City, NJ | 4.0 | 3.5 | 2000 | $25,000 | $12.50 | 21d | 1 | 0.99mi |
Listing history 16 events
-
2026-06-19days on market $1,799,000 Active 24 DOM
-
2026-06-18days on market $1,799,000 Active 23 DOM
-
2026-06-17days on market $1,799,000 Active 22 DOM
-
2026-06-16days on market $1,799,000 Active 21 DOM
-
2026-06-15days on market $1,799,000 Active 20 DOM
-
2026-06-14days on market $1,799,000 Active 18 DOM
-
2026-06-13days on market $1,799,000 Active 17 DOM
-
2026-06-10days on market $1,799,000 Active 15 DOM
-
2026-06-09days on market $1,799,000 Active 14 DOM
-
2026-06-08days on market $1,799,000 Active 13 DOM
-
2026-06-07days on market $1,799,000 Active 12 DOM
-
2026-06-05days on market $1,799,000 Active 9 DOM
-
2026-06-02days on market $1,799,000 Active 7 DOM
-
2026-06-01days on market $1,799,000 Active 6 DOM
-
2026-05-31days on market $1,799,000 Active 5 DOM
-
2026-05-30days on market $1,799,000 Active 4 DOM
ⓘ Source: listings_history table (triggers on properties + properties_extension) + one-shot
backfill from property_details.listing_events for pre-trigger history.
Tax reassessment forecast NJ · Partial reset (capped growth)
- Current annual tax
- $9,909 · $826/mo
- Projected year-2 tax
- $27,352 · $2,279/mo
- Expected delta
- +$17,443/yr (+$1,454/mo · 176.0%)
ⓘ Screening estimate from a state-policy table — verify with the county assessor before closing.
Climate risk First Street
- Flood 9/10 Extreme FEMA zone AE · 99% chance over 30 yrs
- Wildfire 1/10 Low
- Heat 9/10 Extreme 7 d/yr ≥95°F today · 16 d/yr by 30 yrs out
- Wind 8/10 Severe 80% chance of damaging wind over 30 yrs
- Air quality 2/10 Low 1 unhealthy d/yr today · 2 by 30 yrs out
Nearby sold comps map
Loading sold comps map…
Walkable amenities ~0.75 mi
Loading nearby amenities…
Taxation est. · year 1
- Rental income
- $168,184
- − Mortgage interest
- −$100,772
- − Property taxes
- −$9,909
- − Insurance
- −$14,114
- − Repairs & maintenance
- −$13,455
- − Management
- −$13,455
- − Depreciation
- −$52,335
- Taxable loss
- −$35,854
- Est. tax savings @ 24.0%
- +$8,605
- After-tax cash flow
- $4,238/yr
For passive investors: Depreciation is non-cash, so a rental often shows a tax loss while cash-flowing — sheltering income. Rental losses are passive: they offset passive income freely, and up to $25,000/yr can offset ordinary (W-2) income if you actively participate and your MAGI is under $100k (phasing out to $0 by $150k); unused losses carry forward. On sale, claimed depreciation is recaptured at up to 25%, and gains may owe capital-gains tax (a 1031 exchange can defer both). Figures are a year-1 estimate at your 24.0% rate — not tax advice; consult a CPA.
Schools (NCES district)
- District
- Margate City School District
- NCES district ID
- 3409690
- Math proficiency
- 50% ▼ -26.00%
- Reading proficiency
- 58% ▼ -28.00%
- Median HH income
- $67,112
- Composite
- 47.71/100
- National rank
- #2241
- State rank
- #113 of 472 in NJ
Livability — Margate City
- Score
- 75/100
- State rank
- #149
- US rank
- #3893
Category grades
Schools grade is shown separately in the Schools card above.
Census & demographics
- Census place
- Margate City, NJ
- County
- Atlantic County · 143,611 people
- City population
- 5,234
- Metro
- Atlantic City-Hammonton, NJ
- Population (ZIP)
- 5,234
- Household income
- $121,800
- Rent vs Own
- Severe rent burden
- 23.0
Population outlook (Atlantic County) Hauer SSP2
- Today (2025)
- 268,948 people
- By 2030
- 264,497 · -1.7%
- By 2040
- 252,261 · -6.2%
- By 2050
- 237,846 · -11.6%
- By 2075
- 210,650 · -21.7%
- By 2100
- 180,234 · -33.0%
Race, ethnicity, and origin ACS 2023
- Neighborhood character
- Predominantly White (94%)
- Race & ethnicity
- White 94% Two or more races 3% Asian 2% Hispanic / Latino 2%
- Common ancestry
- Scotch-Irish 9% Romanian 6% Lithuanian 2%
- Foreign-born
- 5% · Canada, Jamaica
- Languages at home
- 92% English-only · Other Indo-European 2% Tagalog/Filipino 2% Spanish 1%
Political lean MEDSL · Atlantic
- 2024 margin
- Toss-up / Even · D 47.7% · R 50.7% · Other 1.6%
- 2008→2024 swing
- -18.1pp toward R · 2008: 15.1pp · 2024: -3.0pp
- All cycles
- 2024: R+3.0 2020: D+6.7 2016: D+6.2 2012: D+17.2 2008: D+15.1
Not yet ingested
- Civics
- —
Market trends
- HPI YoY
- ▼ -625.70%
- Current HPI
- 475.1366
- Rent YoY
- ▲ 8.91%
- Metro
- Atlantic City-Hammonton, NJ
- State GDP YoY
- ▲ 2.05%
- F500 in state
- 34
Industry mix (Fortune 500 HQ in NJ)
| Industry | F500 HQs | Revenue |
|---|---|---|
| Consumer Goods | 3 | $31B |
|
||
| Pharmaceuticals | 2 | $153B |
|
||
| Technology | 2 | $21B |
|
||
| Insurance | 2 | $20B |
|
||
| Healthcare | 2 | $19B |
|
||
| Financial Services | 1 | $70B |
|
||
Price history
1 event — show timeline
- 2026-05-26 Listed $1,799,000 FSBO.com
Property tax history
+1.9%/yrLatest (2025): $9,909 · +4.6% YoY. Source: county tax records.
Cash-flow waterfall
monthlySold comps — $/sqft
last 12 mo · ≤1 miLoading sold comps…