155 Water St #5 · Lee, MA
Flood risk 8/10 · Major
- FEMA flood zone
- X
- Chance of flooding over 30 yrs
- 0.99%
- Est. flood insurance / yr
- $507 – $1,088
Fire risk 3/10 · Minor
- Est. fire insurance / yr
- $915 – $1,699
Heat risk 3/10 · Minor
- Hot days now (above 91°F)
- 7 days/yr
- Hot days in 30 yrs
- 16 days/yr
Wind risk 4/10 · Minor
- Chance of severe wind over 30 yrs
- 14.0%
Air-quality risk 2/10 · Minimal
- Unhealthy air days now
- 1 days/yr
- Unhealthy air days in 30 yrs
- 1 days/yr
Risk factors via First Street. Map © Google.
Why this score? — see what drove the B grade
The composite is a weighted blend of 9 inputs, each scored 0–100. Each bar is that input's sub-score; the figure is the points it added to the 100-point composite (weight × sub-score).
- Cash flow +30.0/30.0
- 1% rule +10.0/10.0
- DSCR +10.0/10.0
- ARV discount +7.5/15.0
- Appreciation +5.1/10.0
- Livability +3.7/5.0
- Schools +3.4/10.0
- Rent growth +2.5/5.0
- Condition / age +1.0/5.0
$34,900
🖨 Deal sheet (PDF) 📄 Offer letter ✓ Due diligence
Listing remarks
Opportunity awaits in Lee! Located at 155 Water Street #5, this mobile home has been fully gutted and is ready for a complete renovation. A true blank slate, offering endless potential for investors, contractors, or buyers looking to customize from the ground up. Major improvements have already been started, including a brand-new roof and new doors. Custom-sized windows have been purchased and are ready for installation, helping jumpstart the rehab process. Ideally situated near the Lee Premium Outlets, Tanglewood, Big Y, and Mass Turnpike, this property offers both convenience and strong upside potential. Perfect for a seasonal Berkshires retreat, rental investment, or year-round living. B
Key facts
- Fully gutted
- New doors
- Complete renovation
Tags
Neighborhood map
What this means for you Summary
Snapshot
- This is a 1-bed/?-bath manufactured listed at $35k. Condition is rated poor.
Deal economics
- At list price, monthly cash flow is $759 ($9k/yr) — positive.
- The deal already cash-flows at list — no discount required.
- Meets the 1% rule at list price ($1k rent vs $35k).
- Recommended offer: $34k (1.5% below list) — sets the bar for market timing.
- Cap rate 34.7% vs local median 2.1% in Lee — top-decile yield for the area; either an underpriced asset or a hidden risk that comps aren't pricing in. Stress-test before assuming the spread holds.
Location & tenants
- Location reads 74/100 on livability (#88 in MA, #4,582 nationally) — a middle-class / working-renter tenant base. Strengths: housing A+, health & safety A+, crime B+; Watch: cost of living C-, amenities F.
- Lee (town): math 31% / reading 47% proficiency, ranked #211 of 302 in MA (top 70%) — families likely to look elsewhere, expect single-tenant / working-renter base with shorter leases.
- Zoned schools: Lee Elementary (math 27% / reading 42%, grade F, #577 of 938 statewide, top 65%, 341 students, 0% FRL); Lee Middle/High School (math 37% / reading 57%, grade D-, #194 of 343 statewide, top 57%, 325 students, 0% FRL) — zoned schools average 0% FRL vs 28% district-wide (28 pts lower); this property's tenant base skews higher-income than the district average.
- Market conditions: 39 active listings in the ZIP; 130 units permitted in Berkshire County in 2024 (10 in 5+ unit buildings).
Forward outlook
- In year one you build about $292 of equity ($241 loan paydown + $51 appreciation (0.1% local appreciation)).
- Berkshire County population projected at -24% by 2050 — secular population decline; favor cash flow + early exit over multi-decade hold.
- At projected returns (0.1% appreciation + 3.0% rent growth), your $10k cash investment doubles in ~2 years — after that, you're playing with house money.
Negotiation context
- It's been on market 19 days — a 2% lower offer ($34k) is reasonable based on typical stale-listing flexibility.
Risks & watch-outs
- Watch-outs: flood insurance adds $66/mo; built in 1491 — expect roof / HVAC / electrical / plumbing capex.
- Climate carrying-cost: severe flood risk — expect insurance premiums to compound above CPI over the hold.
Questions for the listing agent
- Have any recent inspections been done? Can we get a copy of the seller's disclosures and any deferred-maintenance estimates?
- Built in 1491 — when were the roof, HVAC, electrical panel, plumbing, and water heater last replaced?
- What's the actual annual flood-insurance premium (NFIP or private), and is the property in a SFHA with mandatory coverage?
- Is there a deadline driving the sale (1031 exchange, divorce, estate, relocation)? That informs how much negotiation room exists.
- What's the average days-on-market for RENTAL listings here right now (not sales)? A rising rental-DOM trend means longer vacancies and softer asking-rent achievability than the comps imply.
- What's the recent tenant-quality profile in this submarket — average credit score on applications, eviction rate, late-payment / NSF rate, and stable-employment percentage? A property-management company in the area should have these aggregated.
- How much new for-sale + rental construction is in the pipeline within 1–3 miles? Heavy new supply typically softens prices + rents 12–24 months out; constrained supply supports both.
Investment metrics
- 1% rule
- 3.87% ✓
- Cap rate
- 34.67%
- Cash-on-cash
- 101.33%
- DSCR
- 5.51
- GRM
- 2.2
CMA / ARV
No comps found within radius.
Projected returns pro-forma
0.15% appreciation · 3.0% rent growth · sell at horizon
- IRR
- 95.8%
- Equity multiple
- 5.87×
- Total profit
- $47,605
- Equity at exit
- $10,389
- IRR
- 96.9%
- Equity multiple
- 12.13×
- Total profit
- $108,780
- Equity at exit
- $12,694
Cash invested: $9,772 (down + closing). Projections, not guarantees.
Landlord ↔ Tenant lean methodology
- Overall (STATE)
- 20 Strongly Tenant-Friendly
- State Massachusetts
- 20 Strongly Tenant-Friendly · D+15
- County
- — inherits STATE
- City
- — inherits STATE
ZIP-level market 01238
- Home prices YoY
- 0.1%
- Active inventory
- 39
- Price-to-rent
- 2.2×
Monthly cashflow live
- Estimated rent
- $1,350 medium interval (Pro) →
- Mortgage (P&I)
- −$183
- Tax est. 1.5%
- −$44 /mo · $524/yr
- Insurance
- −$15
- Flood insurance flood zone
- −$66 /mo · $798/yr
- HOA
- −$0
- Vacancy / Maint / Mgmt
- −$283
- Net cashflow
- $759
Break-even live
Sensitivity live
| Price | -10% $783 | -5% $771 | +0% $759 | +5% $747 | +10% $735 |
|---|---|---|---|---|---|
| Rent | -10% $652 | -5% $705 | +0% $759 | +5% $812 | +10% $865 |
| Rate | -1.0pp $776 | -0.5pp $768 | base $759 | +0.5pp $750 | +1.0pp $741 |
UW: 25.0% down · 7.5% · 30yr · 1.5% tax · 5.0% vac · 8.0% maint · 8.0% mgmt
Financing live
Cash to close
- Down payment
- $8,725
- Closing costs
- $1,047
- Reserves months
- —
- Total cash needed
- —
Loan-product check · same deal, 3 products live
Conventional
25% down · 7.5% · 30yr
- Down + closing
- —
- Monthly P&I
- —
- Monthly cashflow
- —
- DSCR
- —
- Eligible?
- —
Personal DTI + credit; lowest rate.
DSCR
20% down · 8.5% · 30yr
- Down + closing
- —
- Monthly P&I
- —
- Monthly cashflow
- —
- DSCR
- —
- Eligible?
- —
No personal income docs; deal must DSCR.
Hard money
10% down · 12.0% · 12mo
- Down + closing
- —
- Monthly P&I
- —
- Monthly cashflow
- —
- DSCR
- —
- Eligible?
- —
Short-term bridge; refi at stabilization.
Listing history 2 events
-
2026-04-08status Pending
-
2026-03-20$34,900 Active
ⓘ Source: listings_history table (triggers on properties + properties_extension) + one-shot
backfill from property_details.listing_events for pre-trigger history.
Climate risk First Street
- Flood 8/10 Severe FEMA zone X · 99% chance over 30 yrs
- Wildfire 3/10 Moderate
- Heat 3/10 Moderate 7 d/yr ≥91°F today · 16 d/yr by 30 yrs out
- Wind 4/10 Moderate 14% chance of damaging wind over 30 yrs
- Air quality 2/10 Low 1 unhealthy d/yr today · 1 by 30 yrs out
Nearby sold comps map
Loading sold comps map…
Walkable amenities ~0.75 mi
Loading nearby amenities…
Taxation est. · year 1
- Rental income
- $16,198
- − Mortgage interest
- −$1,955
- − Property taxes
- −$524
- − Insurance
- −$972
- − Repairs & maintenance
- −$1,296
- − Management
- −$1,296
- − Depreciation
- −$1,015
- Taxable income
- $9,141
- Est. tax owed @ 24.0%
- −$2,194
- After-tax cash flow
- $6,911/yr
For passive investors: Depreciation is non-cash, so a rental often shows a tax loss while cash-flowing — sheltering income. Rental losses are passive: they offset passive income freely, and up to $25,000/yr can offset ordinary (W-2) income if you actively participate and your MAGI is under $100k (phasing out to $0 by $150k); unused losses carry forward. On sale, claimed depreciation is recaptured at up to 25%, and gains may owe capital-gains tax (a 1031 exchange can defer both). Figures are a year-1 estimate at your 24.0% rate — not tax advice; consult a CPA.
Condition & rehab AI · 8 photos
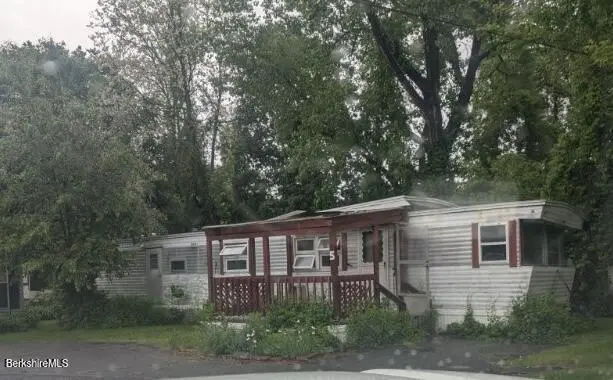
This mobile home has been gutted and requires extensive repairs and updates to bring it up to a livable condition. The home is in poor condition and requires a major renovation to improve its value.
Repairs flagged
- Major roof — The satellite image shows a metal roof in poor condition, and the listing mentions a new roof, but the satellite image suggests it may not be fully installed or in good condition.
- Major exterior siding — The satellite image shows a mobile home with a metal roof, which appears to be in poor condition.
- Major interior walls — The interior photos show exposed subflooring and framing, indicating that the interior walls have been removed or are in poor condition.
- Major bathrooms — The interior photos show exposed subflooring and framing, indicating that the bathrooms have been removed or are in poor condition.
- Major HVAC/mechanicals — The interior photos show exposed subflooring and framing, indicating that the HVAC and mechanical systems have been removed or are in poor condition.
Value-add opportunities
- Both New roof — A new roof will improve the home's appearance and functionality, making it more attractive for both resale and rental.
- Both New exterior siding — New exterior siding will improve the home's appearance and functionality, making it more attractive for both resale and rental.
- Both New interior walls — New interior walls will improve the home's appearance and functionality, making it more attractive for both resale and rental.
- Both New bathrooms — New bathrooms will improve the home's appearance and functionality, making it more attractive for both resale and rental.
- Both New HVAC/mechanical systems — New HVAC/mechanical systems will improve the home's functionality and energy efficiency, making it more attractive for both resale and rental.
Renovation cost estimate screening
| Repair item | Severity | Est. cost |
|---|---|---|
| roof · The satellite image shows a metal roof in poor condition, and the listing mentions a new roof, but the satellite image suggests it may not be fully installed or in good condition. | Major | $15,000–50,000 |
| exterior siding · The satellite image shows a mobile home with a metal roof, which appears to be in poor condition. | Major | $15,000–50,000 |
| interior walls · The interior photos show exposed subflooring and framing, indicating that the interior walls have been removed or are in poor condition. | Major | $15,000–50,000 |
| bathrooms · The interior photos show exposed subflooring and framing, indicating that the bathrooms have been removed or are in poor condition. | Major | $15,000–50,000 |
| HVAC/mechanicals · The interior photos show exposed subflooring and framing, indicating that the HVAC and mechanical systems have been removed or are in poor condition. | Major | $15,000–50,000 |
| Total estimated repair cost · 5 items | $75,000–250,000 |
Value-add ROI direction
- Both New roof — A new roof will improve the home's appearance and functionality, making it more attractive for both resale and rental. ↑
- Both New exterior siding — New exterior siding will improve the home's appearance and functionality, making it more attractive for both resale and rental. ↑
- Both New interior walls — New interior walls will improve the home's appearance and functionality, making it more attractive for both resale and rental. ↑
- Both New bathrooms — New bathrooms will improve the home's appearance and functionality, making it more attractive for both resale and rental. ↑
- Both New HVAC/mechanical systems — New HVAC/mechanical systems will improve the home's functionality and energy efficiency, making it more attractive for both resale and rental. ↑
ⓘ Cost ranges are severity-bucket heuristics (US national rule-of-thumb). Get contractor quotes + a written scope before underwriting a rehab budget.
Schools (NCES district)
- District
- Lee
- NCES district ID
- 2506690
- Math proficiency
- 31% ▼ -16.00%
- Reading proficiency
- 47% ▼ -5.00%
- Median HH income
- $58,112
- Composite
- 34.38/100
- National rank
- #5212
- State rank
- #211 of 302 in MA
Livability — Lee
- Score
- 74/100
- State rank
- #88
- US rank
- #4582
Category grades
Schools grade is shown separately in the Schools card above.
Census & demographics
- Population (ZIP)
- 5,893
Population outlook (Berkshire County) Hauer SSP2
- Today (2025)
- 119,723 people
- By 2030
- 114,608 · -4.3%
- By 2040
- 102,806 · -14.1%
- By 2050
- 91,305 · -23.7%
- By 2075
- 71,517 · -40.3%
- By 2100
- 57,988 · -51.6%
Race, ethnicity, and origin ACS 2023
- Neighborhood character
- Predominantly White (91%)
- Race & ethnicity
- White 91% Two or more races 4% Hispanic / Latino 3% Asian 2%
- Common ancestry
- Lithuanian 16% Romanian 6% Slovak 4%
- Foreign-born
- 7% · Canada
- Languages at home
- 94% English-only · Other Asian/Pacific 2% Spanish 2% Other Indo-European 2%
Political lean MEDSL · Berkshire
- 2024 margin
- Solid D (+39.9) · D 68.9% · R 29.0% · Other 2.1%
- 2008→2024 swing
- -12.5pp toward R · 2008: 52.4pp · 2024: 39.9pp
- All cycles
- 2024: D+39.9 2020: D+47.1 2016: D+41.5 2012: D+53.7 2008: D+52.4
Not yet ingested
- Civics
- —
Market trends
- HPI YoY
- ▲ 0.15%
- Current HPI
- 294.592
- Rent YoY
- —
- Metro
- —
- State GDP YoY
- ▲ 2.28%
- F500 in state
- 38
Industry mix (Fortune 500 HQ in MA)
| Industry | F500 HQs | Revenue |
|---|---|---|
| Technology | 3 | $17B |
|
||
| Insurance | 2 | $84B |
|
||
| Retail | 2 | $76B |
|
||
| Life Sciences | 1 | $43B |
|
||
| Energy Technology | 1 | $31B |
|
||
| Aerospace / Defense | 1 | $18B |
|
||
Price history
2 events — show timeline
- 2026-04-08 Pending — BCMLS
- 2026-03-20 Listed $34,900 BCMLS
Cash-flow waterfall
monthlySold comps — $/sqft
last 12 mo · ≤1 miLoading sold comps…