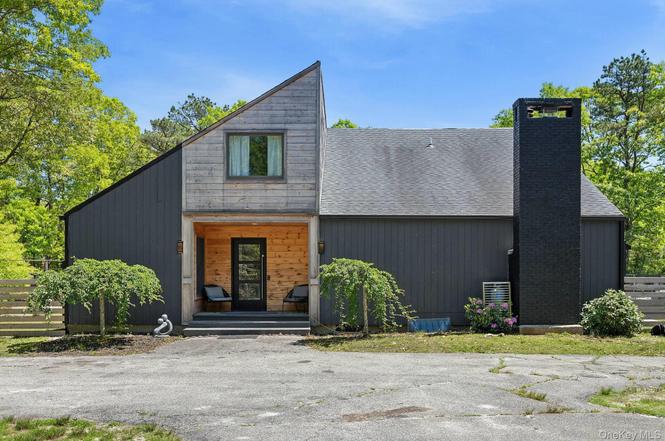
12 North Quarter Rd · Westhampton, NY
Flood risk 1/10 · Minimal
- FEMA flood zone
- X (unshaded)
- Chance of flooding over 30 yrs
- 0.0%
- Est. flood insurance / yr
- $473 – $860
Fire risk 1/10 · Minimal
- Est. fire insurance / yr
- $691 – $1,283
Heat risk 4/10 · Minor
- Hot days now (above 90°F)
- 7 days/yr
- Hot days in 30 yrs
- 18 days/yr
Wind risk 8/10 · Major
- Chance of severe wind over 30 yrs
- 80.0%
Air-quality risk 4/10 · Minor
- Unhealthy air days now
- 4 days/yr
- Unhealthy air days in 30 yrs
- 5 days/yr
Risk factors via First Street. Map © Google.
Why this score? — see what drove the B+ grade
The composite is a weighted blend of 9 inputs, each scored 0–100. Each bar is that input's sub-score; the figure is the points it added to the 100-point composite (weight × sub-score).
- Cash flow +29.5/30.0
- DSCR +10.0/10.0
- Appreciation +9.4/10.0
- ARV discount +7.5/15.0
- 1% rule +7.0/10.0
- Schools +6.6/10.0
- Livability +3.0/5.0
- Rent growth +2.5/5.0
- Condition / age +2.5/5.0
$1,850,000
🖨 Deal sheet 📄 Offer letter ✓ Due diligence
Listing remarks MLS
DESIGNED FOR ENHANCED RELAXED ENJOYMENT AND EFFORTLESS ENTERTAINING, INTERIOR DESIGNER'S OPEN CONCEPT CONTEMPORARY IS LOCATED ADJACENT TO A 3 ACRE PRESERVE. WARM, INVITING, COMFORTABLE, 5 BEDROOM HOME HAS FIRST FLOOR EN-SUITE MASTER WITH EGRESS TO POOL,DECK DECO TURF TENNIS , GUEST BR AND BA,OPEN KITCHEN- DINING- GREAT ROOM WITH FIREPLACE. SECOND FLOOR 3 BR, 1 BA. FULL BASEMENT WITH GAME ROOMS,LAUNDRY,WINE RM, DETACHED 2 CAR GARAGE. STRONG RENTAL HISTORY. PERFECT FOR PERSONAL USE OR INVESTMENT., Additional information: ExterioFeatures:Tennis,Interior Features:Lr/Dr
Key facts
- Open living spaces
- Tennis court
- En-suite bath
Tags
Property features AI
Exterior
- Parking: Driveway; 2-car garage
- Utilities: Electricity connected; Sewer: other
- Home design: Single family residence
- Construction: Frame construction
- Exterior features: Private pool; Not waterfront
Interior
- Kitchen: Cooktop; Dishwasher; Refrigerator
- Bedrooms: Bedroom on the first floor
- Bathrooms: 3 full bathrooms
- Heating & cooling: Baseboard heating; Wall/window AC units
- Interior features: First-floor bedroom; First-floor full bathroom; Built-in features; Chef's kitchen; Double vanity; Eat-in kitchen; Full basement, partially finished; Crawl attic; 10 total rooms
- Laundry & utility: Dryer
Neighborhood map
What this means for you Summary
Snapshot
- This is a 4-bed/3.0-bath single-family listed at $1.85M.
Deal economics
- At list price, monthly cash flow is $7k ($79k/yr) — positive.
- The deal already cash-flows at list — no discount required.
- Meets the 1% rule at list price ($22k rent vs $1.85M).
Location & tenants
- Location reads 60/100 on livability (#969 in NY) — a middle-class / working-renter tenant base. Strengths: crime A+, employment A+; Watch: housing C-, amenities F, commute F.
- Westhampton Beach Union Free School District (suburban): math 72% / reading 75% proficiency, ranked #81 of 590 in NY (top 14%) — strong family-tenant draw, lease renewals of 3-5y typical.
- Zoned schools: Westhampton Beach Elementary School (math 67% / reading 67%, grade B+, #525 of 2,108 statewide, top 27%, 356 students, 43% FRL); Westhampton Middle School (math 61% / reading 63%, grade B+, #136 of 729 statewide, top 20%, 434 students, 26% FRL); Westhampton Beach Senior High School (math 90% / reading 96%, grade A+, #147 of 1,100 statewide, top 14%, 964 students, 24% FRL).
- Market conditions: 63 active listings in the ZIP; 5 comparable units currently listed for rent nearby; rentals at typical pace (median 19d on market — plan ~3-4 weeks tenant-placement turnaround); 40% of comp listings sitting > 30 days — soft ceiling on asking rent; high-income renter base; 1,366 units permitted in Suffolk County in 2024 (216 in 5+ unit buildings).
- At $22,108/mo this rent would consume 175% of the median local household income ($151k/yr) — very limited rent-growth headroom before tenants either downsize or default.
Forward outlook
- In year one you build about $176k of equity ($13k loan paydown + $163k appreciation (8.8% local appreciation)).
- Suffolk County population projected to shrink 5% by 2050 — rents likely to lag national; underwrite the cash flow, not the appreciation.
- At projected returns (8.8% appreciation + 3.0% rent growth), your $518k cash investment doubles in ~2 years — after that, you're playing with house money.
- By year 2, paydown + projected appreciation supports a ~$282k cash-out refi (75% LTV) — recoverable capital for the next deal without selling this one.
Negotiation context
- Only 9 days on market — expect competitive offers; lowballing is unlikely to land.
- 5 sale attempts since 7y ago with the ask held roughly flat each time — persistent listings suggest the price (not the market) is what's stuck; bring a comps-based counter.
- Current owner paid $900k; list at $1.85M implies a 106% gain — meaningful room to come down on a strong offer.
Risks & watch-outs
- Climate carrying-cost: severe wind risk, 80% chance of damaging wind over 30y — expect insurance premiums to compound above CPI over the hold.
Questions for the listing agent
- Is there a deadline driving the sale (1031 exchange, divorce, estate, relocation)? That informs how much negotiation room exists.
- Schools are D-rated, which usually means shorter tenancies and higher turnover. Who's the typical renter profile here, and what's been the actual vacancy rate?
- What's the average days-on-market for RENTAL listings here right now (not sales)? A rising rental-DOM trend means longer vacancies and softer asking-rent achievability than the comps imply.
- What's the recent tenant-quality profile in this submarket — average credit score on applications, eviction rate, late-payment / NSF rate, and stable-employment percentage? A property-management company in the area should have these aggregated.
- How much new for-sale + rental construction is in the pipeline within 1–3 miles? Heavy new supply typically softens prices + rents 12–24 months out; constrained supply supports both.
Investment metrics
- 1% rule
- 1.20% ✓
- Cap rate
- 10.57%
- Cash-on-cash
- 15.29%
- DSCR
- 1.68
- GRM
- 7.0
CMA / ARV
- ARV (on-the-fly)
- $1,171,320
- Comps found
- 5
Show comp detail 5 sales within ~0.75 mi
| Address | Dist | Beds/Ba | Sqft | Sold | Price | $/sf | Match |
|---|---|---|---|---|---|---|---|
| 38 Columbia Ave | 0.54mi | 3/2.0 (-1) | 1,700 (-1%) | 0mo | $975,000 | $574 | 64 |
| 6 Wintergreen Ln | 0.28mi | 3/2.0 (-1) | 1,947 (+13%) | 3mo | $1,200,000 | $616 | 54 |
| 23 Sweetgrass Rd | 0.38mi | 3/2.0 (-1) | 1,732 (+1%) | 22mo | $1,537,500 | $888 | 54 |
| 25 Raynor Dr | 0.53mi | 3/2.0 (-1) | 1,644 (-4%) | 21mo | $1,120,000 | $681 | 42 |
| 152 South Rd | 0.55mi | 4/2.0 | 1,506 (-12%) | 11mo | $1,216,000 | $807 | 41 |
Match score weights: distance 35% · size 25% · config 20% · recency 20%. Top-matched comps best support the ARV.
Projected returns pro-forma
8.82% appreciation · 3.0% rent growth · sell at horizon
- IRR
- 33.4%
- Equity multiple
- 3.47×
- Total profit
- $1,280,461
- Equity at exit
- $1,510,666
- IRR
- 29.3%
- Equity multiple
- 7.58×
- Total profit
- $3,410,372
- Equity at exit
- $3,104,939
Cash invested: $518,000 (down + closing). Projections, not guarantees.
Landlord ↔ Tenant lean methodology
- Overall (STATE)
- 15 Strongly Tenant-Friendly
- State New York
- 15 Strongly Tenant-Friendly · D+10
- County
- — inherits STATE
- City
- — inherits STATE
ZIP-level market 11977
- Home prices YoY
- 2.3%
- Active inventory
- 63
- Price-to-rent
- 7.0×
Monthly cashflow live
- Estimated rent
- $22,108 medium interval (Pro) →
- Mortgage (P&I)
- −$9,702
- Tax from tax record
- −$393 /mo · $4,712/yr
- Insurance
- −$771
- HOA
- −$0
- Vacancy / Maint / Mgmt
- −$4,643
- Net cashflow
- $6,600
Break-even live
UW: 25.0% down · 7.5% · 30yr · 1.5% tax · 5.0% vac · 8.0% maint · 8.0% mgmt
Financing live
Cash to close
- Down payment
- $462,500
- Closing costs
- $55,500
- Reserves months
- —
- Total cash needed
- —
Loan-product check · same deal, 3 products live
Conventional
25% down · 7.5% · 30yr
- Down + closing
- —
- Monthly P&I
- —
- Monthly cashflow
- —
- DSCR
- —
- Eligible?
- —
Personal DTI + credit; lowest rate.
DSCR
20% down · 8.5% · 30yr
- Down + closing
- —
- Monthly P&I
- —
- Monthly cashflow
- —
- DSCR
- —
- Eligible?
- —
No personal income docs; deal must DSCR.
Hard money
10% down · 12.0% · 12mo
- Down + closing
- —
- Monthly P&I
- —
- Monthly cashflow
- —
- DSCR
- —
- Eligible?
- —
Short-term bridge; refi at stabilization.
Rent comps 5 comps
| Address | Beds | Baths | Sqft | Rent | $/sqft | DOM | Units | Dist |
|---|---|---|---|---|---|---|---|---|
| 25 N Quarter Rd Westhampton, NY | 4.0 | 3.0 | 2000 | $30,000 | $15.00 | 16d | 1 | 0.26mi |
| 70 Tanners Neck Ln Westhampton, NY | 4.0 | 3.5 | 2100 | $20,000 | $9.52 | 43d | 1 | 0.30mi |
| 70 Jagger Ln Westhampton, NY | 3.0 | 2.0 | 1850 | $22,500 | $12.16 | 1d | 1 | 0.41mi |
| 19 Bishop Ave Westhampton, NY | 3.0 | 2.0 | 1514 | $15,000 | $9.91 | 18d | 1 | 0.83mi |
| 31 Liberty St Westhampton Beach, NY | 3.0 | 1.5 | 2000 | $40,000 | $20.00 | 43d | 1 | 1.46mi |
Listing history 6 events
-
2026-06-18days on market $1,850,000 Active 9 DOM
-
2026-06-17days on market $1,850,000 Active 8 DOM
-
2026-06-16days on market $1,850,000 Active 7 DOM
-
2026-06-15days on market $1,850,000 Active 6 DOM
-
2026-06-13remarks 699-char remark
-
2026-06-13$1,850,000 Active 4 DOM
ⓘ Source: listings_history table (triggers on properties + properties_extension) + one-shot
backfill from property_details.listing_events for pre-trigger history.
Tax reassessment forecast NY · Partial reset (capped growth)
- Current annual tax
- $4,712 · $393/mo
- Projected year-2 tax
- $17,988 · $1,499/mo
- Expected delta
- +$13,277/yr (+$1,106/mo · 281.8%)
ⓘ Screening estimate from a state-policy table — verify with the county assessor before closing.
Climate risk First Street
- Flood 1/10 Low FEMA zone X (unshaded) · 0% chance over 30 yrs
- Wildfire 1/10 Low
- Heat 4/10 Moderate 7 d/yr ≥90°F today · 18 d/yr by 30 yrs out
- Wind 8/10 Severe 80% chance of damaging wind over 30 yrs
- Air quality 4/10 Moderate 4 unhealthy d/yr today · 5 by 30 yrs out
Nearby sold comps map
Loading sold comps map…
Walkable amenities ~0.75 mi
Loading nearby amenities…
Taxation est. · year 1
- Rental income
- $265,291
- − Mortgage interest
- −$103,629
- − Property taxes
- −$4,712
- − Insurance
- −$9,250
- − Repairs & maintenance
- −$21,223
- − Management
- −$21,223
- − Depreciation
- −$53,818
- Taxable income
- $51,436
- Est. tax owed @ 24.0%
- −$12,345
- After-tax cash flow
- $66,854/yr
For passive investors: Depreciation is non-cash, so a rental often shows a tax loss while cash-flowing — sheltering income. Rental losses are passive: they offset passive income freely, and up to $25,000/yr can offset ordinary (W-2) income if you actively participate and your MAGI is under $100k (phasing out to $0 by $150k); unused losses carry forward. On sale, claimed depreciation is recaptured at up to 25%, and gains may owe capital-gains tax (a 1031 exchange can defer both). Figures are a year-1 estimate at your 24.0% rate — not tax advice; consult a CPA.
Schools (NCES district)
- District
- Westhampton Beach Union Free School District
- NCES district ID
- 3631020
- Math proficiency
- 72% ▼ -5.00%
- Reading proficiency
- 75% ▲ 3.00%
- Median HH income
- $88,137
- Composite
- 65.91/100
- National rank
- #444
- State rank
- #81 of 590 in NY
Livability — Westhampton
- Score
- 60/100
- State rank
- #969
- US rank
- #18972
Category grades
Schools grade is shown separately in the Schools card above.
Census & demographics
- Census place
- Westhampton, NY
- County
- Suffolk County · 679,920 people
- City population
- 2,843
- Metro
- New York-Newark-Jersey City, NY-NJ-PA
- Population (ZIP)
- 2,843
- Household income
- $151,375
- Rent vs Own
- Severe rent burden
- 14.0
Population outlook (Suffolk County) Hauer SSP2
- Today (2025)
- 1,505,262 people
- By 2030
- 1,498,318 · -0.5%
- By 2040
- 1,471,101 · -2.3%
- By 2050
- 1,424,848 · -5.3%
- By 2075
- 1,337,157 · -11.2%
- By 2100
- 1,217,720 · -19.1%
Race, ethnicity, and origin ACS 2023
- Neighborhood character
- Predominantly White (89%)
- Race & ethnicity
- White 89% Hispanic / Latino 5% Asian 3% Two or more races 2%
- Hispanic origin (detail)
- Common ancestry
- Scotch-Irish 3% Romanian 3% Subsaharan African 1%
- Foreign-born
- 11% · Canada, South Korea
- Languages at home
- 89% English-only · Spanish 5% Other Indo-European 4% Korean 2%
Political lean MEDSL · Suffolk
- 2024 margin
- Lean R (+10.0) · D 45.0% · R 55.0%
- 2008→2024 swing
- -16.0pp toward R · 2008: 6.0pp · 2024: -10.0pp
- All cycles
- 2024: R+10.0 2020: R+0.0 2016: R+8.2 2012: D+2.9 2008: D+6.0
Not yet ingested
- Civics
- —
Market trends
- HPI YoY
- ▲ 8.82%
- Current HPI
- 391.8868
- Rent YoY
- —
- Metro
- New York-Newark-Jersey City, NY-NJ-PA
- State GDP YoY
- ▲ 2.60%
- F500 in state
- 92
Industry mix (Fortune 500 HQ in NY)
| Industry | F500 HQs | Revenue |
|---|---|---|
| Financial Services | 10 | $950B |
|
||
| Consumer Goods | 9 | $162B |
|
||
| Insurance | 4 | $225B |
|
||
| Telecommunications | 2 | $144B |
|
||
| Pharmaceuticals | 2 | $112B |
|
||
| Media / Entertainment | 2 | $69B |
|
||
Price history
+678.9% since first listed18 events — show timeline
- 2026-06-09 Listed $1,850,000 OneKey® MLS as Distributed by MLS Grid
- 2026-02-05 Listing Removed — OneKey® MLS as Distributed by MLS Grid
- 2026-01-23 Price Changed $1,777,000 OneKey® MLS as Distributed by MLS Grid
- 2025-12-29 Price Changed $1,850,000 OneKey® MLS as Distributed by MLS Grid
- 2025-12-08 Price Changed $1,898,000 OneKey® MLS as Distributed by MLS Grid
- 2025-11-26 Price Changed $1,990,000 OneKey® MLS as Distributed by MLS Grid
- 2025-11-16 Price Changed $2,111,000 OneKey® MLS as Distributed by MLS Grid
- 2025-10-30 Price Changed $2,199,000 OneKey® MLS as Distributed by MLS Grid
- 2025-10-22 Listed $2,250,000 OneKey® MLS as Distributed by MLS Grid
- 2020-09-30 Sold (Public Records) $900,000 Public Records
- 2020-09-11 Sold (MLS) $900,000 OneKey® MLS as Distributed by MLS Grid
- 2020-09-11 Sold (MLS) $42,000 OneKey® MLS as Distributed by MLS Grid
- 2020-05-01 Listed $953,618 OneKey® MLS as Distributed by MLS Grid
- 2020-04-30 Listing Removed — OneKey® MLS as Distributed by MLS Grid
- 2019-10-01 Listed $966,318 OneKey® MLS as Distributed by MLS Grid
- 2019-08-01 Listing Removed — OneKey® MLS as Distributed by MLS Grid
- 2019-06-01 Listed $963,618 OneKey® MLS as Distributed by MLS Grid
- 1996-01-03 Sold (Public Records) $237,500 Public Records
Property tax history
-2.0%/yrLatest (2024): $4,712 · +0.0% YoY. Source: county tax records.
Cash-flow waterfall
monthlySold comps — $/sqft
last 12 mo · ≤1 miLoading sold comps…