 🏷️ Likely Rental
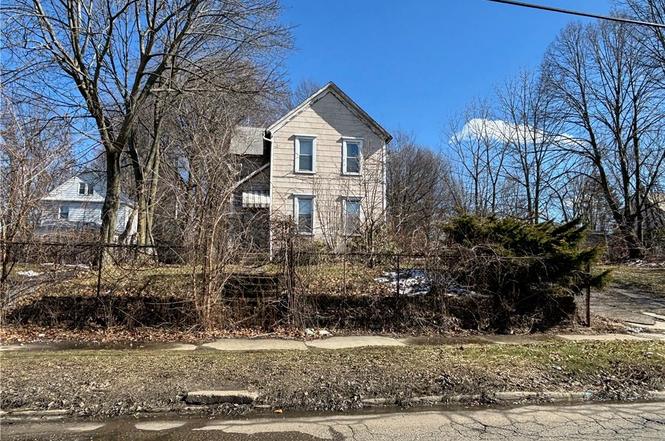
891 Grant St · Akron, OH
Flood risk 1/10 · Minimal
- FEMA flood zone
- X (unshaded)
- Chance of flooding over 30 yrs
- 0.0%
- Est. flood insurance / yr
- $473 – $860
Fire risk 1/10 · Minimal
- Est. fire insurance / yr
- $713 – $1,323
Heat risk 3/10 · Minor
- Hot days now (above 96°F)
- 7 days/yr
- Hot days in 30 yrs
- 17 days/yr
Wind risk 1/10 · Minimal
- Chance of severe wind over 30 yrs
- —
Air-quality risk 3/10 · Minor
- Unhealthy air days now
- 2 days/yr
- Unhealthy air days in 30 yrs
- 4 days/yr
Risk factors via First Street. Map © Google.
Why this score? — see what drove the D grade
The composite is a weighted blend of 9 inputs, each scored 0–100. Each bar is that input's sub-score; the figure is the points it added to the 100-point composite (weight × sub-score).
- Cash flow +15.0/30.0
- ARV discount +7.5/15.0
- 1% rule +5.0/10.0
- DSCR +5.0/10.0
- Livability +4.0/5.0
- Rent growth +2.5/5.0
- Condition / age +2.5/5.0
- Schools +2.1/10.0
- Appreciation +0.0/10.0
$10,000
🖨 Deal sheet (PDF) 📄 Offer letter ✓ Due diligence
Multi-family units
County records classify this as Multi-Family (2-4 Unit). Listing-text estimate: 1 unit. estimate disagrees with records
Listing remarks MLS
Exciting Investment Opportunity!! Investor liquidating rental property. This 2 unit building has all vinyl replacement windows & glass block in basement. $215/mo for up unit. call for your opportunity today.
Key facts
- 0.23 acre lot
- Parking
- Built 1913
Neighborhood map
What this means for you Summary
Snapshot
- This is a 3-bed/2.0-bath multifamily listed at $10k.
Deal economics
- At list price, monthly cash flow is $921 ($11k/yr) — positive.
- The deal already cash-flows at list — no discount required.
- Meets the 1% rule at list price ($1k rent vs $10k).
- Cap rate 116.9% vs local median 6.6% in Akron — top-decile yield for the area; either an underpriced asset or a hidden risk that comps aren't pricing in. Stress-test before assuming the spread holds.
Location & tenants
- Location reads 81/100 on livability (#104 in OH, #1,591 nationally) — a professional / high-income tenant draw. Strengths: amenities A+, commute A+, cost of living A+; Watch: crime F, employment F.
- Akron City (urban): math 22% / reading 30% proficiency, ranked #602 of 656 in OH (top 92%) — low school quality limits family demand, transient renter base, plan for 1-2y turnover; 66% free/reduced lunch — lower-income household profile, screen leases tightly.
- Market conditions: 54 active listings in the ZIP; 40 comparable units currently listed for rent nearby; rentals lingering (median 44d on market — plan ~5-8 weeks vacancy on turnover, expect pricing pressure); 60% of comp listings sitting > 30 days — soft ceiling on asking rent; lower-income renter base — watch delinquency; 1,114 units permitted in Summit County in 2024 (397 in 5+ unit buildings).
- At $1,254/mo this rent would consume 62% of the median local household income ($24k/yr) (locally 659% of renters already pay >50% of income on rent) — very limited rent-growth headroom before tenants either downsize or default.
Forward outlook
- Local home prices are declining (-3.0%/yr); year-one equity from $69 of loan paydown is wiped out by about $300 of value loss. Plan a longer hold.
- Summit County population projected to shrink 6% by 2050 — rents likely to lag national; underwrite the cash flow, not the appreciation.
- At projected returns (-3.0% appreciation + 3.0% rent growth), your $3k cash investment doubles in ~1 year — after that, you're playing with house money.
Negotiation context
- Only 8 days on market — expect competitive offers; lowballing is unlikely to land.
- 3 sale attempts since 34y ago with the ask held roughly flat each time — persistent listings suggest the price (not the market) is what's stuck; bring a comps-based counter.
Risks & watch-outs
- Watch-outs: built in 1913 — expect roof / HVAC / electrical / plumbing capex.
Questions for the listing agent
- Built in 1913 — when were the roof, HVAC, electrical panel, plumbing, and water heater last replaced?
- Is there a deadline driving the sale (1031 exchange, divorce, estate, relocation)? That informs how much negotiation room exists.
- Crime grade is F in this area — have there been break-ins, vandalism, or insurance claims at this property in the last 3 years? What carrier currently insures it and at what premium?
- The area grade is low — what's the realistic commute time and amenity access for the typical tenant pool here? Any planned neighborhood developments (good or bad) we should know about?
- What's the average days-on-market for RENTAL listings here right now (not sales)? A rising rental-DOM trend means longer vacancies and softer asking-rent achievability than the comps imply.
- What's the recent tenant-quality profile in this submarket — average credit score on applications, eviction rate, late-payment / NSF rate, and stable-employment percentage? A property-management company in the area should have these aggregated.
- How much new apartment / multifamily construction is in the pipeline within 1–3 miles? Heavy new supply (>2% of stock underway) typically softens rents 12–24 months out; light construction supports rent growth.
Investment metrics
- 1% rule
- 12.54% ✓
- Cap rate
- 116.86%
- Cash-on-cash
- 394.89%
- DSCR
- 18.57
- GRM
- 0.7
CMA / ARV
- ARV (on-the-fly)
- $96,200
- Comps found
- 4
Show comp detail 4 sales within ~0.75 mi
| Address | Dist | Beds/Ba | Sqft | Sold | Price | $/sf | Match |
|---|---|---|---|---|---|---|---|
| 841 Grant St | 0.10mi | 3/2.0 | 1,550 (+5%) | 5mo | $40,000 | $26 | 83 |
| 394 E South St | 0.32mi | 3/2.0 | 1,392 (-6%) | 5mo | $92,000 | $66 | 71 |
| 584 Sherman St | 0.59mi | 4/2.0 (+1) | 1,648 (+11%) | 15mo | $73,500 | $45 | 36 |
| 573 Allyn St | 0.63mi | 4/2.0 (+1) | 1,674 (+13%) | 22mo | $109,000 | $65 | 26 |
Match score weights: distance 35% · size 25% · config 20% · recency 20%. Top-matched comps best support the ARV.
Projected returns pro-forma
-3.0% appreciation · 3.0% rent growth · sell at horizon
- IRR
- —
- Equity multiple
- 21.39×
- Total profit
- $57,084
- Equity at exit
- $1,491
- IRR
- —
- Equity multiple
- 45.77×
- Total profit
- $125,351
- Equity at exit
- $865
Cash invested: $2,800 (down + closing). Projections, not guarantees.
Landlord ↔ Tenant lean methodology
- Overall (STATE)
- 73 Landlord-Friendly
- State Ohio
- 73 Landlord-Friendly · R+6
- County
- — inherits STATE
- City
- — inherits STATE
ZIP-level market 44311
- Home prices YoY
- -28.4%
- Active inventory
- 54
- Price-to-rent
- 0.7×
Monthly cashflow live
- Estimated rent
- $1,254 high interval (Pro) →
- Mortgage (P&I)
- −$52
- Tax est. 1.5%
- −$12 /mo · $150/yr
- Insurance
- −$4
- HOA
- −$0
- Vacancy / Maint / Mgmt
- −$263
- Net cashflow
- $921
Break-even live
Sensitivity live
| Price | -10% $928 | -5% $925 | +0% $921 | +5% $918 | +10% $914 |
|---|---|---|---|---|---|
| Rent | -10% $822 | -5% $872 | +0% $921 | +5% $971 | +10% $1,020 |
| Rate | -1.0pp $926 | -0.5pp $924 | base $921 | +0.5pp $919 | +1.0pp $916 |
UW: 25.0% down · 7.5% · 30yr · 1.5% tax · 5.0% vac · 8.0% maint · 8.0% mgmt
Financing live
Cash to close
- Down payment
- $2,500
- Closing costs
- $300
- Reserves months
- —
- Total cash needed
- —
Loan-product check · same deal, 3 products live
Conventional
25% down · 7.5% · 30yr
- Down + closing
- —
- Monthly P&I
- —
- Monthly cashflow
- —
- DSCR
- —
- Eligible?
- —
Personal DTI + credit; lowest rate.
DSCR
20% down · 8.5% · 30yr
- Down + closing
- —
- Monthly P&I
- —
- Monthly cashflow
- —
- DSCR
- —
- Eligible?
- —
No personal income docs; deal must DSCR.
Hard money
10% down · 12.0% · 12mo
- Down + closing
- —
- Monthly P&I
- —
- Monthly cashflow
- —
- DSCR
- —
- Eligible?
- —
Short-term bridge; refi at stabilization.
Rent comps 40 comps
| Address | Beds | Baths | Sqft | Rent | $/sqft | DOM | Units | Dist |
|---|---|---|---|---|---|---|---|---|
| 1139 Marcy St Akron, OH | 4.0 | 1.5 | 1300 | $1,300 | $1.00 | 44d | 1 | 0.25mi |
| 907 Kling St Akron, OH | 3.0 | 1.0 | 1248 | $1,250 | $1.00 | 14d | 1 | 0.36mi |
| 374 E Voris St Akron, OH | 3.0 | 1.0 | 876 | $1,150 | $1.31 | 24d | 1 | 0.41mi |
| 796 Brown St Akron, OH | 4.0 | 2.0 | 1200 | $900 | $0.75 | 44d | 1 | 0.42mi |
| 885 Brown St Akron, OH | 4.0 | 2.0 | 1280 | $1,400 | $1.09 | 24d | 1 | 0.44mi |
| 662 Sumner St Akron, OH | 2.0 | 1.0 | 915 | $999 | $1.09 | 44d | 1 | 0.46mi |
| 1028 Kling St Akron, OH | 4.0 | 2.0 | 1500 | $1,450 | $0.97 | 44d | 1 | 0.46mi |
| 658 Sumner St Akron, OH | 2.0 | 1.0 | 915 | $999 | $1.09 | 44d | 1 | 0.47mi |
| 1012 Brown St Akron, OH | 4.0 | 2.0 | 1518 | $1,295 | $0.85 | 44d | 1 | 0.52mi |
| 1282 Andrus St Akron, OH | 4.0 | 1.0 | 1242 | $1,195 | $0.96 | 44d | 1 | 0.53mi |
| 600 Sherman St Akron, OH | 4.0 | 1.0–2.0 | 824 | $1,400 | $1.70 | 14d | 14 | 0.53mi |
| 288 Cross St Akron, OH | 4.0 | 2.0 | 1512 | $1,295 | $0.86 | 44d | 1 | 0.59mi |
| 466 Adkins Ave Akron, OH | 4.0 | 1.5 | 1800 | $1,450 | $0.81 | 44d | 1 | 0.59mi |
| 1200 Girard St Akron, OH | 3.0 | 2.0 | 1438 | $1,100 | $0.76 | 14d | 1 | 0.61mi |
| 566 Sumner St Akron, OH | 4.0 | 1.0 | 1170 | $1,200 | $1.03 | 44d | 1 | 0.63mi |
| 629 Morgan Ave Akron, OH | 2.0 | 1.0 | 960 | $1,200 | $1.25 | 44d | 1 | 0.67mi |
| 979 Neptune Ave Akron, OH | 3.0 | 1.0 | 1248 | $1,250 | $1.00 | 24d | 1 | 0.69mi |
| 1368 Moore St Akron, OH | 4.0 | 1.0 | 1575 | $1,300 | $0.83 | 44d | 1 | 0.70mi |
| 548 Spicer St Akron, OH | 4.0 | 2.0 | 1487 | $1,100 | $0.74 | 24d | 1 | 0.71mi |
| 356 Rankin St Akron, OH | 4.0 | 1.5 | 1186 | $1,197 | $1.01 | 24d | 1 | 0.71mi |
| 1085 Herberich Ave Akron, OH | 4.0 | 1.0 | 1350 | $1,400 | $1.04 | 44d | 1 | 0.72mi |
| 1036 Neptune Ave Akron, OH | 3.0 | 1.0 | 1000 | $1,350 | $1.35 | 44d | 1 | 0.73mi |
| 1040 Neptune Ave Akron, OH | 4.0 | 1.0 | 1400 | $1,300 | $0.93 | 44d | 1 | 0.74mi |
| 1114 Herberich Ave Akron, OH | 4.0 | 1.0 | 1308 | $1,200 | $0.92 | 44d | 1 | 0.76mi |
| 418 Power St Akron, OH | 3.0 | 1.0 | 1000 | $999 | $1.00 | 24d | 1 | 0.80mi |
| 1298 Bellows St Akron, OH | 3.0 | 1.0 | 1300 | $1,250 | $0.96 | 44d | 1 | 0.80mi |
| 420 Power St Akron, OH | 3.0 | 1.0 | 900 | $800 | $0.89 | 24d | 1 | 0.81mi |
| 1102 Neptune Ave Akron, OH | 3.0 | 1.0 | 1000 | $1,200 | $1.20 | 44d | 1 | 0.82mi |
| 147 Brighton Dr Akron, OH | 3.0 | 1.0 | 1040 | $1,350 | $1.30 | 24d | 1 | 0.82mi |
| 461 Spicer St Akron, OH | 3.0 | 2.0 | 1000 | $995 | $0.99 | 44d | 1 | 0.86mi |
| 287 Wheeler St Akron, OH | 3.0 | 1.0 | 1100 | $1,350 | $1.23 | 24d | 1 | 0.86mi |
| 94 Brighton Dr Akron, OH | 3.0 | 1.0 | 1000 | $1,100 | $1.10 | 44d | 1 | 0.87mi |
| 455 Spicer St Akron, OH | 2.0 | 1.0 | 1872 | $975 | $0.52 | 14d | 1 | 0.87mi |
| 490 Gage St Akron, OH | 4.0 | 1.0 | 1326 | $1,053 | $0.79 | 44d | 1 | 0.89mi |
| 67 E Archwood Ave Unit B Akron, OH | 4.0 | 1.0 | 1200 | $1,050 | $0.88 | 44d | 1 | 0.91mi |
| 67 E Archwood Ave Unit A Akron, OH | 2.0 | 1.0 | 1000 | $850 | $0.85 | 44d | 1 | 0.91mi |
| 406 Sumner St Akron, OH | 2.0–4.0 | 1.0–2.0 | 836 | $1,085 | $1.30 | 14d | 3 | 0.91mi |
| 530 S Main St Akron, OH | 1.0–2.0 | 1.0–2.0 | 937 | $2,195 | $2.34 | 44d | 2 | 0.95mi |
| 78 E Mapledale Ave Akron, OH | 4.0 | 1.5 | 1600 | $1,500 | $0.94 | 14d | 1 | 0.98mi |
| 783 Boulevard St Akron, OH | 4.0 | 1.0 | 1440 | $999 | $0.69 | 24d | 1 | 1.00mi |
Listing history 8 events
-
2026-03-11status Pending
-
2026-03-02$10,000 Active
-
2003-12-31soldstatus $20,000 213-char remark
Show marketing remark (213 chars)
Exciting Investment Opportunity!! Investor liquidating rental property. This 2 unit building has all vinyl replacement windows & glass block in basement. $215/mo for up unit. call for your opportunity today.
-
2003-12-31soldstatus $20,000
Show marketing remark (213 chars)
Exciting Investment Opportunity!! Investor liquidating rental property. This 2 unit building has all vinyl replacement windows & glass block in basement. $215/mo for up unit. call for your opportunity today.
-
2003-08-20$24,500 213-char remark
Show marketing remark (213 chars)
Exciting Investment Opportunity!! Investor liquidating rental property. This 2 unit building has all vinyl replacement windows & glass block in basement. $215/mo for up unit. call for your opportunity today.
-
1993-04-06soldstatus $35,000
-
1992-09-22$39,900
-
1989-07-31soldstatus $45,000
ⓘ Source: listings_history table (triggers on properties + properties_extension) + one-shot
backfill from property_details.listing_events for pre-trigger history.
Climate risk First Street
- Flood 1/10 Low FEMA zone X (unshaded) · 0% chance over 30 yrs
- Wildfire 1/10 Low
- Heat 3/10 Moderate 7 d/yr ≥96°F today · 17 d/yr by 30 yrs out
- Wind 1/10 Low
- Air quality 3/10 Moderate 2 unhealthy d/yr today · 4 by 30 yrs out
Nearby sold comps map
Loading sold comps map…
Walkable amenities ~0.75 mi
Loading nearby amenities…
Taxation est. · year 1
- Rental income
- $15,046
- − Mortgage interest
- −$560
- − Property taxes
- −$150
- − Insurance
- −$50
- − Repairs & maintenance
- −$1,204
- − Management
- −$1,204
- − Depreciation
- −$291
- Taxable income
- $11,587
- Est. tax owed @ 24.0%
- −$2,781
- After-tax cash flow
- $8,276/yr
For passive investors: Depreciation is non-cash, so a rental often shows a tax loss while cash-flowing — sheltering income. Rental losses are passive: they offset passive income freely, and up to $25,000/yr can offset ordinary (W-2) income if you actively participate and your MAGI is under $100k (phasing out to $0 by $150k); unused losses carry forward. On sale, claimed depreciation is recaptured at up to 25%, and gains may owe capital-gains tax (a 1031 exchange can defer both). Figures are a year-1 estimate at your 24.0% rate — not tax advice; consult a CPA.
Schools (NCES district)
- District
- Akron City
- NCES district ID
- 3904348
- Math proficiency
- 22% ▼ -17.00%
- Reading proficiency
- 30% ▼ -12.00%
- Median HH income
- $33,811
- Composite
- 21.31/100
- National rank
- #8383
- State rank
- #602 of 656 in OH
Livability — Akron
- Score
- 81/100
- State rank
- #104
- US rank
- #1591
Category grades
Schools grade is shown separately in the Schools card above.
Census & demographics
- Census place
- Akron, OH
- County
- Summit County · 440,783 people
- City population
- 174,375
- Metro
- Akron, OH
- Population (ZIP)
- 7,547
- Household income
- $24,369
- Rent vs Own
- Severe rent burden
- 659.0
Population outlook (Summit County) Hauer SSP2
- Today (2025)
- 546,583 people
- By 2030
- 544,028 · -0.5%
- By 2040
- 531,363 · -2.8%
- By 2050
- 514,923 · -5.8%
- By 2075
- 481,765 · -11.9%
- By 2100
- 432,265 · -20.9%
Race, ethnicity, and origin ACS 2023
- Neighborhood character
- Diverse neighborhood (Simpson 0.60)
- Race & ethnicity
- White 53% Black 35% Two or more races 6% Hispanic / Latino 4% Asian 3%
- Common ancestry
- Lithuanian 2% Romanian 2% Slovak 2%
- Foreign-born
- 3% · Canada, Vietnam, Philippines
- Languages at home
- 95% English-only · Spanish 2% Other Asian/Pacific 1% Other Indo-European 1%
Political lean MEDSL · Summit
- 2024 margin
- Lean D (+7.0) · D 53.0% · R 46.0%
- 2008→2024 swing
- -9.6pp toward R · 2008: 16.6pp · 2024: 7.0pp
- All cycles
- 2024: D+7.0 2020: D+9.6 2016: D+8.2 2012: D+14.8 2008: D+16.6
Not yet ingested
- Civics
- —
Market trends
- HPI YoY
- ▼ -39.01%
- Current HPI
- 98.3809
- Rent YoY
- —
- Metro
- Akron, OH
- State GDP YoY
- ▲ 1.98%
- F500 in state
- 48
Industry mix (Fortune 500 HQ in OH)
| Industry | F500 HQs | Revenue |
|---|---|---|
| Insurance | 3 | $145B |
|
||
| Industrial Machinery | 3 | $49B |
|
||
| Financial Services | 3 | $24B |
|
||
| Consumer Goods | 2 | $93B |
|
||
| Aerospace / Defense | 2 | $47B |
|
||
| Utilities | 2 | $33B |
|
||
Price history
-77.8% since first listed8 events — show timeline
- 2026-03-11 Pending — MLSNOW
- 2026-03-02 Listed $10,000 MLSNOW
- 2003-12-31 Sold (Public Records) $20,000 Public Records
- 2003-12-31 Sold (MLS) $20,000 MLSNOW
- 2003-08-20 Listed $24,500 MLSNOW
- 1993-04-06 Sold (Public Records) $35,000 Public Records
- 1992-09-22 Listed $39,900 MLSNOW
- 1989-07-31 Sold (Public Records) $45,000 Public Records
Property tax history
+18.2%/yrLatest (2025): $9,183 · +614.7% YoY. Source: county tax records.
Cash-flow waterfall
monthlySold comps — $/sqft
last 12 mo · ≤1 miLoading sold comps…