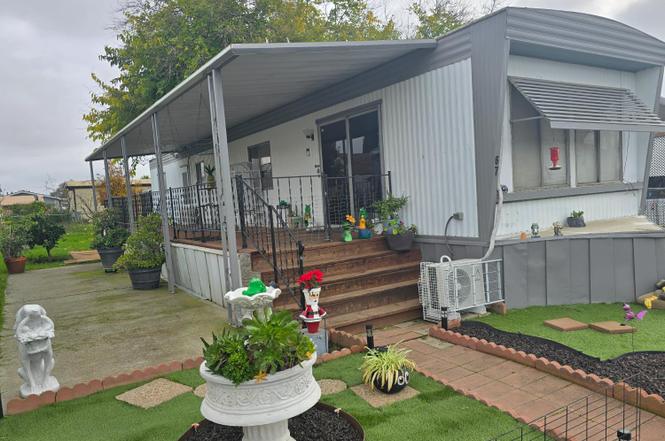
67 Village Green Dr #67 · Sacramento, CA
Flood risk 1/10 · Minimal
- FEMA flood zone
- X (unshaded)
- Chance of flooding over 30 yrs
- 0.0%
- Est. flood insurance / yr
- $507 – $1,088
Fire risk 1/10 · Minimal
- Est. fire insurance / yr
- $659 – $1,223
Heat risk 7/10 · Major
- Hot days now (above 102°F)
- 7 days/yr
- Hot days in 30 yrs
- 15 days/yr
Wind risk 1/10 · Minimal
- Chance of severe wind over 30 yrs
- —
Air-quality risk 10/10 · Severe
- Unhealthy air days now
- 33 days/yr
- Unhealthy air days in 30 yrs
- 38 days/yr
Risk factors via First Street. Map © Google.
Why this score? — see what drove the B+ grade
The composite is a weighted blend of 9 inputs, each scored 0–100. Each bar is that input's sub-score; the figure is the points it added to the 100-point composite (weight × sub-score).
- Cash flow +30.0/30.0
- ARV discount +15.0/15.0
- 1% rule +10.0/10.0
- DSCR +10.0/10.0
- Livability +3.6/5.0
- Schools +3.2/10.0
- Condition / age +2.5/5.0
- Rent growth +1.8/5.0
- Appreciation +0.0/10.0
$64,900
🖨 Deal sheet (PDF) 📄 Offer letter ✓ Due diligence
Listing remarks
Reduced to Sell Now!! Very Affordable Living in Gated All-Ages Park Close to Downtown Sacramento. Very rare Extra-Large Lot with Huge Covered Porch for Relaxing. Newer Vinyl plank Floors, 2 Mini-Split Heat & AC systems. Home is 60ft Long with Front Living Room surrounded by Windows and Rear Main Bedroom with Full wall of Closets. Kitchen has Plenty of Cabinets and Counters, Stainless Appliances incl a 5 Burner Gas Stove & Microwave hood. Smaller 2nd Bedroom perfect for Office, Kids or Craft Room. Large Bath has a Stall Shower and Hookups for W/ D. Extra-Large Lot with Fenced Back Yard and plenty of Room for Gardens & your own Landscaping. Park has Large Clubhouse with Swim
Key facts
- Extra-large lot
- Rear main bedroom
- Huge covered porch
Tags
Property features AI
Finance
- Other: Located in Sacramento, CA (postal code 95838); Directions available to unit in park
- Financial info: Land lease: No
- HOA & community: No homeowners association; Not a senior community
Exterior
- Parking: Attached covered parking; Off-street parking
- Utilities: Individual electric meter; Individual gas meter; Public sewer; Water from water district / public; Internet available
- Home design: Manufactured in park (single wide); Skyline manufactured home; Built in 1966; Metal roof; Metal skirting
- Construction: Metal roof; Metal skirting; Single wide manufactured construction
- Exterior features: Fenced yard with backyard; Dog run; Storage area and shed(s); Carport awning and porch awning
Interior
- Kitchen: Free standing gas range; Free standing refrigerator; Microwave; Laminate countertops
- Bedrooms: 2 bedrooms (including master bedroom)
- Flooring: Simulated wood; Laminate
- Bathrooms: 1 full bathroom with shower stall
- Heating & cooling: Central heating; Ductless heating (multi-unit); Wall cooling units; Ductless cooling (multi-unit)
- Interior features: Updated/remodeled interior; Covered deck and porch; Office; Living room with attached deck; Dining space in kitchen; Laminate countertops
- Laundry & utility: Washer/dryer hookups inside
Neighborhood map
What this means for you Summary
Snapshot
- This is a 2-bed/1.0-bath manufactured listed at $65k.
Deal economics
- At list price, monthly cash flow is $646 ($8k/yr) — positive.
- The deal already cash-flows at list — no discount required.
- Meets the 1% rule at list price ($1k rent vs $65k).
- Recommended offer: $57k (12.0% below list) — sets the bar for market timing.
- Cap rate 18.2% vs local median 3.0% in Sacramento — top-decile yield for the area; either an underpriced asset or a hidden risk that comps aren't pricing in. Stress-test before assuming the spread holds.
Location & tenants
- Location reads 71/100 on livability (#218 in CA) — a middle-class / working-renter tenant base. Strengths: amenities A+, commute A+, housing A; Watch: crime F, cost of living F.
- Robla Elementary (urban): math 29% / reading 38% proficiency, ranked #923 of 1,400 in CA (top 66%) — families likely to look elsewhere, expect single-tenant / working-renter base with shorter leases; 77% free/reduced lunch — lower-income household profile, screen leases tightly.
- Zoned schools: Bell Avenue Elementary (416 students, 88% FRL).
- Market conditions: Rents soft (-2.7%/yr); 164 active listings in the ZIP; 14 comparable units currently listed for rent nearby; rentals at typical pace (median 19d on market — plan ~3-4 weeks tenant-placement turnaround); 6,825 units permitted in Sacramento County in 2024 (1,752 in 5+ unit buildings).
Forward outlook
- Local home prices are declining (-3.0%/yr); year-one equity from $449 of loan paydown is wiped out by about $2k of value loss. Plan a longer hold.
- Sacramento County population projected at +17% by 2050 — long-run rental-demand tailwind backs the buy-and-hold thesis.
- At projected returns (-3.0% appreciation + 0.0% rent growth), your $18k cash investment doubles in ~3 years — after that, you're playing with house money.
Negotiation context
- It's been on market 182 days — a 12% lower offer ($57k) is reasonable based on typical stale-listing flexibility.
Risks & watch-outs
- Climate carrying-cost: extreme-heat days projected 7→15/yr by 2055 (HVAC capex compounding) — expect insurance premiums to compound above CPI over the hold.
Questions for the listing agent
- It's been on market 182 days. Have you received any prior offers? Is the seller open to a 12% concession, seller financing, or rate buy-down credit?
- Built in 1966 — when were the roof, HVAC, electrical panel, plumbing, and water heater last replaced?
- Why hasn't it sold? Are there any deal-killer items the seller is aware of (foundation, flood, title, zoning, code violations)?
- Is there a deadline driving the sale (1031 exchange, divorce, estate, relocation)? That informs how much negotiation room exists.
- Schools are D-rated, which usually means shorter tenancies and higher turnover. Who's the typical renter profile here, and what's been the actual vacancy rate?
- Crime grade is F in this area — have there been break-ins, vandalism, or insurance claims at this property in the last 3 years? What carrier currently insures it and at what premium?
- What's the average days-on-market for RENTAL listings here right now (not sales)? A rising rental-DOM trend means longer vacancies and softer asking-rent achievability than the comps imply.
- What's the recent tenant-quality profile in this submarket — average credit score on applications, eviction rate, late-payment / NSF rate, and stable-employment percentage? A property-management company in the area should have these aggregated.
- How much new for-sale + rental construction is in the pipeline within 1–3 miles? Heavy new supply typically softens prices + rents 12–24 months out; constrained supply supports both.
Investment metrics
- 1% rule
- 2.13% ✓
- Cap rate
- 18.24%
- Cash-on-cash
- 42.66%
- DSCR
- 2.90
- GRM
- 3.9
CMA / ARV
- ARV (on-the-fly)
- $86,400
- Comps found
- 8
Show comp detail 8 sales within ~0.75 mi
| Address | Dist | Beds/Ba | Sqft | Sold | Price | $/sf | Match |
|---|---|---|---|---|---|---|---|
| 113 Village Cir | 0.12mi | 2/1.0 | 720 (0%) | 14mo | $18,000 | $25 | 82 |
| 107 Village Cir | 0.09mi | 2/1.0 | 784 (+9%) | 1mo | $94,000 | $120 | 80 |
| 123 Village Cir | 0.16mi | 2/2.0 | 720 (0%) | 10mo | $75,000 | $104 | 80 |
| 116 Village Cir | 0.12mi | 2/1.0 | 672 (-7%) | 9mo | $100,000 | $149 | 76 |
| 107 Village Cir #107 | 0.10mi | 2/1.0 | 784 (+9%) | 18mo | $94,900 | $121 | 66 |
| 121 Village Cir #121 | 0.15mi | 2/1.0 | 784 (+9%) | 18mo | $94,900 | $121 | 64 |
| 186 Village Cir | 0.14mi | 2/2.0 | 800 (+11%) | 9mo | $75,000 | $94 | 63 |
| 93 Village Cir | 0.05mi | 2/1.5 | 816 (+13%) | 14mo | $68,000 | $83 | 62 |
Match score weights: distance 35% · size 25% · config 20% · recency 20%. Top-matched comps best support the ARV.
Projected returns pro-forma
-3.0% appreciation · 0.0% rent growth · sell at horizon
- IRR
- 36.0%
- Equity multiple
- 2.46×
- Total profit
- $26,587
- Equity at exit
- $9,677
- IRR
- 41.1%
- Equity multiple
- 4.33×
- Total profit
- $60,524
- Equity at exit
- $5,611
Cash invested: $18,172 (down + closing). Projections, not guarantees.
Landlord ↔ Tenant lean methodology
- Overall (STATE)
- 18 Strongly Tenant-Friendly
- State California
- 18 Strongly Tenant-Friendly · D+13
- County
- — inherits STATE
- City
- — inherits STATE
ZIP-level market 95838
- Rents YoY
- -2.7%
- Active inventory
- 164
- Price-to-rent
- 3.9×
Monthly cashflow live
- Estimated rent
- $1,385 high interval (Pro) →
- Mortgage (P&I)
- −$340
- Tax est. 1.5%
- −$81 /mo · $974/yr
- Insurance
- −$27
- HOA
- −$0
- Vacancy / Maint / Mgmt
- −$291
- Net cashflow
- $646
Break-even live
Sensitivity live
| Price | -10% $691 | -5% $668 | +0% $646 | +5% $624 | +10% $601 |
|---|---|---|---|---|---|
| Rent | -10% $537 | -5% $591 | +0% $646 | +5% $701 | +10% $755 |
| Rate | -1.0pp $679 | -0.5pp $662 | base $646 | +0.5pp $629 | +1.0pp $612 |
UW: 25.0% down · 7.5% · 30yr · 1.5% tax · 5.0% vac · 8.0% maint · 8.0% mgmt
Financing live
Cash to close
- Down payment
- $16,225
- Closing costs
- $1,947
- Reserves months
- —
- Total cash needed
- —
Loan-product check · same deal, 3 products live
Conventional
25% down · 7.5% · 30yr
- Down + closing
- —
- Monthly P&I
- —
- Monthly cashflow
- —
- DSCR
- —
- Eligible?
- —
Personal DTI + credit; lowest rate.
DSCR
20% down · 8.5% · 30yr
- Down + closing
- —
- Monthly P&I
- —
- Monthly cashflow
- —
- DSCR
- —
- Eligible?
- —
No personal income docs; deal must DSCR.
Hard money
10% down · 12.0% · 12mo
- Down + closing
- —
- Monthly P&I
- —
- Monthly cashflow
- —
- DSCR
- —
- Eligible?
- —
Short-term bridge; refi at stabilization.
Rent comps 14 comps
| Address | Beds | Baths | Sqft | Rent | $/sqft | DOM | Units | Dist |
|---|---|---|---|---|---|---|---|---|
| 2125 North Ave Sacramento, CA | 1.0 | 1.0 | 650 | $1,150 | $1.77 | 22d | 1 | 0.38mi |
| 2125 North Ave Sacramento, CA | 1.0 | 1.0 | 650 | $1,095 | $1.68 | 9d | 1 | 0.38mi |
| 2125 North Ave Sacramento, CA | 1.0 | 1.0 | 650 | $1,195 | $1.84 | 0d | 1 | 0.38mi |
| 2011 Bell Ave Unit B Sacramento, CA | 1.0 | 1.0 | 550 | $1,045 | $1.90 | 25d | 1 | 0.38mi |
| 2101 Bell Ave Unit 4 Sacramento, CA | 1.0 | 1.0 | 550 | $995 | $1.81 | 21d | 1 | 0.40mi |
| 3721 Balsam St Unit 4 Sacramento, CA | 1.0 | 1.0 | 450 | $1,300 | $2.89 | 3d | 1 | 0.67mi |
| 3707 1/2 Marysville Blvd Sacramento, CA | 1.0 | 1.0 | 750 | $1,395 | $1.86 | 45d | 1 | 0.68mi |
| 1367 Harris Ave Sacramento, CA | 2.0 | 1.0 | 600 | $1,650 | $2.75 | 3d | 1 | 0.76mi |
| 3901 Cypress St Unit 921 Harris Sacramento, CA | 2.0 | 1.0 | 700 | $1,950 | $2.79 | 45d | 1 | 1.24mi |
| 3729 Branch St Unit 1 Sacramento, CA | 2.0 | 1.0 | 680 | $1,300 | $1.91 | 3d | 1 | 1.25mi |
| 1550 Arcade Blvd Unit 12 Sacramento, CA | 1.0 | 1.0 | 450 | $1,100 | $2.44 | 19d | 1 | 1.29mi |
| 3120 Howe Ave Sacramento, CA | 1.0 | 1.0 | 725 | $1,350 | $1.86 | 25d | 1 | 1.44mi |
| 3101 Truax Ct Sacramento, CA | 1.0–2.0 | 1.0 | 667 | $1,495 | $2.24 | 9d | 4 | 1.48mi |
| 2315 Edison Ave #3 Sacramento, CA | 1.0 | 1.0 | 600 | $1,225 | $2.04 | 4d | 1 | 1.48mi |
Listing history 13 events
-
2026-06-21days on market $64,900 Active 182 DOM
-
2026-06-18days on market $64,900 Active 179 DOM
-
2026-06-17days on market $64,900 Active 178 DOM
-
2026-06-16days on market $64,900 Active 177 DOM
-
2026-06-15days on market $64,900 Active 176 DOM
-
2026-06-13days on market $64,900 Active 174 DOM
-
2026-06-09days on market $64,900 Active 170 DOM
-
2026-06-08days on market $64,900 Active 169 DOM
-
2026-06-07days on market $64,900 Active 168 DOM
-
2026-06-03days on market $64,900 Active 164 DOM
-
2026-06-02days on market $64,900 Active 163 DOM
-
2026-06-01days on market $64,900 Active 162 DOM
-
2026-05-31days on market $64,900 Active 161 DOM
ⓘ Source: listings_history table (triggers on properties + properties_extension) + one-shot
backfill from property_details.listing_events for pre-trigger history.
Climate risk First Street
- Flood 1/10 Low FEMA zone X (unshaded) · 0% chance over 30 yrs
- Wildfire 1/10 Low
- Heat 7/10 Severe 7 d/yr ≥102°F today · 15 d/yr by 30 yrs out
- Wind 1/10 Low
- Air quality 10/10 Extreme 33 unhealthy d/yr today · 38 by 30 yrs out
Nearby sold comps map
Loading sold comps map…
Walkable amenities ~0.75 mi
Loading nearby amenities…
Taxation est. · year 1
- Rental income
- $16,625
- − Mortgage interest
- −$3,635
- − Property taxes
- −$974
- − Insurance
- −$324
- − Repairs & maintenance
- −$1,330
- − Management
- −$1,330
- − Depreciation
- −$1,888
- Taxable income
- $7,144
- Est. tax owed @ 24.0%
- −$1,715
- After-tax cash flow
- $6,037/yr
For passive investors: Depreciation is non-cash, so a rental often shows a tax loss while cash-flowing — sheltering income. Rental losses are passive: they offset passive income freely, and up to $25,000/yr can offset ordinary (W-2) income if you actively participate and your MAGI is under $100k (phasing out to $0 by $150k); unused losses carry forward. On sale, claimed depreciation is recaptured at up to 25%, and gains may owe capital-gains tax (a 1031 exchange can defer both). Figures are a year-1 estimate at your 24.0% rate — not tax advice; consult a CPA.
Schools (NCES district)
- District
- Robla Elementary
- NCES district ID
- 0633240
- Math proficiency
- 29% ▲ 1.00%
- Reading proficiency
- 38% ▲ 3.00%
- Median HH income
- $48,481
- Composite
- 31.64/100
- National rank
- #11126
- State rank
- #923 of 1400 in CA
Livability — Sacramento
- Score
- 71/100
- State rank
- #218
- US rank
- #6957
Category grades
Schools grade is shown separately in the Schools card above.
Census & demographics
- Census place
- Sacramento, CA
- County
- Sacramento County · 1,539,646 people
- City population
- 761,410
- Metro
- Sacramento-Roseville-Folsom, CA
- Population (ZIP)
- 40,677
- Household income
- $68,349
- Rent vs Own
- Severe rent burden
- 1834.0
Population outlook (Sacramento County) Hauer SSP2
- Today (2025)
- 1,660,763 people
- By 2030
- 1,732,990 · +4.3%
- By 2040
- 1,855,755 · +11.7%
- By 2050
- 1,941,335 · +16.9%
- By 2075
- 2,046,162 · +23.2%
- By 2100
- 1,961,444 · +18.1%
Race, ethnicity, and origin ACS 2023
- Neighborhood character
- Highly diverse neighborhood (Simpson 0.77)
- Race & ethnicity
- Hispanic / Latino 37% White 21% Asian 18% Two or more races 15% Black 13% Pacific Islander 2%
- Hispanic origin (detail)
- Mexican 33%
- Common ancestry
- Scotch-Irish 2% Subsaharan African 1% Scottish 1%
- Foreign-born
- 25% · Canada, Vietnam, China
- Languages at home
- 55% English-only · Spanish 22% Other Asian/Pacific 10% Other Indo-European 5%
Political lean MEDSL · Sacramento
- 2024 margin
- D (+19.7) · D 58.1% · R 38.4% · Other 3.5%
- 2008→2024 swing
- +0.7pp no change · 2008: 19.0pp · 2024: 19.7pp
- All cycles
- 2024: D+19.7 2020: D+25.3 2016: D+23.7 2012: D+16.3 2008: D+19.0
Not yet ingested
- Civics
- —
Market trends
- HPI YoY
- ▼ -391.80%
- Current HPI
- 415.1804
- Rent YoY
- ▼ -2.74%
- Metro
- Sacramento-Roseville-Folsom, CA
- State GDP YoY
- ▲ 3.21%
- F500 in state
- 116
Industry mix (Fortune 500 HQ in CA)
| Industry | F500 HQs | Revenue |
|---|---|---|
| Technology | 27 | $1,492B |
|
||
| Financial Services | 3 | $174B |
|
||
| Retail | 3 | $44B |
|
||
| Insurance | 3 | $26B |
|
||
| Media / Entertainment | 2 | $115B |
|
||
| Pharmaceuticals / Biotech | 2 | $62B |
|
||
Cash-flow waterfall
monthlySold comps — $/sqft
last 12 mo · ≤1 miLoading sold comps…