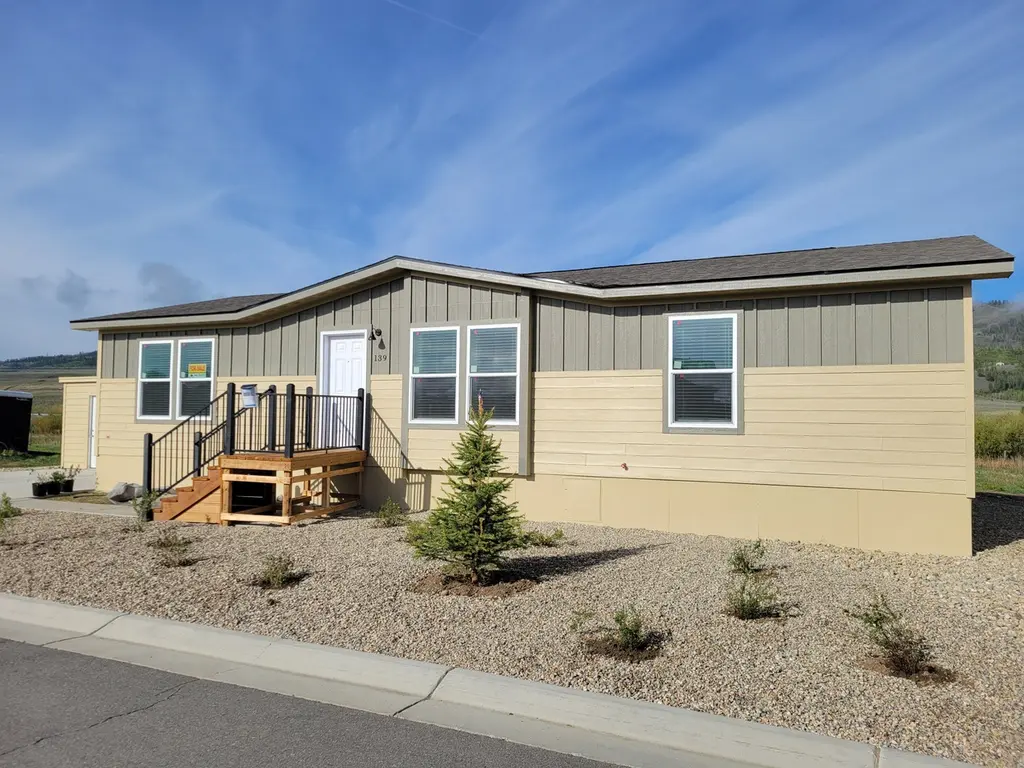
551 Summit Trail #139 Plan · Granby, CO
Flood risk 1/10 · Minimal
- FEMA flood zone
- D
- Chance of flooding over 30 yrs
- 0.0%
- Est. flood insurance / yr
- $544 – $1,084
Fire risk 5/10 · Moderate
- Est. fire insurance / yr
- $939 – $1,743
Heat risk No data
- Hot days now (above threshold)
- —
- Hot days in 30 yrs
- —
Wind risk 1/10 · Minimal
- Chance of severe wind over 30 yrs
- —
Air-quality risk 3/10 · Minor
- Unhealthy air days now
- 2 days/yr
- Unhealthy air days in 30 yrs
- 3 days/yr
Risk factors via First Street. Map © Google.
Why this score? — see what drove the B grade
The composite is a weighted blend of 9 inputs, each scored 0–100. Each bar is that input's sub-score; the figure is the points it added to the 100-point composite (weight × sub-score).
- Cash flow +30.0/30.0
- DSCR +10.0/10.0
- 1% rule +8.8/10.0
- ARV discount +7.5/15.0
- Schools +4.2/10.0
- Condition / age +4.0/5.0
- Livability +3.5/5.0
- Rent growth +2.5/5.0
- Appreciation +0.0/10.0
$199,995
🖨 Deal sheet 📄 Offer letter ✓ Due diligence
Listing remarks
Welcome home, to this beautiful 3 bedroom 2 bathroom. Located near a common space and backs up open space you will have plenty of space to enjoy the surrounding outdoors. This home has a large living room that feeds into a dining area featuring a large bay window. There is also a breakfast bar separating the kitchen and a corner pantry for all your kitchen storage. The kitchen comes with Whirlpool energy-efficient appliances and can lighting throughout. The primary bedroom includes a pass through bathroom that leads to the laundry area and back door and also features a large closet and large shower with glass doors. Each of the other two spare rooms have walkin closets and are located close
Key facts
- Listed 77 days
Property features AI
Finance
- Financial info: List price $221,995; Active listing
Exterior
- Home design: Plan home: 551 Summit Trail #139; Located at 551 Summit Trail #139, Granby, CO 80446
Interior
- Bedrooms: 3 bedrooms
- Bathrooms: 2 full bathrooms
- Interior features: Open living area (1,352 total living area)
Neighborhood map
What this means for you Summary
Snapshot
- This is a 3-bed/2.0-bath manufactured listed at $200k. Condition is rated good.
Deal economics
- At list price, monthly cash flow is $805 ($10k/yr) — positive.
- The deal already cash-flows at list — no discount required.
- Meets the 1% rule at list price ($3k rent vs $200k).
- Recommended offer: $188k (6.0% below list) — sets the bar for market timing.
- Cap rate 11.1% vs local median 1.4% in Granby — top-decile yield for the area; either an underpriced asset or a hidden risk that comps aren't pricing in. Stress-test before assuming the spread holds.
Location & tenants
- Location reads 70/100 on livability (#85 in CO) — a middle-class / working-renter tenant base. Strengths: crime A+, housing A+, employment B+; Watch: commute D+, amenities F, health & safety F.
- East Grand School District No. 2 (rural): math 36% / reading 58% proficiency, ranked #17 of 86 in CO (top 20%) — families likely to look elsewhere, expect single-tenant / working-renter base with shorter leases.
- Market conditions: 424 active listings in the ZIP; 294 units permitted in Grand County in 2024 (82 in 5+ unit buildings).
- This rent runs 44% of the median local income ($75k/yr) — at the standard rent-burdened threshold; future hikes will face affordability resistance.
Forward outlook
- Local home prices are declining (-3.0%/yr); year-one equity from $1k of loan paydown is wiped out by about $6k of value loss. Plan a longer hold.
- Grand County population projected at -16% by 2050 — secular population decline; favor cash flow + early exit over multi-decade hold.
- At projected returns (-3.0% appreciation + 3.0% rent growth), your $56k cash investment doubles in ~7 years — after that, you're playing with house money.
Negotiation context
- It's been on market 77 days — a 6% lower offer ($188k) is reasonable based on typical stale-listing flexibility.
Risks & watch-outs
- Climate carrying-cost: moderate wildfire risk — expect insurance premiums to compound above CPI over the hold.
Questions for the listing agent
- It's been on market 77 days. Have you received any prior offers? Is the seller open to a 6% concession, seller financing, or rate buy-down credit?
- Why hasn't it sold? Are there any deal-killer items the seller is aware of (foundation, flood, title, zoning, code violations)?
- Is there a deadline driving the sale (1031 exchange, divorce, estate, relocation)? That informs how much negotiation room exists.
- What's the average days-on-market for RENTAL listings here right now (not sales)? A rising rental-DOM trend means longer vacancies and softer asking-rent achievability than the comps imply.
- What's the recent tenant-quality profile in this submarket — average credit score on applications, eviction rate, late-payment / NSF rate, and stable-employment percentage? A property-management company in the area should have these aggregated.
- How much new for-sale + rental construction is in the pipeline within 1–3 miles? Heavy new supply typically softens prices + rents 12–24 months out; constrained supply supports both.
Investment metrics
- 1% rule
- 1.38% ✓
- Cap rate
- 11.13%
- Cash-on-cash
- 17.26%
- DSCR
- 1.77
- GRM
- 6.0
CMA / ARV
No comps found within radius.
Projected returns pro-forma
-3.0% appreciation · 3.0% rent growth · sell at horizon
- IRR
- 8.6%
- Equity multiple
- 1.34×
- Total profit
- $18,933
- Equity at exit
- $29,820
- IRR
- 17.8%
- Equity multiple
- 2.48×
- Total profit
- $82,711
- Equity at exit
- $17,292
Cash invested: $55,999 (down + closing). Projections, not guarantees.
Landlord ↔ Tenant lean methodology
- Overall (STATE)
- 38 Tenant-Leaning
- State Colorado
- 38 Tenant-Leaning · D+4
- County
- — inherits STATE
- City
- — inherits STATE
ZIP-level market 80446
- Home prices YoY
- -23.1%
- Active inventory
- 424
- Price-to-rent
- 6.0×
Monthly cashflow live
- Estimated rent
- $2,769 medium interval (Pro) →
- Mortgage (P&I)
- −$1,049
- Tax est. 1.5%
- −$250 /mo · $3,000/yr
- Insurance
- −$83
- HOA
- −$0
- Vacancy / Maint / Mgmt
- −$582
- Net cashflow
- $805
Break-even live
UW: 25.0% down · 7.5% · 30yr · 1.5% tax · 5.0% vac · 8.0% maint · 8.0% mgmt
Financing live
Cash to close
- Down payment
- $49,999
- Closing costs
- $6,000
- Reserves months
- —
- Total cash needed
- —
Loan-product check · same deal, 3 products live
Conventional
25% down · 7.5% · 30yr
- Down + closing
- —
- Monthly P&I
- —
- Monthly cashflow
- —
- DSCR
- —
- Eligible?
- —
Personal DTI + credit; lowest rate.
DSCR
20% down · 8.5% · 30yr
- Down + closing
- —
- Monthly P&I
- —
- Monthly cashflow
- —
- DSCR
- —
- Eligible?
- —
No personal income docs; deal must DSCR.
Hard money
10% down · 12.0% · 12mo
- Down + closing
- —
- Monthly P&I
- —
- Monthly cashflow
- —
- DSCR
- —
- Eligible?
- —
Short-term bridge; refi at stabilization.
Listing history 15 events
-
2026-06-18days on market $199,995 Active 77 DOM
-
2026-06-17days on market $199,995 Active 76 DOM
-
2026-06-16days on market $199,995 Active 75 DOM
-
2026-06-15days on market $199,995 Active 74 DOM
-
2026-06-14days on market $199,995 Active 72 DOM
-
2026-06-10days on market $199,995 Active 69 DOM
-
2026-06-09days on market $199,995 Active 68 DOM
-
2026-06-08days on market $199,995 Active 67 DOM
-
2026-06-07days on market $199,995 Active 66 DOM
-
2026-06-05days on market $199,995 Active 63 DOM
-
2026-06-03days on market $199,995 Active 62 DOM
-
2026-06-02days on market $199,995 Active 61 DOM
-
2026-06-01days on market $199,995 Active 60 DOM
-
2026-05-31days on market $199,995 Active 59 DOM
-
2026-05-31days on market $199,995 Active 58 DOM
ⓘ Source: listings_history table (triggers on properties + properties_extension) + one-shot
backfill from property_details.listing_events for pre-trigger history.
Climate risk First Street
- Flood 1/10 Low FEMA zone D · 0% chance over 30 yrs
- Wildfire 5/10 Major
- Wind 1/10 Low
- Air quality 3/10 Moderate 2 unhealthy d/yr today · 3 by 30 yrs out
Nearby sold comps map
Loading sold comps map…
Walkable amenities ~0.75 mi
Loading nearby amenities…
Taxation est. · year 1
- Rental income
- $33,229
- − Mortgage interest
- −$11,203
- − Property taxes
- −$3,000
- − Insurance
- −$1,000
- − Repairs & maintenance
- −$2,658
- − Management
- −$2,658
- − Depreciation
- −$5,818
- Taxable income
- $6,891
- Est. tax owed @ 24.0%
- −$1,654
- After-tax cash flow
- $8,011/yr
For passive investors: Depreciation is non-cash, so a rental often shows a tax loss while cash-flowing — sheltering income. Rental losses are passive: they offset passive income freely, and up to $25,000/yr can offset ordinary (W-2) income if you actively participate and your MAGI is under $100k (phasing out to $0 by $150k); unused losses carry forward. On sale, claimed depreciation is recaptured at up to 25%, and gains may owe capital-gains tax (a 1031 exchange can defer both). Figures are a year-1 estimate at your 24.0% rate — not tax advice; consult a CPA.
Condition & rehab AI · 6 photos
This manufactured home is in good condition with a good condition score of 80. It has a cosmetic rehab level and minimal repairs needed. The home has a good resale and rental value with updates like fresh paint and smart home features that can further increase its value.
Value-add opportunities
- Resale Paint exterior siding — Fresh paint can enhance curb appeal and home value.
- Rental Trim and mulch landscaping — Well-maintained landscaping can attract renters and improve curb appeal.
- Both Install smart home features — Smart home features can increase both resale and rental value by making the home more modern and convenient.
Renovation cost estimate screening
Value-add ROI direction
- Resale Paint exterior siding — Fresh paint can enhance curb appeal and home value. ↑
- Rental Trim and mulch landscaping — Well-maintained landscaping can attract renters and improve curb appeal. ↑
- Both Install smart home features — Smart home features can increase both resale and rental value by making the home more modern and convenient. ↑
ⓘ Cost ranges are severity-bucket heuristics (US national rule-of-thumb). Get contractor quotes + a written scope before underwriting a rehab budget.
Schools (NCES district)
- District
- East Grand School District No. 2
- NCES district ID
- 0804320
- Math proficiency
- 36% ▼ -2.00%
- Reading proficiency
- 58% ▲ 4.00%
- Median HH income
- $64,903
- Composite
- 41.64/100
- National rank
- #3424
- State rank
- #17 of 86 in CO
Livability — Granby
- Score
- 70/100
- State rank
- #85
- US rank
- #7574
Category grades
Schools grade is shown separately in the Schools card above.
Census & demographics
- County
- Grand County · 5,874 people
- City population
- 4,017
- Metro
- nan
- Population (ZIP)
- 4,017
- Household income
- $74,973
- Rent vs Own
- Severe rent burden
- 105.0
Population outlook (Grand County) Hauer SSP2
- Today (2025)
- 14,498 people
- By 2030
- 14,215 · -2.0%
- By 2040
- 13,225 · -8.8%
- By 2050
- 12,186 · -15.9%
- By 2075
- 10,196 · -29.7%
- By 2100
- 8,326 · -42.6%
Race, ethnicity, and origin ACS 2023
- Neighborhood character
- Predominantly White (79%)
- Race & ethnicity
- White 79% Two or more races 19% Hispanic / Latino 6%
- Hispanic origin (detail)
- Puerto Rican 2%
- Common ancestry
- Slovak 8% Portuguese 6% Romanian 2%
- Foreign-born
- 2% · Canada, Jamaica
- Languages at home
- 98% English-only · Russian/Polish/Slavic 1% French/Haitian/Cajun 1% Spanish 1%
Political lean MEDSL · Grand
- 2024 margin
- Toss-up / Even · D 48.0% · R 48.8% · Other 3.2%
- 2008→2024 swing
- +0.3pp no change · 2008: -1.1pp · 2024: -0.8pp
- All cycles
- 2024: R+0.8 2020: R+1.8 2016: R+13.5 2012: R+7.2 2008: R+1.1
Not yet ingested
- Civics
- —
Market trends
- HPI YoY
- ▼ -104.78%
- Current HPI
- 347.8691
- Rent YoY
- —
- Metro
- nan
- State GDP YoY
- ▲ 1.95%
- F500 in state
- 14
Industry mix (Fortune 500 HQ in CO)
| Industry | F500 HQs | Revenue |
|---|---|---|
| Technology Distribution | 1 | $31B |
|
||
| Food / Agriculture | 1 | $18B |
|
||
| Packaging | 1 | $14B |
|
||
| Healthcare | 1 | $13B |
|
||
| Energy | 1 | $10B |
|
||
| Technology | 1 | $4B |
|
||
Cash-flow waterfall
monthlySold comps — $/sqft
last 12 mo · ≤1 miLoading sold comps…