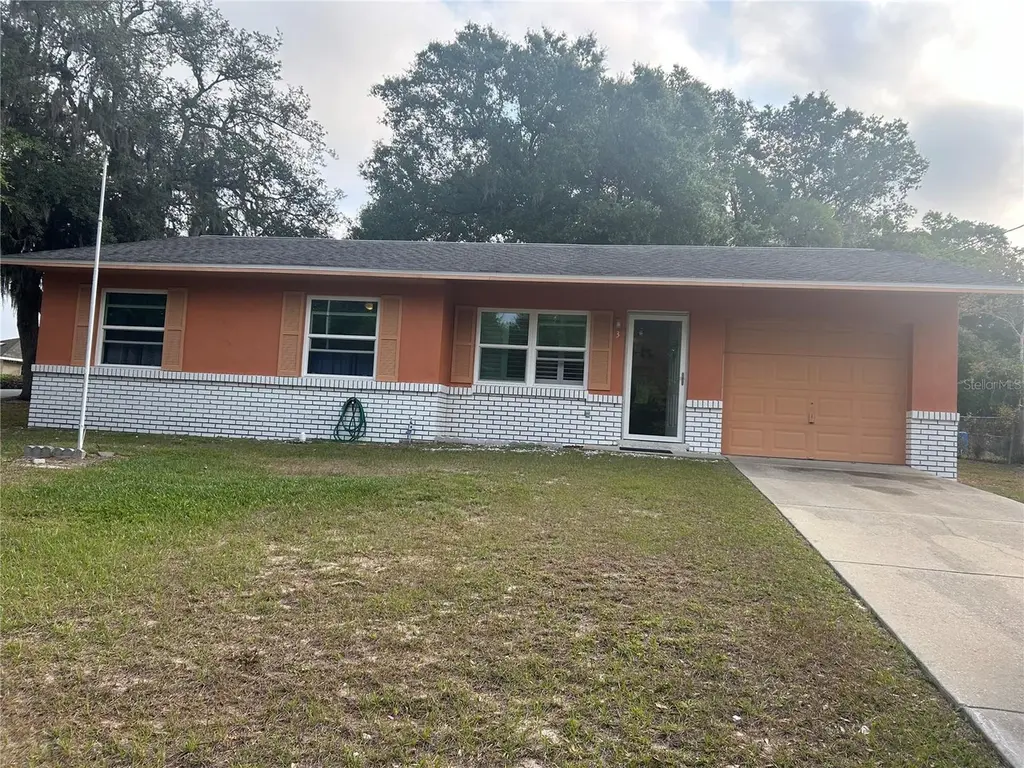
3 Juniper Pass Ln · Ocala, FL
Flood risk 1/10 · Minimal
- FEMA flood zone
- X (unshaded)
- Chance of flooding over 30 yrs
- 0.0%
- Est. flood insurance / yr
- $507 – $1,088
Fire risk 5/10 · Moderate
- Est. fire insurance / yr
- $947 – $1,759
Heat risk 8/10 · Major
- Hot days now (above 108°F)
- 7 days/yr
- Hot days in 30 yrs
- 19 days/yr
Wind risk 9/10 · Severe
- Chance of severe wind over 30 yrs
- 99.0%
Air-quality risk 3/10 · Minor
- Unhealthy air days now
- 3 days/yr
- Unhealthy air days in 30 yrs
- 4 days/yr
Risk factors via First Street. Map © Google.
Why this score? — see what drove the D grade
The composite is a weighted blend of 9 inputs, each scored 0–100. Each bar is that input's sub-score; the figure is the points it added to the 100-point composite (weight × sub-score).
- Cash flow +13.4/30.0
- ARV discount +9.8/15.0
- DSCR +4.0/10.0
- Schools +3.6/10.0
- Livability +3.5/5.0
- Rent growth +3.2/5.0
- 1% rule +2.8/10.0
- Condition / age +2.5/5.0
- Appreciation +0.0/10.0
$194,000
🖨 Deal sheet (PDF) 📄 Offer letter ✓ Due diligence
Listing remarks MLS
Nice investment property or first home. Corner lot, close to schools and either Ocala or Belleview. Currently rented but will be vacant Nov 1.
Key facts
- Newer roof
- High-impact windows
- Tile flooring
Tags
Property features AI
Finance
- Other: Property type: Residential, single family (zoned R1)
- HOA & community: No HOA/association
Exterior
- Parking: Attached garage (1 car)
- Utilities: Private well water; Septic tank; Electricity available; Cable available; Fiber optic available; Water connected
- Home design: Single family residence; One story; Homestead exempt; Faces west
- Construction: Shingle roof; Block foundation; Other construction materials; Built on a 0.23-acre lot (approx. 80 x 125)
- Exterior features: Cleared lot; Corner lot; Paved surfaces; Asphalt road access
Interior
- Kitchen: Range; Range hood; Refrigerator
- Bedrooms: 3 bedrooms
- Flooring: Ceramic tile
- Bathrooms: 1 full bathroom
- Heating & cooling: Central heating; Central air conditioning
- Interior features: Open floorplan; Solid surface counters; Solid wood cabinets; Programmable thermostat; Window treatments; Insulated windows; Shades; Shutters
- Laundry & utility: Washer hookup; Dryer hookup (electric); Laundry area in garage
Neighborhood map
What this means for you Summary
Snapshot
- This is a 3-bed/1.0-bath single-family listed at $194k.
Deal economics
- At list price, monthly cash flow is $4 ($44/yr) — positive.
- The deal already cash-flows at list — no discount required.
- To meet the 1% rule (rent ≥ 1% of price), the offer needs to be $151k (22.1% below list).
- Recommended offer: $151k (22.1% below list) — sets the bar for 1% rule.
- Cap rate 6.3% vs local median 4.1% in Ocala — top-decile yield for the area; either an underpriced asset or a hidden risk that comps aren't pricing in. Stress-test before assuming the spread holds.
Location & tenants
- Location reads 69/100 on livability (#476 in FL) — a middle-class / working-renter tenant base. Strengths: cost of living A+, housing A+, health & safety A+; Watch: crime F, amenities F, commute F.
- Marion (rural): math 42% / reading 43% proficiency, ranked #61 of 73 in FL (top 84%) — families likely to look elsewhere, expect single-tenant / working-renter base with shorter leases; 61% free/reduced lunch — lower-income household profile, screen leases tightly.
- Zoned schools: Emerald Shores Elementary School (math 30% / reading 34%, grade F, #1,797 of 2,144 statewide, top 86%, 666 students, 74% FRL); Belleview Middle School (math 49% / reading 50%, grade C, #259 of 571 statewide, top 46%, 1,573 students, 60% FRL); Lake Weir High School (math 23% / reading 34%, grade F, #458 of 667 statewide, top 69%, 1,483 students, 68% FRL).
- Market conditions: Rents rising (+2.8%/yr); 350 active listings in the ZIP; 18 comparable units currently listed for rent nearby; rentals at typical pace (median 23d on market — plan ~3-4 weeks tenant-placement turnaround); solid renter incomes; 7,071 units permitted in Marion County in 2024 (534 in 5+ unit buildings).
Forward outlook
- Local home prices are declining (-3.0%/yr); year-one equity from $1k of loan paydown is wiped out by about $6k of value loss. Plan a longer hold.
- Marion County population projected at +13% by 2050 — modest demand growth; plan on rents tracking national, not racing it.
Negotiation context
- It's been on market 51 days — a 3% lower offer ($188k) is reasonable based on typical stale-listing flexibility.
- 3 sale attempts since 10y ago with the ask held roughly flat each time — persistent listings suggest the price (not the market) is what's stuck; bring a comps-based counter.
- Current owner paid $78k; list at $194k implies a 149% gain — meaningful room to come down on a strong offer.
Risks & watch-outs
- Climate carrying-cost: severe wind risk, 99% chance of damaging wind over 30y; moderate wildfire risk; extreme-heat days projected 7→19/yr by 2055 (HVAC capex compounding) — expect insurance premiums to compound above CPI over the hold.
Questions for the listing agent
- It's been on market 51 days. Have you received any prior offers? Is the seller open to a 22% concession, seller financing, or rate buy-down credit?
- Is there a deadline driving the sale (1031 exchange, divorce, estate, relocation)? That informs how much negotiation room exists.
- Crime grade is F in this area — have there been break-ins, vandalism, or insurance claims at this property in the last 3 years? What carrier currently insures it and at what premium?
- The area grade is low — what's the realistic commute time and amenity access for the typical tenant pool here? Any planned neighborhood developments (good or bad) we should know about?
- What's the average days-on-market for RENTAL listings here right now (not sales)? A rising rental-DOM trend means longer vacancies and softer asking-rent achievability than the comps imply.
- What's the recent tenant-quality profile in this submarket — average credit score on applications, eviction rate, late-payment / NSF rate, and stable-employment percentage? A property-management company in the area should have these aggregated.
- How much new for-sale + rental construction is in the pipeline within 1–3 miles? Heavy new supply typically softens prices + rents 12–24 months out; constrained supply supports both.
Investment metrics
- 1% rule
- 0.78% ✗
- Cap rate
- 6.32%
- Cash-on-cash
- 0.08%
- DSCR
- 1.00
- GRM
- 10.7
CMA / ARV
- ARV (median comp)
- $204,353
- List price
- $194,000
- Delta
- -5.07%
- Verdict
- FAIR
- Comps
- 20 within 1.0 mi
Show comp detail 4 sales within ~0.75 mi
| Address | Dist | Beds/Ba | Sqft | Sold | Price | $/sf | Match |
|---|---|---|---|---|---|---|---|
| 15 Juniper Trail Cir | 0.30mi | 3/2.0 | 1,014 (-0%) | 6mo | $210,000 | $207 | 76 |
| 13 Juniper Trail Cir | 0.31mi | 2/2.0 (-1) | 1,011 (-1%) | 21mo | $200,000 | $198 | 58 |
| 14 Juniper Pass Ter | 0.40mi | 3/2.0 | 1,138 (+12%) | 5mo | $239,900 | $211 | 54 |
| 40 Juniper Pass Trak | 0.36mi | 3/2.0 | 1,155 (+14%) | 22mo | $225,000 | $195 | 38 |
Match score weights: distance 35% · size 25% · config 20% · recency 20%. Top-matched comps best support the ARV.
Projected returns pro-forma
-3.0% appreciation · 2.84% rent growth · sell at horizon
- IRR
- -16.4%
- Equity multiple
- 0.42×
- Total profit
- $-31,513
- Equity at exit
- $28,926
- IRR
- -8.4%
- Equity multiple
- 0.48×
- Total profit
- $-28,413
- Equity at exit
- $16,774
Cash invested: $54,320 (down + closing). Projections, not guarantees.
Landlord ↔ Tenant lean methodology
- Overall (STATE)
- 87 Strongly Landlord-Friendly
- State Florida
- 87 Strongly Landlord-Friendly · R+3
- County
- — inherits STATE
- City
- — inherits STATE
ZIP-level market 34480
- Home prices YoY
- -28.7%
- Rents YoY
- 2.8%
- Active inventory
- 350
- Price-to-rent
- 10.7×
Monthly cashflow live
- Estimated rent
- $1,511 high interval (Pro) →
- Mortgage (P&I)
- −$1,017
- Tax from tax record
- −$92 /mo · $1,103/yr
- Insurance
- −$81
- HOA
- −$0
- Vacancy / Maint / Mgmt
- −$317
- Net cashflow
- $4
Break-even live
Sensitivity live
| Price | -10% $114 | -5% $59 | +0% $4 | +5% $-51 | +10% $-106 |
|---|---|---|---|---|---|
| Rent | -10% $-116 | -5% $-56 | +0% $4 | +5% $63 | +10% $123 |
| Rate | -1.0pp $101 | -0.5pp $53 | base $4 | +0.5pp $-47 | +1.0pp $-98 |
UW: 25.0% down · 7.5% · 30yr · 1.5% tax · 5.0% vac · 8.0% maint · 8.0% mgmt
Financing live
Cash to close
- Down payment
- $48,500
- Closing costs
- $5,820
- Reserves months
- —
- Total cash needed
- —
Loan-product check · same deal, 3 products live
Conventional
25% down · 7.5% · 30yr
- Down + closing
- —
- Monthly P&I
- —
- Monthly cashflow
- —
- DSCR
- —
- Eligible?
- —
Personal DTI + credit; lowest rate.
DSCR
20% down · 8.5% · 30yr
- Down + closing
- —
- Monthly P&I
- —
- Monthly cashflow
- —
- DSCR
- —
- Eligible?
- —
No personal income docs; deal must DSCR.
Hard money
10% down · 12.0% · 12mo
- Down + closing
- —
- Monthly P&I
- —
- Monthly cashflow
- —
- DSCR
- —
- Eligible?
- —
Short-term bridge; refi at stabilization.
Rent comps 18 comps
| Address | Beds | Baths | Sqft | Rent | $/sqft | DOM | Units | Dist |
|---|---|---|---|---|---|---|---|---|
| 57 Juniper Pass Ocala, FL | 2.0 | 2.0 | 974 | $1,200 | $1.23 | 15d | 1 | 0.13mi |
| 18 Juniper Trl Ocala, FL | 3.0 | 2.0 | 1270 | $1,750 | $1.38 | 15d | 1 | 0.38mi |
| 7 Juniper Pass Way Ocala, FL | 3.0 | 2.0 | 1453 | $1,750 | $1.20 | 23d | 1 | 0.39mi |
| 28 Juniper Dr Ocala, FL | 3.0 | 2.0 | 1453 | $1,650 | $1.14 | 23d | 1 | 0.43mi |
| 123 Juniper Loop Ocala, FL | 3.0 | 2.0 | 1445 | $1,695 | $1.17 | 23d | 1 | 0.52mi |
| 50 Walnut Run Ocala, FL | 3.0 | 2.0 | 1287 | $1,795 | $1.39 | 15d | 1 | 0.53mi |
| 47 Walnut Run Ocala, FL | 2.0 | 2.0 | 974 | $1,235 | $1.27 | 15d | 1 | 0.59mi |
| 338 Larch Rd Ocala, FL | 3.0 | 2.0 | 1394 | $1,595 | $1.14 | 23d | 1 | 0.63mi |
| 52 Walnut Rd Ocala, FL | 2.0 | 2.0 | 969 | $1,175 | $1.21 | 15d | 1 | 0.64mi |
| 31 Walnut Run Ocala, FL | 2.0 | 2.0 | 974 | $1,200 | $1.23 | 15d | 1 | 0.65mi |
| 28 Poplar Run Ocala, FL | 3.0 | 2.0 | 1473 | $1,650 | $1.12 | 15d | 1 | 0.66mi |
| 60 Walnut Rd Ocala, FL | 2.0 | 2.0 | 969 | $1,200 | $1.24 | 23d | 1 | 0.66mi |
| 66 Laurel Pass Ocala, FL | 2.0 | 2.0 | 974 | $1,175 | $1.21 | 23d | 1 | 1.19mi |
| 11 Aspen Dr Ocala, FL | 3.0 | 2.0 | 1357 | $1,725 | $1.27 | 23d | 1 | 1.22mi |
| 58 Laurel Pass Ocala, FL | 2.0 | 2.0 | 1000 | $1,200 | $1.20 | 23d | 1 | 1.22mi |
| 54 Laurel Pass Ocala, FL | 2.0 | 2.0 | 1000 | $1,200 | $1.20 | 23d | 1 | 1.24mi |
| 23 Aspen Dr Ocala, FL | 3.0 | 2.0 | 1399 | $1,650 | $1.18 | 23d | 1 | 1.31mi |
| 139 Pine Crse Ocala, FL | 3.0 | 2.0 | 1398 | $1,645 | $1.18 | 15d | 1 | 1.48mi |
Listing history 25 events
-
2026-06-21days on market $194,000 Active 51 DOM
-
2026-06-18days on market $194,000 Active 48 DOM
-
2026-06-17days on market $194,000 Active 47 DOM
-
2026-06-16days on market $194,000 Active 46 DOM
-
2026-06-15days on market $194,000 Active 45 DOM
-
2026-06-14days on market $194,000 Active 43 DOM
-
2026-06-13days on market $194,000 Active 42 DOM
-
2026-06-10days on market $194,000 Active 40 DOM
-
2026-06-09days on market $194,000 Active 39 DOM
-
2026-06-08days on market $194,000 Active 38 DOM
-
2026-06-07days on market $194,000 Active 37 DOM
-
2026-06-03days on market $194,000 Active 33 DOM
-
2026-06-02days on market $194,000 Active 32 DOM
-
2026-06-01pricedays on market $194,000 Active 31 DOM
-
2026-05-31days on market $199,000 Active 30 DOM
-
2026-05-30days on market $199,000 Active 29 DOM
-
2026-05-01$199,000 Active 713-char remark
-
2017-12-15soldstatus $78,000 142-char remark
Show marketing remark (142 chars)
Nice investment property or first home. Corner lot, close to schools and either Ocala or Belleview. Currently rented but will be vacant Nov 1.
-
2017-12-15soldstatus $78,000
Show marketing remark (142 chars)
Nice investment property or first home. Corner lot, close to schools and either Ocala or Belleview. Currently rented but will be vacant Nov 1.
-
2017-10-16$84,900 142-char remark
Show marketing remark (142 chars)
Nice investment property or first home. Corner lot, close to schools and either Ocala or Belleview. Currently rented but will be vacant Nov 1.
-
2016-09-07soldstatus $65,100
-
2016-09-02soldstatus $65,000
Show marketing remark (130 chars)
Great concrete concrete block home. Nice corner lot. New AC Unit recently installed. One Car Garage. Call Agent for lock box code.
-
2016-05-13$69,999
Show marketing remark (130 chars)
Great concrete concrete block home. Nice corner lot. New AC Unit recently installed. One Car Garage. Call Agent for lock box code.
-
1992-04-01soldstatus $45,800
-
1991-11-01soldstatus $7,000
ⓘ Source: listings_history table (triggers on properties + properties_extension) + one-shot
backfill from property_details.listing_events for pre-trigger history.
Tax reassessment forecast FL · Resets to sale price
- Current annual tax
- $1,103 · $92/mo
- Projected year-2 tax
- $1,610 · $134/mo
- Expected delta
- +$507/yr (+$42/mo · 46.0%)
ⓘ Screening estimate from a state-policy table — verify with the county assessor before closing.
Climate risk First Street
- Flood 1/10 Low FEMA zone X (unshaded) · 0% chance over 30 yrs
- Wildfire 5/10 Major
- Heat 8/10 Severe 7 d/yr ≥108°F today · 19 d/yr by 30 yrs out
- Wind 9/10 Extreme 99% chance of damaging wind over 30 yrs
- Air quality 3/10 Moderate 3 unhealthy d/yr today · 4 by 30 yrs out
Nearby sold comps map
Loading sold comps map…
Walkable amenities ~0.75 mi
Loading nearby amenities…
Taxation est. · year 1
- Rental income
- $18,134
- − Mortgage interest
- −$10,867
- − Property taxes
- −$1,103
- − Insurance
- −$970
- − Repairs & maintenance
- −$1,451
- − Management
- −$1,451
- − Depreciation
- −$5,644
- Taxable loss
- −$3,351
- Est. tax savings @ 24.0%
- +$804
- After-tax cash flow
- $849/yr
For passive investors: Depreciation is non-cash, so a rental often shows a tax loss while cash-flowing — sheltering income. Rental losses are passive: they offset passive income freely, and up to $25,000/yr can offset ordinary (W-2) income if you actively participate and your MAGI is under $100k (phasing out to $0 by $150k); unused losses carry forward. On sale, claimed depreciation is recaptured at up to 25%, and gains may owe capital-gains tax (a 1031 exchange can defer both). Figures are a year-1 estimate at your 24.0% rate — not tax advice; consult a CPA.
Schools (NCES district)
- District
- Marion
- NCES district ID
- 1201260
- Math proficiency
- 42% ▼ -7.00%
- Reading proficiency
- 43% ▼ -4.00%
- Median HH income
- $40,015
- Composite
- 35.61/100
- National rank
- #4890
- State rank
- #61 of 73 in FL
Livability — Ocala
- Score
- 69/100
- State rank
- #476
- US rank
- #8461
Category grades
Schools grade is shown separately in the Schools card above.
Census & demographics
- County
- Marion County · 315,796 people
- City population
- 263,375
- Metro
- Ocala, FL
- Population (ZIP)
- 23,517
- Household income
- $77,557
- Rent vs Own
- Severe rent burden
- 169.0
Population outlook (Marion County) Hauer SSP2
- Today (2025)
- 365,905 people
- By 2030
- 376,768 · +3.0%
- By 2040
- 396,555 · +8.4%
- By 2050
- 412,723 · +12.8%
- By 2075
- 446,090 · +21.9%
- By 2100
- 436,193 · +19.2%
Race, ethnicity, and origin ACS 2023
- Neighborhood character
- Predominantly White (73%)
- Race & ethnicity
- White 73% Hispanic / Latino 15% Two or more races 11% Black 6% Asian 2%
- Hispanic origin (detail)
- Mexican 3% Puerto Rican 5% Cuban 2% Dominican 2%
- Common ancestry
- Italian 3% Slovak 3% Lithuanian 2%
- Foreign-born
- 6% · Canada
- Languages at home
- 89% English-only · Spanish 9% Other Asian/Pacific 1%
Political lean MEDSL · Marion
- 2024 margin
- Solid R (+31.6) · D 33.8% · R 65.5%
- 2008→2024 swing
- -20.0pp toward R · 2008: -11.6pp · 2024: -31.6pp
- All cycles
- 2024: R+31.6 2020: R+25.9 2016: R+26.2 2012: R+16.2 2008: R+11.6
Not yet ingested
- Civics
- —
Market trends
- HPI YoY
- ▼ -85.60%
- Current HPI
- 212.4262
- Rent YoY
- ▲ 2.84%
- Metro
- Ocala, FL
- State GDP YoY
- ▲ 3.28%
- F500 in state
- 36
Industry mix (Fortune 500 HQ in FL)
| Industry | F500 HQs | Revenue |
|---|---|---|
| Industrial Technology | 2 | $29B |
|
||
| Insurance | 2 | $17B |
|
||
| Retail | 1 | $60B |
|
||
| Technology Distribution | 1 | $58B |
|
||
| Homebuilding | 1 | $35B |
|
||
| Technology Manufacturing | 1 | $35B |
|
||
Price history
+2671.4% since first listed10 events — show timeline
- 2026-06-01 Price Changed $194,000 Stellar MLS as Distributed by MLS Grid
- 2026-05-01 Listed $199,000 Stellar MLS as Distributed by MLS Grid
- 2017-12-15 Sold (Public Records) $78,000 Public Records
- 2017-12-15 Sold (MLS) $78,000 Stellar MLS as Distributed by MLS Grid
- 2017-10-16 Listed $84,900 Stellar MLS as Distributed by MLS Grid
- 2016-09-07 Sold (Public Records) $65,100 Public Records
- 2016-09-02 Sold (MLS) $65,000 Stellar MLS as Distributed by MLS Grid
- 2016-05-13 Listed $69,999 Stellar MLS as Distributed by MLS Grid
- 1992-04-01 Sold (Public Records) $45,800 Public Records
- 1991-11-01 Sold (Public Records) $7,000 Public Records
Property tax history
+6.9%/yrLatest (2025): $1,103 · +24.7% YoY. Source: county tax records.
Cash-flow waterfall
monthlySold comps — $/sqft
last 12 mo · ≤1 miLoading sold comps…