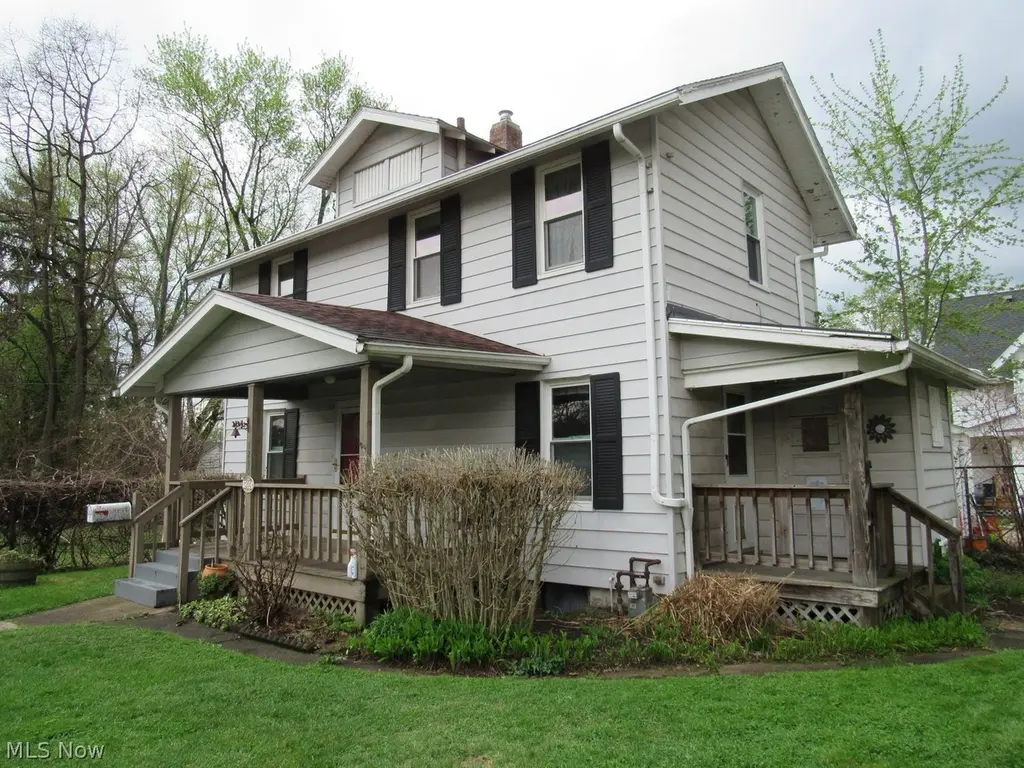
1200 Murray Ave · Akron, OH
Flood risk 1/10 · Minimal
- FEMA flood zone
- X (unshaded)
- Chance of flooding over 30 yrs
- 0.0%
- Est. flood insurance / yr
- $507 – $1,088
Fire risk 1/10 · Minimal
- Est. fire insurance / yr
- $713 – $1,323
Heat risk 3/10 · Minor
- Hot days now (above 97°F)
- 7 days/yr
- Hot days in 30 yrs
- 16 days/yr
Wind risk 1/10 · Minimal
- Chance of severe wind over 30 yrs
- —
Air-quality risk 3/10 · Minor
- Unhealthy air days now
- 2 days/yr
- Unhealthy air days in 30 yrs
- 4 days/yr
Risk factors via First Street. Map © Google.
Why this score? — see what drove the B- grade
The composite is a weighted blend of 9 inputs, each scored 0–100. Each bar is that input's sub-score; the figure is the points it added to the 100-point composite (weight × sub-score).
- Cash flow +25.8/30.0
- ARV discount +15.0/15.0
- DSCR +8.6/10.0
- 1% rule +7.2/10.0
- Livability +4.0/5.0
- Rent growth +3.7/5.0
- Condition / age +2.5/5.0
- Schools +2.1/10.0
- Appreciation +0.0/10.0
$91,000
🖨 Deal sheet 📄 Offer letter ✓ Due diligence
Listing remarks MLS
This two-bedroom one bath bungalow is a great home for first-time buyers or an investor who is looking for rental income. Situated in Akron's North Hill area, the home sits on a brick street and is close to highways, schools, and shopping. There are endless possibilities to make this home with a cozy front porch and side porch with shed into a great home! The furnace, air conditioning, windows, and roof have all been replaced in the last several years. And, the seller has recently replaced the carpeting in the living room and dining room. While there is no garage, there is plenty of parking in the long side-by-side driveway or on the street. The front yard is very large, and the home is set back from the street for privacy. You won't want to miss this opportunity!
Key facts
- Large front yard
- Set back from street
- Plenty of parking
Tags
Neighborhood map
What this means for you Summary
Snapshot
- This is a 2-bed/1.0-bath single-family listed at $91k.
Deal economics
- At list price, monthly cash flow is $220 ($3k/yr) — positive.
- The deal already cash-flows at list — no discount required.
- Meets the 1% rule at list price ($1k rent vs $91k).
- Recommended offer: $88k (3.0% below list) — sets the bar for market timing.
- Cap rate 9.2% vs local median 6.6% in Akron — top-decile yield for the area; either an underpriced asset or a hidden risk that comps aren't pricing in. Stress-test before assuming the spread holds.
Location & tenants
- Location reads 81/100 on livability (#104 in OH, #1,591 nationally) — a professional / high-income tenant draw. Strengths: amenities A+, commute A+, cost of living A+; Watch: crime F, employment F.
- Akron City (urban): math 22% / reading 30% proficiency, ranked #602 of 656 in OH (top 92%) — low school quality limits family demand, transient renter base, plan for 1-2y turnover; 66% free/reduced lunch — lower-income household profile, screen leases tightly.
- Market conditions: Rents rising fast (+4.8%/yr); 86 active listings in the ZIP; 19 comparable units currently listed for rent nearby; rentals at typical pace (median 24d on market — plan ~3-4 weeks tenant-placement turnaround); 47% of comp listings sitting > 30 days — soft ceiling on asking rent; lower-income renter base — watch delinquency; 1,114 units permitted in Summit County in 2024 (397 in 5+ unit buildings).
- This rent runs 32% of the median local income ($41k/yr) — at the standard rent-burdened threshold; future hikes will face affordability resistance.
Forward outlook
- Local home prices are declining (-3.0%/yr); year-one equity from $629 of loan paydown is wiped out by about $3k of value loss. Plan a longer hold.
- Summit County population projected to shrink 6% by 2050 — rents likely to lag national; underwrite the cash flow, not the appreciation.
- At projected returns (-3.0% appreciation + 4.8% rent growth), your $25k cash investment doubles in ~9 years — after that, you're playing with house money.
Negotiation context
- It's been on market 58 days — a 3% lower offer ($88k) is reasonable based on typical stale-listing flexibility.
Risks & watch-outs
- Watch-outs: built in 1918 — expect roof / HVAC / electrical / plumbing capex.
Questions for the listing agent
- It's been on market 58 days. Have you received any prior offers? Is the seller open to a 3% concession, seller financing, or rate buy-down credit?
- Built in 1918 — when were the roof, HVAC, electrical panel, plumbing, and water heater last replaced?
- Is there a deadline driving the sale (1031 exchange, divorce, estate, relocation)? That informs how much negotiation room exists.
- Crime grade is F in this area — have there been break-ins, vandalism, or insurance claims at this property in the last 3 years? What carrier currently insures it and at what premium?
- What's the average days-on-market for RENTAL listings here right now (not sales)? A rising rental-DOM trend means longer vacancies and softer asking-rent achievability than the comps imply.
- What's the recent tenant-quality profile in this submarket — average credit score on applications, eviction rate, late-payment / NSF rate, and stable-employment percentage? A property-management company in the area should have these aggregated.
- How much new for-sale + rental construction is in the pipeline within 1–3 miles? Heavy new supply typically softens prices + rents 12–24 months out; constrained supply supports both.
Investment metrics
- 1% rule
- 1.22% ✓
- Cap rate
- 9.19%
- Cash-on-cash
- 10.34%
- DSCR
- 1.46
- GRM
- 6.9
CMA / ARV
- ARV (median comp)
- $126,717
- List price
- $91,000
- Delta
- -28.19%
- Verdict
- UNDERPRICED
- Comps
- 20 within 1.0 mi
Show comp detail 12 sales within ~0.75 mi
| Address | Dist | Beds/Ba | Sqft | Sold | Price | $/sf | Match |
|---|---|---|---|---|---|---|---|
| 1133 Mount Vernon Ave | 0.15mi | 2/1.0 | 998 (+4%) | 4mo | $132,500 | $133 | 84 |
| 439 Birchwood Ave | 0.27mi | 2/1.0 | 941 (-2%) | 3mo | $125,000 | $133 | 82 |
| 1202 Clifton Ave | 0.20mi | 2/1.0 | 983 (+2%) | 6mo | $133,000 | $135 | 82 |
| 1037 Pitkin Ave | 0.36mi | 3/1.0 (+1) | 936 (-2%) | 1mo | $136,000 | $145 | 73 |
| 1282 Sawyer Ave | 0.23mi | 2/1.0 | 847 (-12%) | 1mo | $60,000 | $71 | 69 |
| 1195 Sawyer Ave | 0.14mi | 3/1.0 (+1) | 1,075 (+12%) | 2mo | $75,000 | $70 | 67 |
| 1206 Pitkin Ave | 0.22mi | 3/1.0 (+1) | 1,056 (+10%) | 2mo | $131,000 | $124 | 66 |
| 1119 Mount Vernon Ave | 0.16mi | 3/1.0 (+1) | 848 (-12%) | 3mo | $115,000 | $136 | 66 |
| 1300 Mount Vernon Ave | 0.20mi | 2/1.0 | 1,100 (+15%) | 1mo | $117,000 | $106 | 66 |
| 1174 Linden Ave | 0.15mi | 2/1.0 | 816 (-15%) | 3mo | $77,500 | $95 | 65 |
| 1166 Dayton St | 0.27mi | 3/2.0 (+1) | 1,085 (+13%) | 6mo | $144,000 | $133 | 52 |
| 685 Freedom Ave | 0.73mi | 3/2.5 (+1) | 1,096 (+14%) | 6mo | $190,000 | $173 | 27 |
Match score weights: distance 35% · size 25% · config 20% · recency 20%. Top-matched comps best support the ARV.
Projected returns pro-forma
-3.0% appreciation · 4.82% rent growth · sell at horizon
- IRR
- 1.3%
- Equity multiple
- 1.05×
- Total profit
- $1,337
- Equity at exit
- $13,568
- IRR
- 12.8%
- Equity multiple
- 2.10×
- Total profit
- $28,097
- Equity at exit
- $7,868
Cash invested: $25,480 (down + closing). Projections, not guarantees.
Landlord ↔ Tenant lean methodology
- Overall (STATE)
- 73 Landlord-Friendly
- State Ohio
- 73 Landlord-Friendly · R+6
- County
- — inherits STATE
- City
- — inherits STATE
ZIP-level market 44310
- Rents YoY
- 4.8%
- Active inventory
- 86
- Price-to-rent
- 6.9×
Monthly cashflow live
- Estimated rent
- $1,107 high interval (Pro) →
- Mortgage (P&I)
- −$477
- Tax from tax record
- −$140 /mo · $1,677/yr
- Insurance
- −$38
- HOA
- −$0
- Vacancy / Maint / Mgmt
- −$232
- Net cashflow
- $220
Break-even live
UW: 25.0% down · 7.5% · 30yr · 1.5% tax · 5.0% vac · 8.0% maint · 8.0% mgmt
Financing live
Cash to close
- Down payment
- $22,750
- Closing costs
- $2,730
- Reserves months
- —
- Total cash needed
- —
Loan-product check · same deal, 3 products live
Conventional
25% down · 7.5% · 30yr
- Down + closing
- —
- Monthly P&I
- —
- Monthly cashflow
- —
- DSCR
- —
- Eligible?
- —
Personal DTI + credit; lowest rate.
DSCR
20% down · 8.5% · 30yr
- Down + closing
- —
- Monthly P&I
- —
- Monthly cashflow
- —
- DSCR
- —
- Eligible?
- —
No personal income docs; deal must DSCR.
Hard money
10% down · 12.0% · 12mo
- Down + closing
- —
- Monthly P&I
- —
- Monthly cashflow
- —
- DSCR
- —
- Eligible?
- —
Short-term bridge; refi at stabilization.
Rent comps 19 comps
| Address | Beds | Baths | Sqft | Rent | $/sqft | DOM | Units | Dist |
|---|---|---|---|---|---|---|---|---|
| 1088 Lexington Ave Akron, OH | 3.0 | 1.0 | 1008 | $1,600 | $1.59 | 14d | 1 | 0.21mi |
| 539 E Cuyahoga Falls Ave Unit 1 Akron, OH | 2.0 | 1.0 | 1000 | $895 | $0.90 | 23d | 1 | 0.33mi |
| 1390 N Howard St Akron, OH | 2.0 | 1.0 | 1000 | $1,000 | $1.00 | 43d | 1 | 0.51mi |
| 1350 N Howard St Akron, OH | 1.0–2.0 | 1.0 | 725 | $925 | $1.28 | 14d | 1 | 0.51mi |
| 1382 9th St Cuyahoga Falls, OH | 2.0 | 1.0 | 862 | $1,050 | $1.22 | 43d | 1 | 0.55mi |
| 1522 Campbell St Unit 2 Cuyahoga Falls, OH | 2.0 | 1.0 | 900 | $1,300 | $1.44 | 21d | 1 | 0.56mi |
| 825 Avon St Unit 1 Akron, OH | 2.0 | 1.0 | 960 | $875 | $0.91 | 21d | 1 | 0.88mi |
| 776 N Main St Unit 303 Akron, OH | 1.0 | 1.0 | 600 | $850 | $1.42 | 43d | 1 | 0.93mi |
| 776 N Main St Apt 302 Akron, OH | 1.0 | 1.0 | 600 | $700 | $1.17 | 43d | 1 | 0.93mi |
| 776 N Main St Unit 201 Akron, OH | 1.0 | 1.0 | 600 | $810 | $1.35 | 23d | 1 | 0.93mi |
| 776 N Main St Unit 301 Akron, OH | 1.0 | 1.0 | 600 | $795 | $1.32 | 43d | 1 | 0.93mi |
| 1832 15th St Cuyahoga Falls, OH | 3.0 | 1.0 | 1000 | $1,495 | $1.50 | 23d | 1 | 0.96mi |
| 444 Chestnut Blvd Unit 2 Cuyahoga Falls, OH | 1.0 | 1.0 | 800 | $1,200 | $1.50 | 43d | 1 | 1.00mi |
| 649 Patterson Ave Unit a Akron, OH | 2.0 | 1.0 | 1000 | $775 | $0.78 | 43d | 1 | 1.01mi |
| 805 Carpenter St Akron, OH | 3.0 | 1.0 | 1056 | $1,100 | $1.04 | 23d | 1 | 1.16mi |
| 500 Delmar Ave Unit 502 Akron, OH | 2.0 | 1.0 | 1000 | $775 | $0.78 | 23d | 1 | 1.30mi |
| 1059 Jean Ave Akron, OH | 3.0 | 1.0 | 1012 | $1,300 | $1.28 | 43d | 1 | 1.37mi |
| 624 Garfield St Akron, OH | 2.0 | 1.0 | 696 | $925 | $1.33 | 21d | 1 | 1.45mi |
| 22 W York St Akron, OH | 1.0 | 1.0 | 800 | $875 | $1.09 | 43d | 1 | 1.47mi |
Listing history 17 events
-
2026-06-18days on market $91,000 Active 58 DOM
-
2026-06-17days on market $91,000 Active 57 DOM
-
2026-06-16days on market $91,000 Active 56 DOM
-
2026-06-15days on market $91,000 Active 55 DOM
-
2026-06-14days on market $91,000 Active 53 DOM
-
2026-06-13days on market $91,000 Active 52 DOM
-
2026-06-10days on market $91,000 Active 50 DOM
-
2026-06-09days on market $91,000 Active 49 DOM
-
2026-06-08days on market $91,000 Active 48 DOM
-
2026-06-07days on market $91,000 Active 47 DOM
-
2026-06-05days on market $91,000 Active 44 DOM
-
2026-06-03days on market $91,000 Active 43 DOM
-
2026-06-02days on market $91,000 Active 42 DOM
-
2026-06-01days on market $91,000 Active 41 DOM
-
2026-05-31days on market $91,000 Active 40 DOM
-
2026-05-31days on market $91,000 Active 39 DOM
-
2026-04-17$96,000 Active 774-char remark
Show marketing remark (774 chars)
This two-bedroom one bath bungalow is a great home for first-time buyers or an investor who is looking for rental income. Situated in Akron's North Hill area, the home sits on a brick street and is close to highways, schools, and shopping. There are endless possibilities to make this home with a cozy front porch and side porch with shed into a great home! The furnace, air conditioning, windows, and roof have all been replaced in the last several years. And, the seller has recently replaced the carpeting in the living room and dining room. While there is no garage, there is plenty of parking in the long side-by-side driveway or on the street. The front yard is very large, and the home is set back from the street for privacy. You won't want to miss this opportunity!
ⓘ Source: listings_history table (triggers on properties + properties_extension) + one-shot
backfill from property_details.listing_events for pre-trigger history.
Tax reassessment forecast OH · Partial reset (capped growth)
- Current annual tax
- $1,677 · $140/mo
- Projected year-2 tax
- $1,677 · $140/mo
- Expected delta
- $0/yr ($0/mo · 0.0%)
ⓘ Screening estimate from a state-policy table — verify with the county assessor before closing.
Climate risk First Street
- Flood 1/10 Low FEMA zone X (unshaded) · 0% chance over 30 yrs
- Wildfire 1/10 Low
- Heat 3/10 Moderate 7 d/yr ≥97°F today · 16 d/yr by 30 yrs out
- Wind 1/10 Low
- Air quality 3/10 Moderate 2 unhealthy d/yr today · 4 by 30 yrs out
Nearby sold comps map
Loading sold comps map…
Walkable amenities ~0.75 mi
Loading nearby amenities…
Taxation est. · year 1
- Rental income
- $13,283
- − Mortgage interest
- −$5,097
- − Property taxes
- −$1,677
- − Insurance
- −$455
- − Repairs & maintenance
- −$1,063
- − Management
- −$1,063
- − Depreciation
- −$2,647
- Taxable income
- $1,281
- Est. tax owed @ 24.0%
- −$308
- After-tax cash flow
- $2,328/yr
For passive investors: Depreciation is non-cash, so a rental often shows a tax loss while cash-flowing — sheltering income. Rental losses are passive: they offset passive income freely, and up to $25,000/yr can offset ordinary (W-2) income if you actively participate and your MAGI is under $100k (phasing out to $0 by $150k); unused losses carry forward. On sale, claimed depreciation is recaptured at up to 25%, and gains may owe capital-gains tax (a 1031 exchange can defer both). Figures are a year-1 estimate at your 24.0% rate — not tax advice; consult a CPA.
Schools (NCES district)
- District
- Akron City
- NCES district ID
- 3904348
- Math proficiency
- 22% ▼ -17.00%
- Reading proficiency
- 30% ▼ -12.00%
- Median HH income
- $33,811
- Composite
- 21.31/100
- National rank
- #8383
- State rank
- #602 of 656 in OH
Livability — Akron
- Score
- 81/100
- State rank
- #104
- US rank
- #1591
Category grades
Schools grade is shown separately in the Schools card above.
Census & demographics
- Census place
- Akron, OH
- County
- Summit County · 440,783 people
- City population
- 174,375
- Metro
- Akron, OH
- Population (ZIP)
- 25,496
- Household income
- $41,066
- Rent vs Own
- Severe rent burden
- 2058.0
Population outlook (Summit County) Hauer SSP2
- Today (2025)
- 546,583 people
- By 2030
- 544,028 · -0.5%
- By 2040
- 531,363 · -2.8%
- By 2050
- 514,923 · -5.8%
- By 2075
- 481,765 · -11.9%
- By 2100
- 432,265 · -20.9%
Race, ethnicity, and origin ACS 2023
- Neighborhood character
- Highly diverse neighborhood (Simpson 0.73)
- Race & ethnicity
- White 40% Black 25% Asian 20% Hispanic / Latino 10% Two or more races 9%
- Hispanic origin (detail)
- Mexican 6% Puerto Rican 2%
- Common ancestry
- Romanian 2% Slovak 1% Italian 1%
- Foreign-born
- 25% · Canada, India, Philippines
- Languages at home
- 69% English-only · Other Indo-European 13% Spanish 7% Other Asian/Pacific 6%
Political lean MEDSL · Summit
- 2024 margin
- Lean D (+7.0) · D 53.0% · R 46.0%
- 2008→2024 swing
- -9.6pp toward R · 2008: 16.6pp · 2024: 7.0pp
- All cycles
- 2024: D+7.0 2020: D+9.6 2016: D+8.2 2012: D+14.8 2008: D+16.6
Not yet ingested
- Civics
- —
Market trends
- HPI YoY
- ▼ -194.41%
- Current HPI
- 203.4431
- Rent YoY
- ▲ 4.82%
- Metro
- Akron, OH
- State GDP YoY
- ▲ 1.98%
- F500 in state
- 48
Industry mix (Fortune 500 HQ in OH)
| Industry | F500 HQs | Revenue |
|---|---|---|
| Insurance | 3 | $145B |
|
||
| Industrial Machinery | 3 | $49B |
|
||
| Financial Services | 3 | $24B |
|
||
| Consumer Goods | 2 | $93B |
|
||
| Aerospace / Defense | 2 | $47B |
|
||
| Utilities | 2 | $33B |
|
||
Price history
1 event — show timeline
- 2026-04-17 Listed $96,000 MLSNOW
Property tax history
+2.6%/yrLatest (2025): $1,677 · +2.3% YoY. Source: county tax records.
Cash-flow waterfall
monthlySold comps — $/sqft
last 12 mo · ≤1 miLoading sold comps…