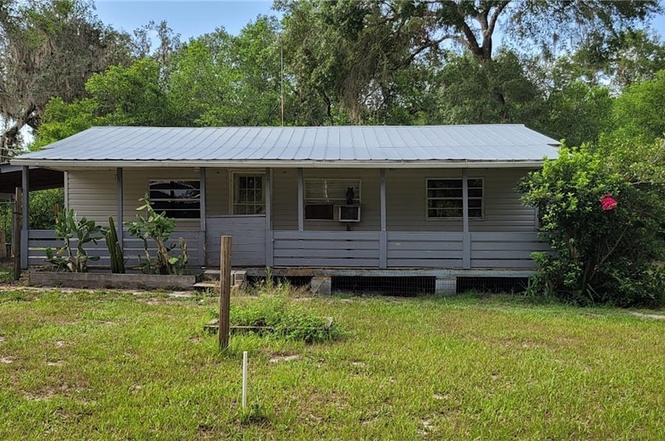
7850 E Wooded Trl · Inverness, FL
Flood risk 1/10 · Minimal
- FEMA flood zone
- X (unshaded)
- Chance of flooding over 30 yrs
- 0.0%
- Est. flood insurance / yr
- $507 – $1,088
Fire risk 6/10 · Moderate
- Est. fire insurance / yr
- $947 – $1,759
Heat risk 8/10 · Major
- Hot days now (above 107°F)
- 7 days/yr
- Hot days in 30 yrs
- 23 days/yr
Wind risk 9/10 · Severe
- Chance of severe wind over 30 yrs
- 99.0%
Air-quality risk 2/10 · Minimal
- Unhealthy air days now
- 2 days/yr
- Unhealthy air days in 30 yrs
- 2 days/yr
Risk factors via First Street. Map © Google.
Why this score? — see what drove the C grade
The composite is a weighted blend of 9 inputs, each scored 0–100. Each bar is that input's sub-score; the figure is the points it added to the 100-point composite (weight × sub-score).
- Cash flow +24.7/30.0
- DSCR +8.0/10.0
- 1% rule +6.6/10.0
- Schools +4.1/10.0
- ARV discount +4.0/15.0
- Livability +3.4/5.0
- Rent growth +2.5/5.0
- Condition / age +2.5/5.0
- Appreciation +0.0/10.0
$115,000
🖨 Deal sheet (PDF) 📄 Offer letter ✓ Due diligence
Listing remarks MLS
Are you looking for a little get away? Here it is. This 2/1 w/ carport sits on a large wooded lot. Close to public boat ramp leading to Tsala Apopka chain of lakes. Very well kept & ready to move into. Large picture window, new metal roof in 2004, wood cabinets in kitchen, refrige 2009, gas range, enclosed utility room, all appliances stay Central Heat & Air. , lots of storage space. Enjoy the outdoors, airboating, fishing, boating. Priced to sell and waiting for you Priced $15,000 below property appraiser
Key facts
- Covered front porch
- Metal roof
- Attached carport
Tags
Neighborhood map
What this means for you Summary
Snapshot
- This is a 2-bed/1.0-bath single-family listed at $115k.
Deal economics
- At list price, monthly cash flow is $239 ($3k/yr) — positive.
- The deal already cash-flows at list — no discount required.
- Meets the 1% rule at list price ($1k rent vs $115k).
- Recommended offer: $101k (12.0% below list) — sets the bar for market timing.
- Cap rate 8.8% vs local median 4.9% in Inverness — top-decile yield for the area; either an underpriced asset or a hidden risk that comps aren't pricing in. Stress-test before assuming the spread holds.
Location & tenants
- Location reads 67/100 on livability (#564 in FL) — a middle-class / working-renter tenant base. Strengths: cost of living A+, housing A-; Watch: health & safety C-, amenities F, commute F.
- Citrus (rural): math 49% / reading 50% proficiency, ranked #44 of 73 in FL (top 60%) — families likely to look elsewhere, expect single-tenant / working-renter base with shorter leases.
- Zoned schools: Hernando Elementary School (math 47% / reading 51%, grade D, #1,134 of 2,144 statewide, top 54%, 813 students, 71% FRL); Inverness Middle School (math 52% / reading 48%, grade C, #254 of 571 statewide, top 45%, 1,017 students, 60% FRL); Citrus High School (math 34% / reading 51%, grade F, #264 of 667 statewide, top 41%, 1,503 students, 54% FRL) — zoned schools at 62% FRL track the district average.
- Market conditions: 421 active listings in the ZIP; 1 comparable units currently listed for rent nearby; 2,443 units permitted in Citrus County in 2024 (0 in 5+ unit buildings).
Forward outlook
- Local home prices are declining (-3.0%/yr); year-one equity from $795 of loan paydown is wiped out by about $3k of value loss. Plan a longer hold.
- Citrus County population projected to shrink 10% by 2050 — rents likely to lag national; underwrite the cash flow, not the appreciation.
Negotiation context
- It's been on market 261 days — a 12% lower offer ($101k) is reasonable based on typical stale-listing flexibility.
- 3 sale attempts since 16y ago; this cycle's ask has dropped $20k (15%) from the opening price — seller is motivated, your offer sets the floor, not the list.
- Current owner paid $48k; list at $115k implies a 137% gain — meaningful room to come down on a strong offer.
Risks & watch-outs
- Climate carrying-cost: severe wind risk, 99% chance of damaging wind over 30y; major wildfire risk; extreme-heat days projected 7→23/yr by 2055 (HVAC capex compounding) — expect insurance premiums to compound above CPI over the hold.
Questions for the listing agent
- It's been on market 261 days. Have you received any prior offers? Is the seller open to a 12% concession, seller financing, or rate buy-down credit?
- Built in 1963 — when were the roof, HVAC, electrical panel, plumbing, and water heater last replaced?
- Why hasn't it sold? Are there any deal-killer items the seller is aware of (foundation, flood, title, zoning, code violations)?
- Is there a deadline driving the sale (1031 exchange, divorce, estate, relocation)? That informs how much negotiation room exists.
- Schools are B-rated — typically a magnet for longer-tenancy family renters. What's the average tenant stay here, and is there a school-zone premium baked into asking?
- What's the average days-on-market for RENTAL listings here right now (not sales)? A rising rental-DOM trend means longer vacancies and softer asking-rent achievability than the comps imply.
- What's the recent tenant-quality profile in this submarket — average credit score on applications, eviction rate, late-payment / NSF rate, and stable-employment percentage? A property-management company in the area should have these aggregated.
- How much new for-sale + rental construction is in the pipeline within 1–3 miles? Heavy new supply typically softens prices + rents 12–24 months out; constrained supply supports both.
Investment metrics
- 1% rule
- 1.16% ✓
- Cap rate
- 8.79%
- Cash-on-cash
- 8.92%
- DSCR
- 1.40
- GRM
- 7.2
CMA / ARV
- ARV (on-the-fly)
- $106,596
- Comps found
- 2
Show comp detail 2 sales within ~0.75 mi
| Address | Dist | Beds/Ba | Sqft | Sold | Price | $/sf | Match |
|---|---|---|---|---|---|---|---|
| 7850 E Wooded Trl | 0.00mi | 2/1.0 | 756 (0%) | 0mo | $100,000 | $132 | 100 |
| 8295 E Turner Camp Rd | 0.60mi | 2/1.0 | 780 (+3%) | 14mo | $110,000 | $141 | 55 |
Match score weights: distance 35% · size 25% · config 20% · recency 20%. Top-matched comps best support the ARV.
Projected returns pro-forma
-3.0% appreciation · 3.0% rent growth · sell at horizon
- IRR
- -2.8%
- Equity multiple
- 0.90×
- Total profit
- $-3,362
- Equity at exit
- $17,147
- IRR
- 6.9%
- Equity multiple
- 1.52×
- Total profit
- $16,825
- Equity at exit
- $9,943
Cash invested: $32,200 (down + closing). Projections, not guarantees.
Landlord ↔ Tenant lean methodology
- Overall (STATE)
- 87 Strongly Landlord-Friendly
- State Florida
- 87 Strongly Landlord-Friendly · R+3
- County
- — inherits STATE
- City
- — inherits STATE
ZIP-level market 34453
- Home prices YoY
- -26.1%
- Active inventory
- 421
- Price-to-rent
- 7.2×
Monthly cashflow live
- Estimated rent
- $1,331 medium interval (Pro) →
- Mortgage (P&I)
- −$603
- Tax from tax record
- −$161 /mo · $1,934/yr
- Insurance
- −$48
- HOA
- −$0
- Vacancy / Maint / Mgmt
- −$280
- Net cashflow
- $239
Break-even live
Sensitivity live
| Price | -10% $304 | -5% $272 | +0% $239 | +5% $207 | +10% $174 |
|---|---|---|---|---|---|
| Rent | -10% $134 | -5% $187 | +0% $239 | +5% $292 | +10% $344 |
| Rate | -1.0pp $297 | -0.5pp $269 | base $239 | +0.5pp $210 | +1.0pp $179 |
UW: 25.0% down · 7.5% · 30yr · 1.5% tax · 5.0% vac · 8.0% maint · 8.0% mgmt
Financing live
Cash to close
- Down payment
- $28,750
- Closing costs
- $3,450
- Reserves months
- —
- Total cash needed
- —
Loan-product check · same deal, 3 products live
Conventional
25% down · 7.5% · 30yr
- Down + closing
- —
- Monthly P&I
- —
- Monthly cashflow
- —
- DSCR
- —
- Eligible?
- —
Personal DTI + credit; lowest rate.
DSCR
20% down · 8.5% · 30yr
- Down + closing
- —
- Monthly P&I
- —
- Monthly cashflow
- —
- DSCR
- —
- Eligible?
- —
No personal income docs; deal must DSCR.
Hard money
10% down · 12.0% · 12mo
- Down + closing
- —
- Monthly P&I
- —
- Monthly cashflow
- —
- DSCR
- —
- Eligible?
- —
Short-term bridge; refi at stabilization.
Rent comps 1 comps
| Address | Beds | Baths | Sqft | Rent | $/sqft | DOM | Units | Dist |
|---|---|---|---|---|---|---|---|---|
| 1111 N Point Lonesome Rd Unit 4A Inverness, FL | 2.0 | 1.0 | 635 | $1,099 | $1.73 | 21d | 1 | 1.38mi |
Listing history 11 events
-
2026-04-21status Pending
-
2026-04-04status Active
-
2026-04-04price $115,000
-
2026-02-26status Pending
-
2025-11-21price $124,900
-
2025-08-20price $129,900
-
2025-06-28$135,000 Active
-
2010-05-25soldstatus $48,500
-
2010-05-07soldstatus $48,500 524-char remark
Show marketing remark (524 chars)
Are you looking for a little get away? Here it is. This 2/1 w/ carport sits on a large wooded lot. Close to public boat ramp leading to Tsala Apopka chain of lakes. Very well kept & ready to move into. Large picture window, new metal roof in 2004, wood cabinets in kitchen, refrige 2009, gas range, enclosed utility room, all appliances stay Central Heat & Air. , lots of storage space. Enjoy the outdoors, airboating, fishing, boating. Priced to sell and waiting for you Priced $15,000 below property appraiser
-
2010-01-15$48,000 524-char remark
Show marketing remark (524 chars)
Are you looking for a little get away? Here it is. This 2/1 w/ carport sits on a large wooded lot. Close to public boat ramp leading to Tsala Apopka chain of lakes. Very well kept & ready to move into. Large picture window, new metal roof in 2004, wood cabinets in kitchen, refrige 2009, gas range, enclosed utility room, all appliances stay Central Heat & Air. , lots of storage space. Enjoy the outdoors, airboating, fishing, boating. Priced to sell and waiting for you Priced $15,000 below property appraiser
-
1991-09-01soldstatus $15,000
ⓘ Source: listings_history table (triggers on properties + properties_extension) + one-shot
backfill from property_details.listing_events for pre-trigger history.
Tax reassessment forecast FL · Resets to sale price
- Current annual tax
- $1,934 · $161/mo
- Projected year-2 tax
- $1,934 · $161/mo
- Expected delta
- $0/yr ($0/mo · 0.0%)
ⓘ Screening estimate from a state-policy table — verify with the county assessor before closing.
Climate risk First Street
- Flood 1/10 Low FEMA zone X (unshaded) · 0% chance over 30 yrs
- Wildfire 6/10 Major
- Heat 8/10 Severe 7 d/yr ≥107°F today · 23 d/yr by 30 yrs out
- Wind 9/10 Extreme 99% chance of damaging wind over 30 yrs
- Air quality 2/10 Low 2 unhealthy d/yr today · 2 by 30 yrs out
Nearby sold comps map
Loading sold comps map…
Walkable amenities ~0.75 mi
Loading nearby amenities…
Taxation est. · year 1
- Rental income
- $15,972
- − Mortgage interest
- −$6,442
- − Property taxes
- −$1,934
- − Insurance
- −$575
- − Repairs & maintenance
- −$1,278
- − Management
- −$1,278
- − Depreciation
- −$3,345
- Taxable income
- $1,120
- Est. tax owed @ 24.0%
- −$269
- After-tax cash flow
- $2,603/yr
For passive investors: Depreciation is non-cash, so a rental often shows a tax loss while cash-flowing — sheltering income. Rental losses are passive: they offset passive income freely, and up to $25,000/yr can offset ordinary (W-2) income if you actively participate and your MAGI is under $100k (phasing out to $0 by $150k); unused losses carry forward. On sale, claimed depreciation is recaptured at up to 25%, and gains may owe capital-gains tax (a 1031 exchange can defer both). Figures are a year-1 estimate at your 24.0% rate — not tax advice; consult a CPA.
Schools (NCES district)
- District
- Citrus
- NCES district ID
- 1200270
- Math proficiency
- 49% ▼ -10.00%
- Reading proficiency
- 50% ▼ -6.00%
- Median HH income
- $38,618
- Composite
- 41.28/100
- National rank
- #3519
- State rank
- #44 of 73 in FL
Livability — Inverness
- Score
- 67/100
- State rank
- #564
- US rank
- #10791
Category grades
Schools grade is shown separately in the Schools card above.
Census & demographics
- County
- Citrus County · 111,314 people
- City population
- 10,621
- Metro
- Homosassa Springs, FL
- Population (ZIP)
- 10,621
- Household income
- $57,568
- Rent vs Own
- Severe rent burden
- 240.0
Population outlook (Citrus County) Hauer SSP2
- Today (2025)
- 138,622 people
- By 2030
- 136,886 · -1.3%
- By 2040
- 132,009 · -4.8%
- By 2050
- 125,196 · -9.7%
- By 2075
- 108,570 · -21.7%
- By 2100
- 84,454 · -39.1%
Race, ethnicity, and origin ACS 2023
- Neighborhood character
- Predominantly White (87%)
- Race & ethnicity
- White 87% Hispanic / Latino 6% Black 3% Two or more races 3% Asian 2%
- Hispanic origin (detail)
- Puerto Rican 2%
- Common ancestry
- Lithuanian 3% Romanian 3% Italian 3%
- Foreign-born
- 4% · Canada
- Languages at home
- 94% English-only · Spanish 4% Tagalog/Filipino 1% Other Asian/Pacific 0%
Political lean MEDSL · Citrus
- 2024 margin
- Solid R (+45.9) · D 26.8% · R 72.6%
- 2008→2024 swing
- -29.8pp toward R · 2008: -16.1pp · 2024: -45.9pp
- All cycles
- 2024: R+45.9 2020: R+41.0 2016: R+39.7 2012: R+21.9 2008: R+16.1
Not yet ingested
- Civics
- —
Market trends
- HPI YoY
- ▼ -103.32%
- Current HPI
- 291.8965
- Rent YoY
- —
- Metro
- Homosassa Springs, FL
- State GDP YoY
- ▲ 3.28%
- F500 in state
- 36
Industry mix (Fortune 500 HQ in FL)
| Industry | F500 HQs | Revenue |
|---|---|---|
| Industrial Technology | 2 | $29B |
|
||
| Insurance | 2 | $17B |
|
||
| Retail | 1 | $60B |
|
||
| Technology Distribution | 1 | $58B |
|
||
| Homebuilding | 1 | $35B |
|
||
| Technology Manufacturing | 1 | $35B |
|
||
Price history
+666.7% since first listed11 events — show timeline
- 2026-04-21 Pending — RACC
- 2026-04-04 Relisted — RACC
- 2026-04-04 Price Changed $115,000 RACC
- 2026-02-26 Pending — RACC
- 2025-11-21 Price Changed $124,900 RACC
- 2025-08-20 Price Changed $129,900 RACC
- 2025-06-28 Listed $135,000 RACC
- 2010-05-25 Sold (Public Records) $48,500 Public Records
- 2010-05-07 Sold (MLS) $48,500 RACC
- 2010-01-15 Listed $48,000 RACC
- 1991-09-01 Sold (Public Records) $15,000 Public Records
Property tax history
+20.9%/yrLatest (2025): $1,934 · +344.7% YoY. Source: county tax records.
Cash-flow waterfall
monthlySold comps — $/sqft
last 12 mo · ≤1 miLoading sold comps…