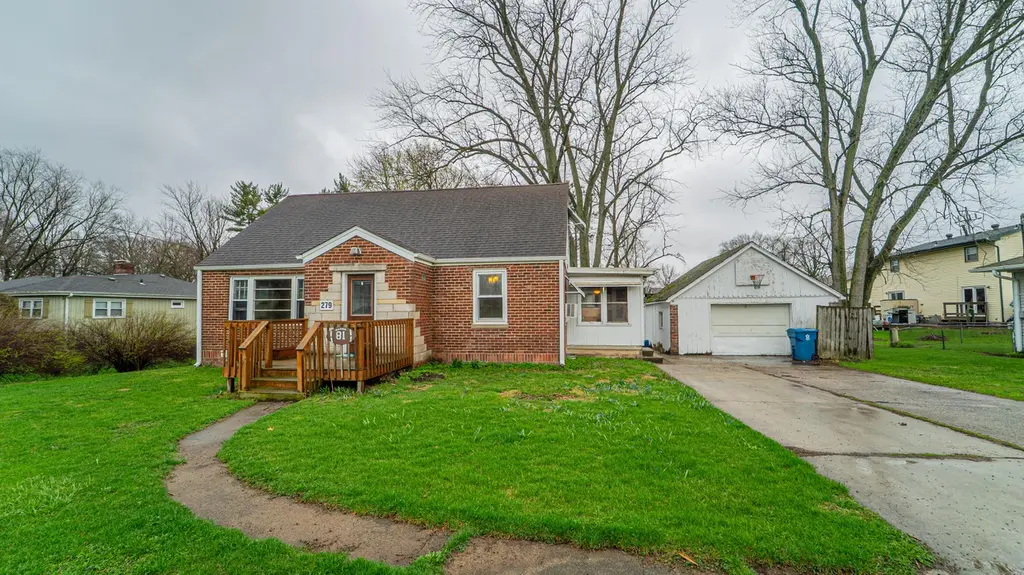
279 W Oakley Ave · Lowell, IN
Flood risk 1/10 · Minimal
- FEMA flood zone
- X (unshaded)
- Chance of flooding over 30 yrs
- 0.0%
- Est. flood insurance / yr
- $473 – $860
Fire risk 1/10 · Minimal
- Est. fire insurance / yr
- $717 – $1,331
Heat risk 3/10 · Minor
- Hot days now (above 101°F)
- 7 days/yr
- Hot days in 30 yrs
- 16 days/yr
Wind risk 2/10 · Minimal
- Chance of severe wind over 30 yrs
- 0.0%
Air-quality risk 2/10 · Minimal
- Unhealthy air days now
- 1 days/yr
- Unhealthy air days in 30 yrs
- 2 days/yr
Risk factors via First Street. Map © Google.
Why this score? — see what drove the D+ grade
The composite is a weighted blend of 9 inputs, each scored 0–100. Each bar is that input's sub-score; the figure is the points it added to the 100-point composite (weight × sub-score).
- Cash flow +19.2/30.0
- ARV discount +6.9/15.0
- DSCR +6.1/10.0
- Schools +4.5/10.0
- 1% rule +4.4/10.0
- Livability +3.8/5.0
- Rent growth +2.5/5.0
- Condition / age +2.5/5.0
- Appreciation +0.0/10.0
$260,000
🖨 Deal sheet 📄 Offer letter ✓ Due diligence
Listing remarks MLS
Charming brick Cape Cod featuring a main floor primary bedroom and timeless character throughout. The home showcases the charm of original hardwood floors and built-ins, paired with an updated kitchen offering new cabinets and Corian countertops. Major updates provide peace of mind, including a new hot water heater and a professionally installed waterproofing system. The unfinished basement offers a blank canvas for future expansion, storage, or customization to fit your needs. Step outside to enjoy a partially enclosed backyard with a privacy fence, perfect for relaxing or entertaining. Conveniently located near schools, shopping, and dining, this home blends character, updates, and opportunity in one inviting package.
Key facts
- 0.37 acre lot
- 2 garage spots
- Built 1945
Neighborhood map
What this means for you Summary
Snapshot
- This is a 3-bed/1.0-bath single-family listed at $260k.
Deal economics
- At list price, monthly cash flow is $283 ($3k/yr) — positive.
- The deal already cash-flows at list — no discount required.
- To meet the 1% rule (rent ≥ 1% of price), the offer needs to be $244k (6.2% below list).
- Recommended offer: $244k (6.2% below list) — sets the bar for 1% rule.
- Cap rate 7.6% vs local median 3.9% in Lowell — top-decile yield for the area; either an underpriced asset or a hidden risk that comps aren't pricing in. Stress-test before assuming the spread holds.
Location & tenants
- Location reads 76/100 on livability (#51 in IN, #3,455 nationally) — a middle-class / working-renter tenant base. Strengths: crime A+, cost of living A+, housing A+; Watch: health & safety C-, amenities F, commute F.
- Tri-Creek School Corporation (town): math 46% / reading 56% proficiency, ranked #39 of 301 in IN (top 13%) — acceptable for families but not a draw, mixed tenant base, ~2y average lease.
- Market conditions: 350 active listings in the ZIP; 3 comparable units currently listed for rent nearby; rentals at typical pace (median 15d on market — plan ~3-4 weeks tenant-placement turnaround); 1,642 units permitted in Lake County in 2024 (14 in 5+ unit buildings).
Forward outlook
- Local home prices are declining (-3.0%/yr); year-one equity from $2k of loan paydown is wiped out by about $8k of value loss. Plan a longer hold.
- Lake County population projected to shrink 7% by 2050 — rents likely to lag national; underwrite the cash flow, not the appreciation.
Negotiation context
- It's been on market 72 days — a 6% lower offer ($244k) is reasonable based on typical stale-listing flexibility.
- 5 sale attempts since 19y ago; this cycle's ask has dropped $29k (10%) from the opening price — seller is motivated, your offer sets the floor, not the list.
- Current owner paid $110k; list at $260k implies a 136% gain — meaningful room to come down on a strong offer.
Risks & watch-outs
- Watch-outs: built in 1945 — expect roof / HVAC / electrical / plumbing capex.
Questions for the listing agent
- It's been on market 72 days. Have you received any prior offers? Is the seller open to a 6% concession, seller financing, or rate buy-down credit?
- Built in 1945 — when were the roof, HVAC, electrical panel, plumbing, and water heater last replaced?
- Why hasn't it sold? Are there any deal-killer items the seller is aware of (foundation, flood, title, zoning, code violations)?
- Is there a deadline driving the sale (1031 exchange, divorce, estate, relocation)? That informs how much negotiation room exists.
- The area grade is low — what's the realistic commute time and amenity access for the typical tenant pool here? Any planned neighborhood developments (good or bad) we should know about?
- What's the average days-on-market for RENTAL listings here right now (not sales)? A rising rental-DOM trend means longer vacancies and softer asking-rent achievability than the comps imply.
- What's the recent tenant-quality profile in this submarket — average credit score on applications, eviction rate, late-payment / NSF rate, and stable-employment percentage? A property-management company in the area should have these aggregated.
- How much new for-sale + rental construction is in the pipeline within 1–3 miles? Heavy new supply typically softens prices + rents 12–24 months out; constrained supply supports both.
Investment metrics
- 1% rule
- 0.94% ✗
- Cap rate
- 7.60%
- Cash-on-cash
- 4.66%
- DSCR
- 1.21
- GRM
- 8.9
CMA / ARV
- ARV (median comp)
- $256,776
- List price
- $260,000
- Delta
- 1.26%
- Verdict
- FAIR
- Comps
- 20 within 1.0 mi
Show comp detail 12 sales within ~0.75 mi
| Address | Dist | Beds/Ba | Sqft | Sold | Price | $/sf | Match |
|---|---|---|---|---|---|---|---|
| 124 N Liberty St | 0.24mi | 3/1.0 | 1,901 (+2%) | 1mo | $185,000 | $97 | 86 |
| 123 S Liberty St | 0.19mi | 3/1.0 | 2,048 (+9%) | 3mo | $219,000 | $107 | 73 |
| 420 E Main St | 0.59mi | 3/1.0 | 1,841 (-2%) | 4mo | $265,000 | $144 | 67 |
| 711 Meadow Brook Dr | 0.30mi | 3/2.0 | 1,686 (-10%) | 2mo | $280,000 | $166 | 64 |
| 8698 Graystone Dr | 0.67mi | 3/2.0 | 1,880 (+0%) | 1mo | $336,458 | $179 | 64 |
| 8671 Graystone Dr | 0.68mi | 3/2.0 | 1,880 (+0%) | 1mo | $343,500 | $183 | 63 |
| 763 Longwood Dr | 0.51mi | 3/3.0 | 1,810 (-3%) | 1mo | $375,000 | $207 | 62 |
| 8506 Kannon Dr | 0.54mi | 3/2.0 | 1,748 (-7%) | 0mo | $331,408 | $190 | 60 |
| 455 N Nichols St | 0.56mi | 3/1.5 | 1,717 (-8%) | 2mo | $280,000 | $163 | 57 |
| 715 Cheyenne Dr | 0.62mi | 3/2.0 | 2,040 (+9%) | 1mo | $330,000 | $162 | 51 |
| 8692 Graystone Dr | 0.66mi | 3/2.0 | 1,649 (-12%) | 2mo | $316,508 | $192 | 44 |
| 8603 Graystone Dr | 0.65mi | 3/2.0 | 1,649 (-12%) | 3mo | $314,907 | $191 | 43 |
Match score weights: distance 35% · size 25% · config 20% · recency 20%. Top-matched comps best support the ARV.
Projected returns pro-forma
-3.0% appreciation · 3.0% rent growth · sell at horizon
- IRR
- -9.1%
- Equity multiple
- 0.67×
- Total profit
- $-24,174
- Equity at exit
- $38,767
- IRR
- 0.4%
- Equity multiple
- 1.03×
- Total profit
- $1,912
- Equity at exit
- $22,480
Cash invested: $72,800 (down + closing). Projections, not guarantees.
Landlord ↔ Tenant lean methodology
- Overall (STATE)
- 90 Strongly Landlord-Friendly
- State Indiana
- 90 Strongly Landlord-Friendly · R+11
- County
- — inherits STATE
- City
- — inherits STATE
ZIP-level market 46356
- Home prices YoY
- -30.1%
- Active inventory
- 350
- Price-to-rent
- 8.9×
Monthly cashflow live
- Estimated rent
- $2,438 medium interval (Pro) →
- Mortgage (P&I)
- −$1,363
- Tax from tax record
- −$172 /mo · $2,059/yr
- Insurance
- −$108
- HOA
- −$0
- Vacancy / Maint / Mgmt
- −$512
- Net cashflow
- $283
Break-even live
UW: 25.0% down · 7.5% · 30yr · 1.5% tax · 5.0% vac · 8.0% maint · 8.0% mgmt
Financing live
Cash to close
- Down payment
- $65,000
- Closing costs
- $7,800
- Reserves months
- —
- Total cash needed
- —
Loan-product check · same deal, 3 products live
Conventional
25% down · 7.5% · 30yr
- Down + closing
- —
- Monthly P&I
- —
- Monthly cashflow
- —
- DSCR
- —
- Eligible?
- —
Personal DTI + credit; lowest rate.
DSCR
20% down · 8.5% · 30yr
- Down + closing
- —
- Monthly P&I
- —
- Monthly cashflow
- —
- DSCR
- —
- Eligible?
- —
No personal income docs; deal must DSCR.
Hard money
10% down · 12.0% · 12mo
- Down + closing
- —
- Monthly P&I
- —
- Monthly cashflow
- —
- DSCR
- —
- Eligible?
- —
Short-term bridge; refi at stabilization.
Rent comps 3 comps
| Address | Beds | Baths | Sqft | Rent | $/sqft | DOM | Units | Dist |
|---|---|---|---|---|---|---|---|---|
| 8366 Kannon Dr Lowell, IN | 3.0 | 2.5 | 1840 | $2,550 | $1.39 | 1d | 1 | 0.47mi |
| 8301 Kannon Dr Lowell, IN | 3.0 | 2.5 | 1717 | $2,800 | $1.63 | 15d | 1 | 0.47mi |
| 445 Cheyenne Dr Lowell, IN | 4.0 | 2.0 | 1958 | $1,895 | $0.97 | 24d | 1 | 0.55mi |
Listing history 25 events
-
2026-06-18days on market $260,000 Active 72 DOM
-
2026-06-17price $260,000 Active 71 DOM
-
2026-06-17days on market $265,000 Active 71 DOM
-
2026-06-16days on market $265,000 Active 70 DOM
-
2026-06-15days on market $265,000 Active 69 DOM
-
2026-06-13days on market $265,000 Active 67 DOM
-
2026-06-09days on market $265,000 Active 63 DOM
-
2026-06-08days on market $265,000 Active 62 DOM
-
2026-06-07days on market $265,000 Active 61 DOM
-
2026-06-04days on market $265,000 Active 58 DOM
-
2026-06-03days on market $265,000 Active 57 DOM
-
2026-06-02days on market $265,000 Active 56 DOM
-
2026-06-01days on market $265,000 Active 55 DOM
-
2026-05-31days on market $265,000 Active 54 DOM
-
2026-05-06price $275,000 729-char remark
Show marketing remark (729 chars)
Charming brick Cape Cod featuring a main floor primary bedroom and timeless character throughout. The home showcases the charm of original hardwood floors and built-ins, paired with an updated kitchen offering new cabinets and Corian countertops. Major updates provide peace of mind, including a new hot water heater and a professionally installed waterproofing system. The unfinished basement offers a blank canvas for future expansion, storage, or customization to fit your needs. Step outside to enjoy a partially enclosed backyard with a privacy fence, perfect for relaxing or entertaining. Conveniently located near schools, shopping, and dining, this home blends character, updates, and opportunity in one inviting package.
-
2026-04-21price $283,900 729-char remark
Show marketing remark (729 chars)
Charming brick Cape Cod featuring a main floor primary bedroom and timeless character throughout. The home showcases the charm of original hardwood floors and built-ins, paired with an updated kitchen offering new cabinets and Corian countertops. Major updates provide peace of mind, including a new hot water heater and a professionally installed waterproofing system. The unfinished basement offers a blank canvas for future expansion, storage, or customization to fit your needs. Step outside to enjoy a partially enclosed backyard with a privacy fence, perfect for relaxing or entertaining. Conveniently located near schools, shopping, and dining, this home blends character, updates, and opportunity in one inviting package.
-
2026-04-07$289,000 Active 729-char remark
Show marketing remark (729 chars)
Charming brick Cape Cod featuring a main floor primary bedroom and timeless character throughout. The home showcases the charm of original hardwood floors and built-ins, paired with an updated kitchen offering new cabinets and Corian countertops. Major updates provide peace of mind, including a new hot water heater and a professionally installed waterproofing system. The unfinished basement offers a blank canvas for future expansion, storage, or customization to fit your needs. Step outside to enjoy a partially enclosed backyard with a privacy fence, perfect for relaxing or entertaining. Conveniently located near schools, shopping, and dining, this home blends character, updates, and opportunity in one inviting package.
-
2012-09-14soldstatus $110,000 206-char remark
Show marketing remark (206 chars)
Welcome home to this well built cape cod just minutes from downtown Lowell. Walk to shopping, restaurants or the local schools. Enjoy the large back yard, the quiet location and the pride in home ownership.
-
2012-03-30$110,000 206-char remark
Show marketing remark (206 chars)
Welcome home to this well built cape cod just minutes from downtown Lowell. Walk to shopping, restaurants or the local schools. Enjoy the large back yard, the quiet location and the pride in home ownership.
-
2011-11-25historical
-
2011-05-25$99,500
-
2011-05-14historical
-
2010-08-03$119,900
-
2008-09-12historical
-
2007-09-11$145,000
ⓘ Source: listings_history table (triggers on properties + properties_extension) + one-shot
backfill from property_details.listing_events for pre-trigger history.
Tax reassessment forecast IN · Partial reset (capped growth)
- Current annual tax
- $2,059 · $172/mo
- Projected year-2 tax
- $2,134 · $178/mo
- Expected delta
- +$76/yr (+$6/mo · 3.7%)
ⓘ Screening estimate from a state-policy table — verify with the county assessor before closing.
Climate risk First Street
- Flood 1/10 Low FEMA zone X (unshaded) · 0% chance over 30 yrs
- Wildfire 1/10 Low
- Heat 3/10 Moderate 7 d/yr ≥101°F today · 16 d/yr by 30 yrs out
- Wind 2/10 Low 0% chance of damaging wind over 30 yrs
- Air quality 2/10 Low 1 unhealthy d/yr today · 2 by 30 yrs out
Nearby sold comps map
Loading sold comps map…
Walkable amenities ~0.75 mi
Loading nearby amenities…
Taxation est. · year 1
- Rental income
- $29,259
- − Mortgage interest
- −$14,564
- − Property taxes
- −$2,059
- − Insurance
- −$1,300
- − Repairs & maintenance
- −$2,341
- − Management
- −$2,341
- − Depreciation
- −$7,564
- Taxable loss
- −$909
- Est. tax savings @ 24.0%
- +$218
- After-tax cash flow
- $3,612/yr
For passive investors: Depreciation is non-cash, so a rental often shows a tax loss while cash-flowing — sheltering income. Rental losses are passive: they offset passive income freely, and up to $25,000/yr can offset ordinary (W-2) income if you actively participate and your MAGI is under $100k (phasing out to $0 by $150k); unused losses carry forward. On sale, claimed depreciation is recaptured at up to 25%, and gains may owe capital-gains tax (a 1031 exchange can defer both). Figures are a year-1 estimate at your 24.0% rate — not tax advice; consult a CPA.
Schools (NCES district)
- District
- Tri-Creek School Corporation
- NCES district ID
- 1811460
- Math proficiency
- 46% ▼ -8.00%
- Reading proficiency
- 56% ▼ -5.00%
- Median HH income
- $64,614
- Composite
- 44.97/100
- National rank
- #2704
- State rank
- #39 of 301 in IN
Livability — Lowell
- Score
- 76/100
- State rank
- #51
- US rank
- #3455
Category grades
Schools grade is shown separately in the Schools card above.
Census & demographics
- Census place
- Lowell, IN
- City population
- 19,396
- Population (ZIP)
- 19,396
Population outlook (Lake County) Hauer SSP2
- Today (2025)
- 484,026 people
- By 2030
- 478,091 · -1.2%
- By 2040
- 462,974 · -4.3%
- By 2050
- 449,894 · -7.1%
- By 2075
- 436,169 · -9.9%
- By 2100
- 426,607 · -11.9%
Race, ethnicity, and origin ACS 2023
- Neighborhood character
- Predominantly White (88%)
- Race & ethnicity
- White 88% Hispanic / Latino 9% Two or more races 6%
- Hispanic origin (detail)
- Mexican 8%
- Common ancestry
- Romanian 16% Iranian 10% Lithuanian 2%
- Foreign-born
- 4% · Canada
- Languages at home
- 95% English-only · Spanish 4% Russian/Polish/Slavic 1%
Political lean MEDSL · Lake
- 2024 margin
- Lean D (+5.6) · D 52.1% · R 46.5% · Other 1.5%
- 2008→2024 swing
- -28.6pp toward R · 2008: 34.3pp · 2024: 5.6pp
- All cycles
- 2024: D+5.6 2020: D+15.1 2016: D+20.6 2012: D+31.0 2008: D+34.3
Not yet ingested
- Civics
- —
Market trends
- HPI YoY
- ▼ -110.73%
- Current HPI
- 256.6224
- Rent YoY
- —
- Metro
- —
- State GDP YoY
- ▲ 2.90%
- F500 in state
- 18
Industry mix (Fortune 500 HQ in IN)
| Industry | F500 HQs | Revenue |
|---|---|---|
| Industrial Machinery | 2 | $37B |
|
||
| Healthcare | 1 | $177B |
|
||
| Pharmaceuticals | 1 | $45B |
|
||
| Metals / Steel | 1 | $18B |
|
||
| Agriculture | 1 | $17B |
|
||
| Packaging | 1 | $12B |
|
||
Price history
+89.7% since first listed11 events — show timeline
- 2026-05-06 Price Changed $275,000 NIRA MLS as Distributed by MLS Grid
- 2026-04-21 Price Changed $283,900 NIRA MLS as Distributed by MLS Grid
- 2026-04-07 Listed $289,000 NIRA MLS as Distributed by MLS Grid
- 2012-09-14 Sold (MLS) $110,000 NIRA MLS as Distributed by MLS Grid
- 2012-03-30 Listed $110,000 NIRA MLS as Distributed by MLS Grid
- 2011-11-25 Listing Removed — NIRA MLS as Distributed by MLS Grid
- 2011-05-25 Listed $99,500 NIRA MLS as Distributed by MLS Grid
- 2011-05-14 Listing Removed — NIRA MLS as Distributed by MLS Grid
- 2010-08-03 Listed $119,900 NIRA MLS as Distributed by MLS Grid
- 2008-09-12 Listing Removed — NIRA MLS as Distributed by MLS Grid
- 2007-09-11 Listed $145,000 NIRA MLS as Distributed by MLS Grid
Property tax history
+6.4%/yrLatest (2024): $2,059 · +5.3% YoY. Source: county tax records.
Cash-flow waterfall
monthlySold comps — $/sqft
last 12 mo · ≤1 miLoading sold comps…