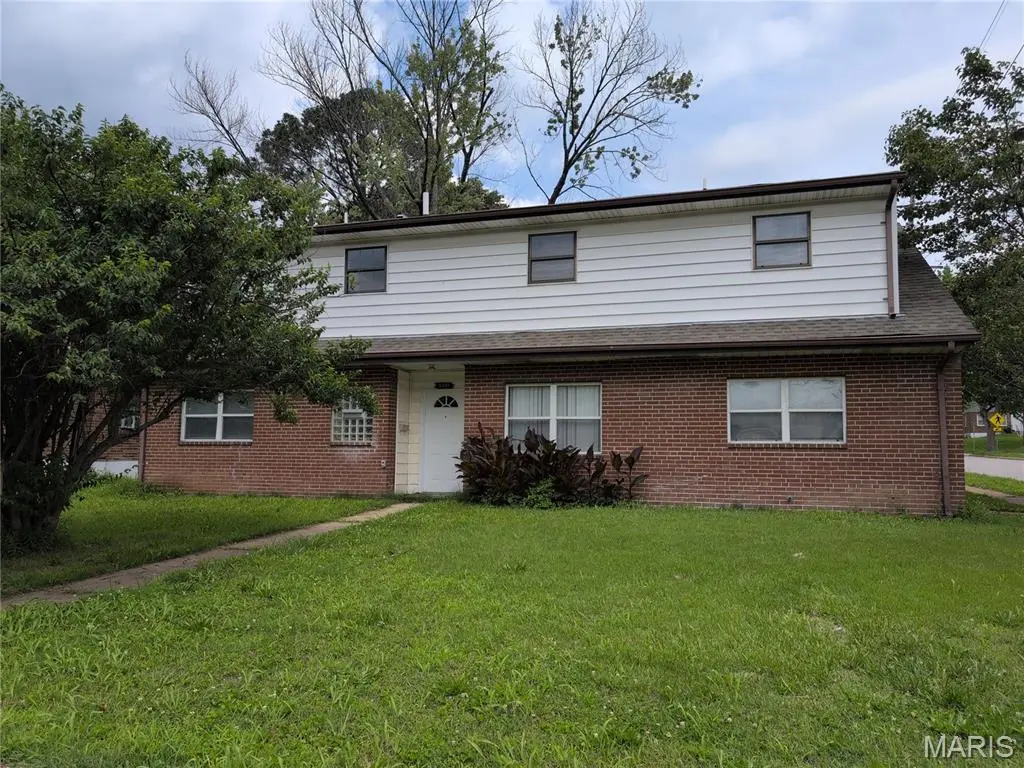
8201 Braddock Dr · University City, MO
Flood risk 1/10 · Minimal
- FEMA flood zone
- X (unshaded)
- Chance of flooding over 30 yrs
- 0.0%
- Est. flood insurance / yr
- $507 – $1,088
Fire risk 1/10 · Minimal
- Est. fire insurance / yr
- $1,054 – $1,958
Heat risk 5/10 · Moderate
- Hot days now (above 107°F)
- 7 days/yr
- Hot days in 30 yrs
- 21 days/yr
Wind risk 2/10 · Minimal
- Chance of severe wind over 30 yrs
- 1.0%
Air-quality risk 4/10 · Minor
- Unhealthy air days now
- 4 days/yr
- Unhealthy air days in 30 yrs
- 5 days/yr
Risk factors via First Street. Map © Google.
Why this score? — see what drove the D+ grade
The composite is a weighted blend of 9 inputs, each scored 0–100. Each bar is that input's sub-score; the figure is the points it added to the 100-point composite (weight × sub-score).
- ARV discount +15.0/15.0
- Cash flow +14.6/30.0
- DSCR +4.5/10.0
- Rent growth +4.2/5.0
- Livability +3.7/5.0
- 1% rule +3.3/10.0
- Condition / age +2.5/5.0
- Schools +1.9/10.0
- Appreciation +0.0/10.0
$280,000
🖨 Deal sheet (PDF) 📄 Offer letter ✓ Due diligence
Listing remarks
Looking for a spacious, affordably priced home in University City? 8201 Braddock offers a distinctive floor plan with a central foyer, a generous living room with a wood-burning fireplace, and a formal dining room adjacent to the kitchen—ideal for entertaining. The main floor includes two good-sized bedrooms with large closets. Upstairs features a large open loft, three additional bedrooms, and a huge walk-in cedar closet (light switch behind the door). Wood laminate and ceramic tile run throughout. The former garage now serves as a utility room with ample storage or workshop space. Don’t miss the chance to own this versatile home—perfect for living, working, or running a
Key facts
- 7,679 sq ft lot
- Built 1950
- Listed 15 days
Property features AI
Finance
- Other: Above-grade finished area approximately 2,487 (Assessor)
- Financial info: Lease not considered
- HOA & community: Community amenities: park, playground
Exterior
- Utilities: Public water; Public sewer; Electric service by Ameren; Cable available
- Home design: Single family residence; Two levels; Private ownership; House
- Construction: Brick construction; Architectural shingle roof
- Exterior features: Back yard; Corner lot; Chain link fencing; Shed(s)
Interior
- Kitchen: Dishwasher; Electric range; Refrigerator
- Bedrooms: 5 bedrooms total; 2 main-level bedrooms; 3 upper-level bedrooms
- Flooring: Other flooring
- Bathrooms: 2 full bathrooms total; 1 full bathroom on the main level; 1 full bathroom on the upper level
- Heating & cooling: Forced air heating (natural gas); Central air conditioning; Ceiling fans
- Interior features: Cedar closets; Ceiling fans; Crown molding; Open floor plan; Walk-in closets; Living room wood-burning fireplace
Neighborhood map
What this means for you Summary
Snapshot
- This is a 4-bed/2.0-bath single-family listed at $280k.
Deal economics
- At list price, monthly cash flow is $69 ($827/yr) — positive.
- The deal already cash-flows at list — no discount required.
- To meet the 1% rule (rent ≥ 1% of price), the offer needs to be $233k (16.7% below list).
- Recommended offer: $233k (16.7% below list) — sets the bar for 1% rule.
- Cap rate 6.6% vs local median 4.4% in University City — top-decile yield for the area; either an underpriced asset or a hidden risk that comps aren't pricing in. Stress-test before assuming the spread holds.
Location & tenants
- Location reads 73/100 on livability (#84 in MO) — a middle-class / working-renter tenant base. Strengths: employment A+, housing A+, cost of living B; Watch: amenities D-, commute D-, health & safety F.
- University City (suburban): math 15% / reading 26% proficiency, ranked #297 of 324 in MO (top 92%) — low school quality limits family demand, transient renter base, plan for 1-2y turnover; 67% free/reduced lunch — lower-income household profile, screen leases tightly.
- Zoned schools: Barbara Jordan Elem. (math 8% / reading 22%, grade F, #982 of 1,115 statewide, top 89%, 310 students, 100% FRL); Brittany Woods (math 15% / reading 20%, grade F, #350 of 391 statewide, top 90%, 532 students, 100% FRL); University City Sr. High (math 5% / reading 52%, grade F, #409 of 521 statewide, top 79%, 726 students, 100% FRL) — zoned schools average 100% FRL vs 67% district-wide (32 pts higher); higher-poverty schools than district average — tighter screening recommended.
- Market conditions: Rents rising fast (+6.6%/yr); 53 active listings in the ZIP; 6 comparable units currently listed for rent nearby; rentals at typical pace (median 14d on market — plan ~3-4 weeks tenant-placement turnaround); solid renter incomes; 920 units permitted in St. Louis County in 2024 (250 in 5+ unit buildings).
- This rent runs 32% of the median local income ($87k/yr) — at the standard rent-burdened threshold; future hikes will face affordability resistance.
Forward outlook
- Local home prices are declining (-3.0%/yr); year-one equity from $2k of loan paydown is wiped out by about $8k of value loss. Plan a longer hold.
Negotiation context
- It's been on market 16 days — a 2% lower offer ($276k) is reasonable based on typical stale-listing flexibility.
- Current owner paid $143k; list at $280k implies a 96% gain — meaningful room to come down on a strong offer.
Risks & watch-outs
- Watch-outs: built in 1950 — expect roof / HVAC / electrical / plumbing capex.
- Climate carrying-cost: extreme-heat days projected 7→21/yr by 2055 (HVAC capex compounding) — expect insurance premiums to compound above CPI over the hold.
Questions for the listing agent
- Built in 1950 — when were the roof, HVAC, electrical panel, plumbing, and water heater last replaced?
- Is there a deadline driving the sale (1031 exchange, divorce, estate, relocation)? That informs how much negotiation room exists.
- Schools are B-rated — typically a magnet for longer-tenancy family renters. What's the average tenant stay here, and is there a school-zone premium baked into asking?
- The area grade is low — what's the realistic commute time and amenity access for the typical tenant pool here? Any planned neighborhood developments (good or bad) we should know about?
- What's the average days-on-market for RENTAL listings here right now (not sales)? A rising rental-DOM trend means longer vacancies and softer asking-rent achievability than the comps imply.
- What's the recent tenant-quality profile in this submarket — average credit score on applications, eviction rate, late-payment / NSF rate, and stable-employment percentage? A property-management company in the area should have these aggregated.
- How much new for-sale + rental construction is in the pipeline within 1–3 miles? Heavy new supply typically softens prices + rents 12–24 months out; constrained supply supports both.
Investment metrics
- 1% rule
- 0.83% ✗
- Cap rate
- 6.59%
- Cash-on-cash
- 1.06%
- DSCR
- 1.05
- GRM
- 10.0
CMA / ARV
- ARV (on-the-fly)
- $370,563
- Comps found
- 5
Show comp detail 5 sales within ~0.75 mi
| Address | Dist | Beds/Ba | Sqft | Sold | Price | $/sf | Match |
|---|---|---|---|---|---|---|---|
| 8312 Old Bonhomme Rd | 0.74mi | 3/2.0 (-1) | 2,515 (+1%) | 8mo | $349,000 | $139 | 52 |
| 8628 Mayflower Ct | 0.68mi | 3/2.0 (-1) | 2,120 (-15%) | 1mo | $389,900 | $184 | 38 |
| 8637 Mayflower Ct | 0.69mi | 3/2.5 (-1) | 2,152 (-14%) | 2mo | $249,900 | $116 | 37 |
| 8634 Mayflower Ct | 0.69mi | 3/2.5 (-1) | 2,218 (-11%) | 7mo | $329,900 | $149 | 37 |
| 8294 Tulane Ave | 0.71mi | 3/2.5 (-1) | 2,147 (-14%) | 21mo | $445,000 | $207 | 20 |
Match score weights: distance 35% · size 25% · config 20% · recency 20%. Top-matched comps best support the ARV.
Projected returns pro-forma
-3.0% appreciation · 6.64% rent growth · sell at horizon
- IRR
- -10.9%
- Equity multiple
- 0.59×
- Total profit
- $-32,195
- Equity at exit
- $41,749
- IRR
- 2.6%
- Equity multiple
- 1.21×
- Total profit
- $16,503
- Equity at exit
- $24,209
Cash invested: $78,400 (down + closing). Projections, not guarantees.
Landlord ↔ Tenant lean methodology
- Overall (STATE)
- 81 Strongly Landlord-Friendly
- State Missouri
- 81 Strongly Landlord-Friendly · R+10
- County
- — inherits STATE
- City
- — inherits STATE
ZIP-level market 63132
- Rents YoY
- 6.6%
- Active inventory
- 53
- Price-to-rent
- 10.0×
Monthly cashflow live
- Estimated rent
- $2,331 high interval (Pro) →
- Mortgage (P&I)
- −$1,468
- Tax from tax record
- −$188 /mo · $2,254/yr
- Insurance
- −$117
- HOA
- −$0
- Vacancy / Maint / Mgmt
- −$490
- Net cashflow
- $69
Break-even live
Sensitivity live
| Price | -10% $227 | -5% $148 | +0% $69 | +5% $-10 | +10% $-90 |
|---|---|---|---|---|---|
| Rent | -10% $-115 | -5% $-23 | +0% $69 | +5% $161 | +10% $253 |
| Rate | -1.0pp $210 | -0.5pp $140 | base $69 | +0.5pp $-4 | +1.0pp $-77 |
UW: 25.0% down · 7.5% · 30yr · 1.5% tax · 5.0% vac · 8.0% maint · 8.0% mgmt
Financing live
Cash to close
- Down payment
- $70,000
- Closing costs
- $8,400
- Reserves months
- —
- Total cash needed
- —
Loan-product check · same deal, 3 products live
Conventional
25% down · 7.5% · 30yr
- Down + closing
- —
- Monthly P&I
- —
- Monthly cashflow
- —
- DSCR
- —
- Eligible?
- —
Personal DTI + credit; lowest rate.
DSCR
20% down · 8.5% · 30yr
- Down + closing
- —
- Monthly P&I
- —
- Monthly cashflow
- —
- DSCR
- —
- Eligible?
- —
No personal income docs; deal must DSCR.
Hard money
10% down · 12.0% · 12mo
- Down + closing
- —
- Monthly P&I
- —
- Monthly cashflow
- —
- DSCR
- —
- Eligible?
- —
Short-term bridge; refi at stabilization.
Rent comps 6 comps
| Address | Beds | Baths | Sqft | Rent | $/sqft | DOM | Units | Dist |
|---|---|---|---|---|---|---|---|---|
| 1119 N McKnight Rd Saint Louis, MO | 4.0 | 3.0 | 2300 | $2,300 | $1.00 | 0d | 1 | 0.67mi |
| 8638 Mayflower Ct Saint Louis, MO | 4.0 | 2.0 | 3021 | $2,900 | $0.96 | 0d | 1 | 0.68mi |
| 1108 N Hanley Rd St. Louis, MO | 3.0 | 2.0 | 1800 | $1,795 | $1.00 | 14d | 1 | 1.08mi |
| 8701 Delmar Blvd Unit 8701-4C Delmar St. Louis, MO | 3.0 | 2.0 | 1700 | $1,750 | $1.03 | 45d | 1 | 1.36mi |
| 709 Elkington Ln Saint Louis, MO | 3.0 | 2.0 | 1708 | $2,800 | $1.64 | 0d | 1 | 1.43mi |
| 7330 Ahern Ave Saint Louis, MO | 3.0 | 1.5 | 1872 | $2,450 | $1.31 | 45d | 1 | 1.43mi |
Listing history 12 events
-
2026-06-21days on market $280,000 Active 16 DOM
-
2026-06-18days on market $280,000 Active 13 DOM
-
2026-06-17days on market $280,000 Active 12 DOM
-
2026-06-16days on market $280,000 Active 11 DOM
-
2026-06-15days on market $280,000 Active 10 DOM
-
2026-06-13days on market $280,000 Active 8 DOM
-
2026-06-13days on market $280,000 Active 7 DOM
-
2026-06-09days on market $280,000 Active 4 DOM
-
2026-06-08days on market $280,000 Active 3 DOM
-
2026-06-07statusdays on market $280,000 Active 2 DOM
-
2026-06-05remarks 681-char remark
-
2026-06-05$280,000 Coming Soon 1 DOM
ⓘ Source: listings_history table (triggers on properties + properties_extension) + one-shot
backfill from property_details.listing_events for pre-trigger history.
Tax reassessment forecast MO · Resets to sale price
- Current annual tax
- $2,254 · $188/mo
- Projected year-2 tax
- $2,716 · $226/mo
- Expected delta
- +$462/yr (+$38/mo · 20.5%)
ⓘ Screening estimate from a state-policy table — verify with the county assessor before closing.
Climate risk First Street
- Flood 1/10 Low FEMA zone X (unshaded) · 0% chance over 30 yrs
- Wildfire 1/10 Low
- Heat 5/10 Major 7 d/yr ≥107°F today · 21 d/yr by 30 yrs out
- Wind 2/10 Low 100% chance of damaging wind over 30 yrs
- Air quality 4/10 Moderate 4 unhealthy d/yr today · 5 by 30 yrs out
Nearby sold comps map
Loading sold comps map…
Walkable amenities ~0.75 mi
Loading nearby amenities…
Taxation est. · year 1
- Rental income
- $27,977
- − Mortgage interest
- −$15,684
- − Property taxes
- −$2,254
- − Insurance
- −$1,400
- − Repairs & maintenance
- −$2,238
- − Management
- −$2,238
- − Depreciation
- −$8,145
- Taxable loss
- −$3,983
- Est. tax savings @ 24.0%
- +$956
- After-tax cash flow
- $1,783/yr
For passive investors: Depreciation is non-cash, so a rental often shows a tax loss while cash-flowing — sheltering income. Rental losses are passive: they offset passive income freely, and up to $25,000/yr can offset ordinary (W-2) income if you actively participate and your MAGI is under $100k (phasing out to $0 by $150k); unused losses carry forward. On sale, claimed depreciation is recaptured at up to 25%, and gains may owe capital-gains tax (a 1031 exchange can defer both). Figures are a year-1 estimate at your 24.0% rate — not tax advice; consult a CPA.
Schools (NCES district)
- District
- University City
- NCES district ID
- 2930660
- Math proficiency
- 15% ▼ -10.00%
- Reading proficiency
- 26% ▼ -7.00%
- Median HH income
- $52,927
- Composite
- 18.57/100
- National rank
- #8910
- State rank
- #297 of 324 in MO
Livability — University City
- Score
- 73/100
- State rank
- #84
- US rank
- #5618
Category grades
Schools grade is shown separately in the Schools card above.
Census & demographics
- Census place
- University City, MO
- County
- Saint Louis County · 888,823 people
- City population
- 28,910
- Metro
- St. Louis, MO-IL
- Population (ZIP)
- 14,283
- Household income
- $87,385
- Rent vs Own
- Severe rent burden
- 644.0
Population outlook (St. Louis County) Hauer SSP2
- Today (2025)
- 1,025,227 people
- By 2030
- 1,028,023 · +0.3%
- By 2040
- 1,020,940 · -0.4%
- By 2050
- 1,007,280 · -1.8%
- By 2075
- 987,277 · -3.7%
- By 2100
- 921,984 · -10.1%
Race, ethnicity, and origin ACS 2023
- Neighborhood character
- Diverse neighborhood (Simpson 0.66)
- Race & ethnicity
- White 49% Black 27% Asian 16% Two or more races 5% Hispanic / Latino 1%
- Common ancestry
- Romanian 5% Scotch-Irish 3% Slovak 2%
- Foreign-born
- 12% · China, Canada, Philippines
- Languages at home
- 82% English-only · Chinese 9% Other Asian/Pacific 3% Other Indo-European 2%
Political lean MEDSL · St. Louis
- 2024 margin
- Strong D (+23.4) · D 60.8% · R 37.4% · Other 1.7%
- 2008→2024 swing
- +3.5pp toward D · 2008: 19.9pp · 2024: 23.4pp
- All cycles
- 2024: D+23.4 2020: D+24.0 2016: D+16.2 2012: D+13.7 2008: D+19.9
Not yet ingested
- Civics
- —
Market trends
- HPI YoY
- ▼ -482.68%
- Current HPI
- 255.4778
- Rent YoY
- ▲ 6.64%
- Metro
- St. Louis, MO-IL
- State GDP YoY
- ▲ 1.84%
- F500 in state
- 20
Industry mix (Fortune 500 HQ in MO)
| Industry | F500 HQs | Revenue |
|---|---|---|
| Healthcare | 1 | $163B |
|
||
| Insurance | 1 | $21B |
|
||
| Industrial Technology | 1 | $17B |
|
||
| Retail | 1 | $16B |
|
||
| Industrial Distribution | 1 | $10B |
|
||
| Utilities | 1 | $9B |
|
||
Price history
+96.1% since first listed2 events — show timeline
- 2026-06-04 Coming Soon $280,000 MARIS as Distributed by MLS Grid
- 2006-01-18 Sold (Public Records) $142,750 Public Records
Property tax history
+1.9%/yrLatest (2022): $2,254 · +1.0% YoY. Source: county tax records.
Cash-flow waterfall
monthlySold comps — $/sqft
last 12 mo · ≤1 miLoading sold comps…