520 Quaid St · Marlin, TX
Flood risk 1/10 · Minimal
- FEMA flood zone
- X
- Chance of flooding over 30 yrs
- 0.0%
- Est. flood insurance / yr
- $507 – $1,088
Fire risk 4/10 · Minor
- Est. fire insurance / yr
- $1,222 – $2,270
Heat risk 7/10 · Major
- Hot days now (above 109°F)
- 7 days/yr
- Hot days in 30 yrs
- 24 days/yr
Wind risk 6/10 · Moderate
- Chance of severe wind over 30 yrs
- 70.0%
Air-quality risk 1/10 · Minimal
- Unhealthy air days now
- 0 days/yr
- Unhealthy air days in 30 yrs
- 0 days/yr
Risk factors via First Street. Map © Google.
Why this score? — see what drove the B- grade
The composite is a weighted blend of 9 inputs, each scored 0–100. Each bar is that input's sub-score; the figure is the points it added to the 100-point composite (weight × sub-score).
- Cash flow +28.8/30.0
- 1% rule +10.0/10.0
- DSCR +10.0/10.0
- Appreciation +7.1/10.0
- Livability +3.0/5.0
- Rent growth +2.5/5.0
- Condition / age +2.5/5.0
- Schools +1.7/10.0
- ARV discount +0.0/15.0
$98,000
🖨 Deal sheet 📄 Offer letter ✓ Due diligence
Listing remarks MLS
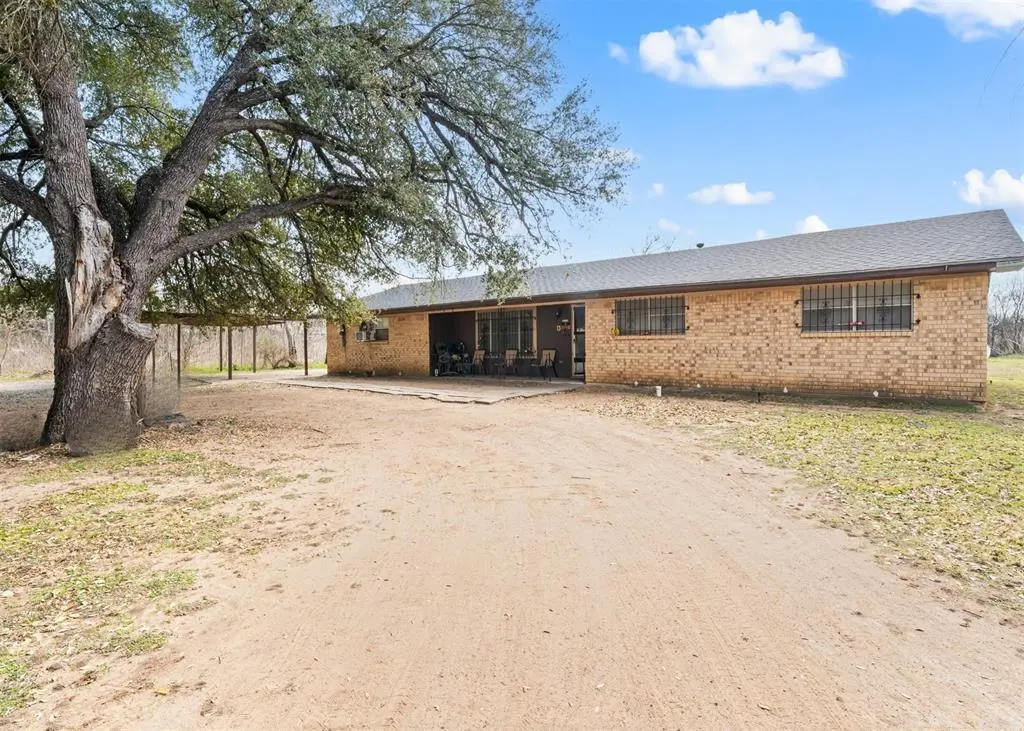
This 4 bedroom, 2 bathroom brick home offers 1,930 sq ft of living space and tons of potential! Mature trees in the front provide great shade, there’s a 2-car carport for convenient parking, and a good-sized backyard with plenty of room to make it your own. Yes, it needs a little TLC, but with a month-to-month tenant already in place, you’ve got income-producing potential from day one! Whether you’re looking to remodel and add value or expand your rental portfolio, this one is full of opportunity.
Key facts
- 2 car carport
- Good sized backyard
- 0.69 acre lot
Tags
Neighborhood map
What this means for you Summary
Snapshot
- This is a 4-bed/2.0-bath single-family listed at $98k.
Deal economics
- At list price, monthly cash flow is $328 ($4k/yr) — positive.
- The deal already cash-flows at list — no discount required.
- Meets the 1% rule at list price ($2k rent vs $98k).
- Recommended offer: $86k (12.0% below list) — sets the bar for market timing.
- Cap rate 10.3% vs local median 5.7% in Marlin — top-decile yield for the area; either an underpriced asset or a hidden risk that comps aren't pricing in. Stress-test before assuming the spread holds.
Location & tenants
- Location reads 59/100 on livability (#1,146 in TX) — a working-class tenant base; expect higher turnover. Strengths: cost of living A+, crime B+, housing B+; Watch: schools F, amenities F, commute F.
- Marlin ISD (town): math 21% / reading 22% proficiency, ranked #779 of 826 in TX (top 94%) — low school quality limits family demand, transient renter base, plan for 1-2y turnover; 84% free/reduced lunch — lower-income household profile, screen leases tightly.
- Market conditions: 122 active listings in the ZIP; 4 units permitted in Falls County in 2024 (0 in 5+ unit buildings).
Forward outlook
- In year one you build about $5k of equity ($678 loan paydown + $4k appreciation (4.2% local appreciation)).
- Falls County population projected at -14% by 2050 — secular population decline; favor cash flow + early exit over multi-decade hold.
- At projected returns (4.2% appreciation + 3.0% rent growth), your $27k cash investment doubles in ~3 years — after that, you're playing with house money.
- By year 7, paydown + projected appreciation supports a ~$30k cash-out refi (75% LTV) — recoverable capital for the next deal without selling this one.
Negotiation context
- It's been on market 122 days — a 12% lower offer ($86k) is reasonable based on typical stale-listing flexibility.
Risks & watch-outs
- Watch-outs: property tax is 3.8% of price.
- Climate carrying-cost: major wind risk, 70% chance of damaging wind over 30y; extreme-heat days projected 7→24/yr by 2055 (HVAC capex compounding) — expect insurance premiums to compound above CPI over the hold.
Questions for the listing agent
- It's been on market 122 days. Have you received any prior offers? Is the seller open to a 12% concession, seller financing, or rate buy-down credit?
- Built in 1974 — when were the roof, HVAC, electrical panel, plumbing, and water heater last replaced?
- Property tax is high relative to price — has the assessment been appealed recently, and will the sale trigger a re-assessment?
- Why hasn't it sold? Are there any deal-killer items the seller is aware of (foundation, flood, title, zoning, code violations)?
- Is there a deadline driving the sale (1031 exchange, divorce, estate, relocation)? That informs how much negotiation room exists.
- Schools are F-rated, which usually means shorter tenancies and higher turnover. Who's the typical renter profile here, and what's been the actual vacancy rate?
- What's the average days-on-market for RENTAL listings here right now (not sales)? A rising rental-DOM trend means longer vacancies and softer asking-rent achievability than the comps imply.
- What's the recent tenant-quality profile in this submarket — average credit score on applications, eviction rate, late-payment / NSF rate, and stable-employment percentage? A property-management company in the area should have these aggregated.
- How much new for-sale + rental construction is in the pipeline within 1–3 miles? Heavy new supply typically softens prices + rents 12–24 months out; constrained supply supports both.
Investment metrics
- 1% rule
- 1.55% ✓
- Cap rate
- 10.32%
- Cash-on-cash
- 14.37%
- DSCR
- 1.64
- GRM
- 5.4
CMA / ARV
- ARV (median comp)
- $82,036
- List price
- $98,000
- Delta
- 19.46%
- Verdict
- OVERPRICED
- Comps
- 19 within 1.0 mi
Show comp detail 2 sales within ~0.75 mi
| Address | Dist | Beds/Ba | Sqft | Sold | Price | $/sf | Match |
|---|---|---|---|---|---|---|---|
| 707 Coleman St | 0.27mi | 3/1.5 (-1) | 1,920 (-0%) | 14mo | $185,000 | $96 | 68 |
| 318 Durr St | 0.36mi | 3/1.0 (-1) | 1,683 (-13%) | 1mo | $66,900 | $40 | 52 |
Match score weights: distance 35% · size 25% · config 20% · recency 20%. Top-matched comps best support the ARV.
Projected returns pro-forma
4.17% appreciation · 3.0% rent growth · sell at horizon
- IRR
- 23.6%
- Equity multiple
- 2.42×
- Total profit
- $39,073
- Equity at exit
- $50,667
- IRR
- 23.6%
- Equity multiple
- 4.74×
- Total profit
- $102,698
- Equity at exit
- $83,661
Cash invested: $27,440 (down + closing). Projections, not guarantees.
Landlord ↔ Tenant lean methodology
- Overall (STATE)
- 87 Strongly Landlord-Friendly
- State Texas
- 87 Strongly Landlord-Friendly · R+5
- County
- — inherits STATE
- City
- — inherits STATE
ZIP-level market 76661
- Home prices YoY
- 3.4%
- Active inventory
- 122
- Price-to-rent
- 5.4×
Monthly cashflow live
- Estimated rent
- $1,515 medium interval (Pro) →
- Mortgage (P&I)
- −$514
- Tax from tax record
- −$313 /mo · $3,760/yr
- Insurance
- −$41
- HOA
- −$0
- Vacancy / Maint / Mgmt
- −$318
- Net cashflow
- $328
Break-even live
UW: 25.0% down · 7.5% · 30yr · 1.5% tax · 5.0% vac · 8.0% maint · 8.0% mgmt
Financing live
Cash to close
- Down payment
- $24,500
- Closing costs
- $2,940
- Reserves months
- —
- Total cash needed
- —
Loan-product check · same deal, 3 products live
Conventional
25% down · 7.5% · 30yr
- Down + closing
- —
- Monthly P&I
- —
- Monthly cashflow
- —
- DSCR
- —
- Eligible?
- —
Personal DTI + credit; lowest rate.
DSCR
20% down · 8.5% · 30yr
- Down + closing
- —
- Monthly P&I
- —
- Monthly cashflow
- —
- DSCR
- —
- Eligible?
- —
No personal income docs; deal must DSCR.
Hard money
10% down · 12.0% · 12mo
- Down + closing
- —
- Monthly P&I
- —
- Monthly cashflow
- —
- DSCR
- —
- Eligible?
- —
Short-term bridge; refi at stabilization.
Listing history 16 events
-
2026-06-18days on market $98,000 Active 122 DOM
-
2026-06-17days on market $98,000 Active 121 DOM
-
2026-06-16days on market $98,000 Active 120 DOM
-
2026-06-15days on market $98,000 Active 119 DOM
-
2026-06-14days on market $98,000 Active 117 DOM
-
2026-06-13days on market $98,000 Active 116 DOM
-
2026-06-10days on market $98,000 Active 114 DOM
-
2026-06-09days on market $98,000 Active 113 DOM
-
2026-06-08days on market $98,000 Active 112 DOM
-
2026-06-07days on market $98,000 Active 111 DOM
-
2026-06-03days on market $98,000 Active 107 DOM
-
2026-06-02days on market $98,000 Active 106 DOM
-
2026-06-01days on market $98,000 Active 105 DOM
-
2026-05-31days on market $98,000 Active 104 DOM
-
2026-05-30days on market $98,000 Active 103 DOM
-
2026-02-16$98,000 Active 521-char remark
Show marketing remark (521 chars)
This 4 bedroom, 2 bathroom brick home offers 1,930 sq ft of living space and tons of potential! Mature trees in the front provide great shade, there’s a 2-car carport for convenient parking, and a good-sized backyard with plenty of room to make it your own. Yes, it needs a little TLC, but with a month-to-month tenant already in place, you’ve got income-producing potential from day one! Whether you’re looking to remodel and add value or expand your rental portfolio, this one is full of opportunity.
ⓘ Source: listings_history table (triggers on properties + properties_extension) + one-shot
backfill from property_details.listing_events for pre-trigger history.
Tax reassessment forecast TX · Resets to sale price
- Current annual tax
- $3,760 · $313/mo
- Projected year-2 tax
- $3,760 · $313/mo
- Expected delta
- $0/yr ($0/mo · 0.0%)
ⓘ Screening estimate from a state-policy table — verify with the county assessor before closing.
Climate risk First Street
- Flood 1/10 Low FEMA zone X · 0% chance over 30 yrs
- Wildfire 4/10 Moderate
- Heat 7/10 Severe 7 d/yr ≥109°F today · 24 d/yr by 30 yrs out
- Wind 6/10 Major 70% chance of damaging wind over 30 yrs
- Air quality 1/10 Low 0 unhealthy d/yr today · 0 by 30 yrs out
Nearby sold comps map
Loading sold comps map…
Walkable amenities ~0.75 mi
Loading nearby amenities…
Taxation est. · year 1
- Rental income
- $18,176
- − Mortgage interest
- −$5,490
- − Property taxes
- −$3,760
- − Insurance
- −$490
- − Repairs & maintenance
- −$1,454
- − Management
- −$1,454
- − Depreciation
- −$2,851
- Taxable income
- $2,677
- Est. tax owed @ 24.0%
- −$643
- After-tax cash flow
- $3,299/yr
For passive investors: Depreciation is non-cash, so a rental often shows a tax loss while cash-flowing — sheltering income. Rental losses are passive: they offset passive income freely, and up to $25,000/yr can offset ordinary (W-2) income if you actively participate and your MAGI is under $100k (phasing out to $0 by $150k); unused losses carry forward. On sale, claimed depreciation is recaptured at up to 25%, and gains may owe capital-gains tax (a 1031 exchange can defer both). Figures are a year-1 estimate at your 24.0% rate — not tax advice; consult a CPA.
Schools (NCES district)
- District
- Marlin ISD
- NCES district ID
- 4829130
- Math proficiency
- 21% ▲ 2.00%
- Reading proficiency
- 22% ▲ 6.00%
- Median HH income
- $29,255
- Composite
- 17.18/100
- National rank
- #9106
- State rank
- #779 of 826 in TX
Livability — Marlin
- Score
- 59/100
- State rank
- #1146
- US rank
- #20161
Category grades
Schools grade is shown separately in the Schools card above.
Census & demographics
- Census place
- Marlin, TX
- Population (ZIP)
- 7,266
Population outlook (Falls County) Hauer SSP2
- Today (2025)
- 15,782 people
- By 2030
- 15,209 · -3.6%
- By 2040
- 14,276 · -9.5%
- By 2050
- 13,645 · -13.5%
- By 2075
- 13,724 · -13.0%
- By 2100
- 13,005 · -17.6%
Race, ethnicity, and origin ACS 2023
- Neighborhood character
- Highly diverse neighborhood (Simpson 0.70)
- Race & ethnicity
- Black 35% Hispanic / Latino 30% White 30% Two or more races 13% Asian 3%
- Hispanic origin (detail)
- Mexican 29%
- Common ancestry
- Romanian 2% Lithuanian 1% Italian 1%
- Foreign-born
- 7% · Canada
- Languages at home
- 84% English-only · Spanish 15%
Political lean MEDSL · Falls
- 2024 margin
- Solid R (+44.7) · D 27.3% · R 72.0%
- 2008→2024 swing
- -25.0pp toward R · 2008: -19.7pp · 2024: -44.7pp
- All cycles
- 2024: R+44.7 2020: R+37.1 2016: R+33.6 2012: R+24.4 2008: R+19.7
Not yet ingested
- Civics
- —
Market trends
- HPI YoY
- ▲ 4.17%
- Current HPI
- 126.9217
- Rent YoY
- —
- Metro
- —
- State GDP YoY
- ▲ 3.95%
- F500 in state
- 110
Industry mix (Fortune 500 HQ in TX)
| Industry | F500 HQs | Revenue |
|---|---|---|
| Energy | 16 | $1,198B |
|
||
| Technology | 5 | $198B |
|
||
| Engineering / Construction | 4 | $72B |
|
||
| Energy Services | 3 | $60B |
|
||
| Utilities | 3 | $41B |
|
||
| Healthcare | 2 | $330B |
|
||
Price history
1 event — show timeline
- 2026-02-16 Listed $98,000 NTREIS
Property tax history
+9.6%/yrLatest (2025): $3,760 · +2.3% YoY. Source: county tax records.
Cash-flow waterfall
monthlySold comps — $/sqft
last 12 mo · ≤1 miLoading sold comps…