7855 Green Lawn Dr #7855 · Houston, TX
Flood risk 6/10 · Moderate
- FEMA flood zone
- X (shaded)
- Chance of flooding over 30 yrs
- 0.68%
- Est. flood insurance / yr
- $507 – $1,088
Fire risk 1/10 · Minimal
- Est. fire insurance / yr
- $1,222 – $2,270
Heat risk 9/10 · Severe
- Hot days now (above 109°F)
- 7 days/yr
- Hot days in 30 yrs
- 24 days/yr
Wind risk 9/10 · Severe
- Chance of severe wind over 30 yrs
- 99.0%
Air-quality risk 3/10 · Minor
- Unhealthy air days now
- 3 days/yr
- Unhealthy air days in 30 yrs
- 4 days/yr
Risk factors via First Street. Map © Google.
Why this score? — see what drove the D- grade
The composite is a weighted blend of 9 inputs, each scored 0–100. Each bar is that input's sub-score; the figure is the points it added to the 100-point composite (weight × sub-score).
- Cash flow +13.4/30.0
- 1% rule +5.1/10.0
- DSCR +4.0/10.0
- ARV discount +3.9/15.0
- Livability +3.7/5.0
- Condition / age +2.5/5.0
- Rent growth +2.2/5.0
- Schools +1.5/10.0
- Appreciation +0.0/10.0
$160,000
🖨 Deal sheet 📄 Offer letter ✓ Due diligence
Listing remarks
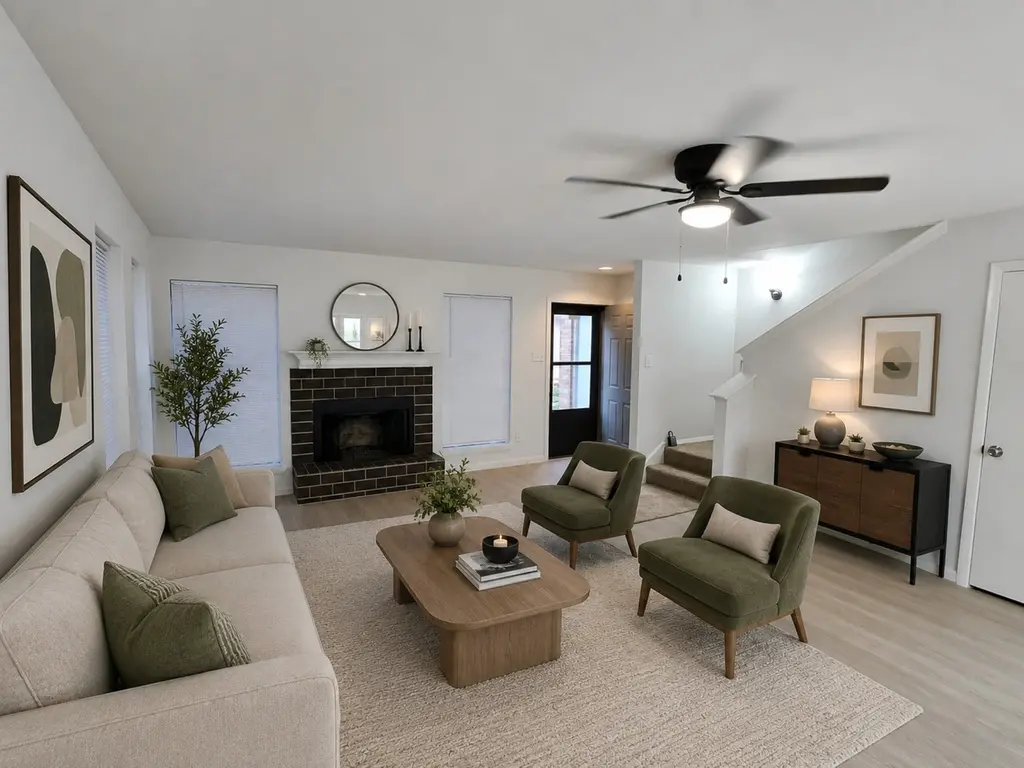
Beautifully updated 2-bedroom, 2.5-bath townhome featuring extensive renovations throughout. The seller has completed the remodel, including new flooring, fresh interior paint, and updated fixtures throughout the home. The redesigned kitchen offers new cabinetry, quartz countertops, a breakfast bar, and brand-new appliances, seamlessly connecting to the breakfast area for easy everyday living and entertaining. Both full bathrooms have been thoughtfully renovated with new shower surrounds, modern fixtures, updated hardware, new cabinetry with quartz countertops, stylish mirrors, and contemporary lighting. The spacious living room features a cozy fireplace, a convenient dry bar, and scenic vi
Key facts
- New flooring
- New cabinetry
- Fresh interior paint
Tags
Property features AI
Finance
- HOA & community: Community managed by Genesis Community Management; Monthly association fee of $75 covering common areas; Community amenities include park, tennis courts, and trails; Curbs in community
Exterior
- Parking: Detached carport; 2-car carport
- Utilities: Public water; Public sewer
- Home design: Residential property; 2 stories; Built in 1978; Slab foundation; Composition roof
- Construction: Brick and wood siding construction
- Exterior features: Deck; Patio; Partial fencing; Storage; Tennis courts; Concrete road access; Has view
Interior
- Kitchen: Electric oven and range; Microwave; Dishwasher; Disposal; Oven
- Bedrooms: Primary bedroom on second level (16x14); Bedroom on second level (12x12)
- Flooring: Carpet; Plank; Tile; Vinyl
- Bathrooms: 2 full bathrooms; 1 half bathroom
- Heating & cooling: Central heating (electric); Central air conditioning (electric)
- Interior features: Wood-burning fireplace; Breakfast bar; Primary bathroom; Quartz counters; Tub with shower; Vanity; Kitchen-dining combo; Programmable thermostat
- Laundry & utility: Washer and dryer included; Laundry in utility room
Neighborhood map
What this means for you Summary
Snapshot
- This is a 2-bed/2.5-bath townhouse listed at $160k.
Deal economics
- At list price, monthly cash flow is $3 ($41/yr) — positive.
- The deal already cash-flows at list — no discount required.
- Meets the 1% rule at list price ($2k rent vs $160k).
- Cap rate 6.3% vs local median 3.2% in Houston — top-decile yield for the area; either an underpriced asset or a hidden risk that comps aren't pricing in. Stress-test before assuming the spread holds.
Location & tenants
- Location reads 74/100 on livability (#184 in TX, #4,771 nationally) — a middle-class / working-renter tenant base. Strengths: amenities A+, cost of living A+, housing A+; Watch: crime F.
- Aldine ISD (suburban): math 16% / reading 21% proficiency, ranked #790 of 826 in TX (top 96%) — low school quality limits family demand, transient renter base, plan for 1-2y turnover; 79% free/reduced lunch — lower-income household profile, screen leases tightly.
- Zoned schools: Hoffman Middle (math 17% / reading 24%, grade F, #1,407 of 1,662 statewide, top 86%, 637 students, 91% FRL); Eisenhower H S (math 16% / reading 23%, grade F, #1,424 of 1,632 statewide, top 88%, 2,855 students, 83% FRL).
- Market conditions: Rents soft (-1.0%/yr); 468 active listings in the ZIP; 10 comparable units currently listed for rent nearby; rentals lingering (median 44d on market — plan ~5-8 weeks vacancy on turnover, expect pricing pressure); 50% of comp listings sitting > 30 days — soft ceiling on asking rent; 29,883 units permitted in Harris County in 2024 (8,621 in 5+ unit buildings).
- This rent runs 36% of the median local income ($54k/yr) — at the standard rent-burdened threshold; future hikes will face affordability resistance.
Forward outlook
- Local home prices are declining (-3.0%/yr); year-one equity from $1k of loan paydown is wiped out by about $5k of value loss. Plan a longer hold.
- Harris County population projected at +47% by 2050 — long-run rental-demand tailwind backs the buy-and-hold thesis.
Negotiation context
- Only 13 days on market — expect competitive offers; lowballing is unlikely to land.
Risks & watch-outs
- Climate carrying-cost: major flood risk; severe wind risk, 99% chance of damaging wind over 30y; extreme-heat days projected 7→24/yr by 2055 (HVAC capex compounding) — expect insurance premiums to compound above CPI over the hold.
Questions for the listing agent
- Built in 1978 — when were the roof, HVAC, electrical panel, plumbing, and water heater last replaced?
- What does the HOA fee cover, when was the last increase, and are there any pending special assessments or reserve-fund shortfalls?
- Is there a deadline driving the sale (1031 exchange, divorce, estate, relocation)? That informs how much negotiation room exists.
- Schools are D-rated, which usually means shorter tenancies and higher turnover. Who's the typical renter profile here, and what's been the actual vacancy rate?
- Crime grade is F in this area — have there been break-ins, vandalism, or insurance claims at this property in the last 3 years? What carrier currently insures it and at what premium?
- The area grade is low — what's the realistic commute time and amenity access for the typical tenant pool here? Any planned neighborhood developments (good or bad) we should know about?
- What's the average days-on-market for RENTAL listings here right now (not sales)? A rising rental-DOM trend means longer vacancies and softer asking-rent achievability than the comps imply.
- What's the recent tenant-quality profile in this submarket — average credit score on applications, eviction rate, late-payment / NSF rate, and stable-employment percentage? A property-management company in the area should have these aggregated.
- How much new for-sale + rental construction is in the pipeline within 1–3 miles? Heavy new supply typically softens prices + rents 12–24 months out; constrained supply supports both.
Investment metrics
- 1% rule
- 1.01% ✓
- Cap rate
- 6.32%
- Cash-on-cash
- 0.09%
- DSCR
- 1.00
- GRM
- 8.2
CMA / ARV
- ARV (on-the-fly)
- $148,050
- Comps found
- 9
Show comp detail 9 sales within ~0.75 mi
| Address | Dist | Beds/Ba | Sqft | Sold | Price | $/sf | Match |
|---|---|---|---|---|---|---|---|
| 7736 Challie Ln | 0.19mi | 2/2.5 | 1,575 (0%) | 7mo | $130,000 | $83 | 85 |
| 7836 Bateman Ln #7836 | 0.14mi | 3/2.5 (+1) | 1,572 (-0%) | 8mo | $147,000 | $94 | 81 |
| 5939 Arncliffe Dr | 0.14mi | 3/2.5 (+1) | 1,554 (-1%) | 7mo | $155,000 | $100 | 80 |
| 7807 Challie Ln | 0.16mi | 2/2.5 | 1,575 (0%) | 18mo | $139,999 | $89 | 78 |
| 7821 Bateman Ln #7821 | 0.11mi | 2/2.0 | 1,449 (-8%) | 4mo | $135,000 | $93 | 76 |
| 5930 Arncliffe Dr | 0.15mi | 3/2.5 (+1) | 1,728 (+10%) | 2mo | $149,900 | $87 | 70 |
| 7840 Bateman Ln | 0.13mi | 3/2.0 (+1) | 1,394 (-12%) | 3mo | $149,000 | $107 | 65 |
| 7838 Challie Ln | 0.19mi | 2/2.5 | 1,646 (+4%) | 23mo | $179,000 | $109 | 65 |
| 7854 Green Lawn Dr #7854 | 0.07mi | 2/2.0 | 1,455 (-8%) | 21mo | $159,000 | $109 | 64 |
Match score weights: distance 35% · size 25% · config 20% · recency 20%. Top-matched comps best support the ARV.
Projected returns pro-forma
-3.0% appreciation · 0.0% rent growth · sell at horizon
- IRR
- -20.0%
- Equity multiple
- 0.32×
- Total profit
- $-30,320
- Equity at exit
- $23,857
- IRR
- -23.1%
- Equity multiple
- 0.02×
- Total profit
- $-43,923
- Equity at exit
- $13,834
Cash invested: $44,800 (down + closing). Projections, not guarantees.
Landlord ↔ Tenant lean methodology
- Overall (STATE)
- 87 Strongly Landlord-Friendly
- State Texas
- 87 Strongly Landlord-Friendly · R+5
- County
- — inherits STATE
- City
- — inherits STATE
ZIP-level market 77088
- Home prices YoY
- -23.2%
- Rents YoY
- -1.0%
- Active inventory
- 468
- Price-to-rent
- 8.2×
Monthly cashflow live
- Estimated rent
- $1,618 high interval (Pro) →
- Mortgage (P&I)
- −$839
- Tax from tax record
- −$294 /mo · $3,528/yr
- Insurance
- −$67
- HOA
- −$75
- Vacancy / Maint / Mgmt
- −$340
- Net cashflow
- $3
Break-even live
UW: 25.0% down · 7.5% · 30yr · 1.5% tax · 5.0% vac · 8.0% maint · 8.0% mgmt
Financing live
Cash to close
- Down payment
- $40,000
- Closing costs
- $4,800
- Reserves months
- —
- Total cash needed
- —
Loan-product check · same deal, 3 products live
Conventional
25% down · 7.5% · 30yr
- Down + closing
- —
- Monthly P&I
- —
- Monthly cashflow
- —
- DSCR
- —
- Eligible?
- —
Personal DTI + credit; lowest rate.
DSCR
20% down · 8.5% · 30yr
- Down + closing
- —
- Monthly P&I
- —
- Monthly cashflow
- —
- DSCR
- —
- Eligible?
- —
No personal income docs; deal must DSCR.
Hard money
10% down · 12.0% · 12mo
- Down + closing
- —
- Monthly P&I
- —
- Monthly cashflow
- —
- DSCR
- —
- Eligible?
- —
Short-term bridge; refi at stabilization.
Rent comps 10 comps
| Address | Beds | Baths | Sqft | Rent | $/sqft | DOM | Units | Dist |
|---|---|---|---|---|---|---|---|---|
| 7800 Bayou Forest Dr Houston, TX | 2.0 | 1.5 | 1105 | $1,350 | $1.22 | 43d | 4 | 0.15mi |
| 7302 Alabonson Rd Houston, TX | 1.0–2.0 | 1.0–2.0 | 823 | $1,162 | $1.41 | 20d | 49 | 0.27mi |
| 13 Regency Ln Houston, TX | 2.0 | 2.0 | 1354 | $1,650 | $1.22 | 43d | 1 | 0.71mi |
| 6018 Elkwood Forest Dr Houston, TX | 3.0 | 2.0 | 1840 | $1,975 | $1.07 | 43d | 1 | 0.71mi |
| 7058 W Gulf Bank Rd Houston, TX | 2.0 | 2.0–2.5 | 870 | $1,364 | $1.57 | 3d | 3 | 1.06mi |
| 8515 Bartletts Harbor Ct Houston, TX | 3.0 | 2.5 | 1812 | $1,989 | $1.10 | 16d | 1 | 1.17mi |
| 7628 Inwood Hills Ln Houston, TX | 3.0 | 3.0 | 1768 | $2,500 | $1.41 | 43d | 1 | 1.18mi |
| 8822 Woodcamp Dr Houston, TX | 3.0 | 2.5 | 1687 | $1,740 | $1.03 | 5d | 1 | 1.21mi |
| 6807 Ashland Forest Dr Houston, TX | 3.0 | 2.0 | 1790 | $1,850 | $1.03 | 43d | 1 | 1.30mi |
| 5415 Fair Forest Dr Houston, TX | 3.0 | 2.0 | 1752 | $1,861 | $1.06 | 19d | 1 | 1.33mi |
HOA detail
- Monthly dues
- $75 · $900/yr
Listing history 10 events
-
2026-06-18days on market $160,000 Active 13 DOM
-
2026-06-17days on market $160,000 Active 12 DOM
-
2026-06-16days on market $160,000 Active 11 DOM
-
2026-06-15days on market $160,000 Active 10 DOM
-
2026-06-13days on market $160,000 Active 8 DOM
-
2026-06-13days on market $160,000 Active 7 DOM
-
2026-06-09days on market $160,000 Active 4 DOM
-
2026-06-08days on market $160,000 Active 3 DOM
-
2026-06-07remarks 699-char remark
-
2026-06-07$160,000 Active 2 DOM
ⓘ Source: listings_history table (triggers on properties + properties_extension) + one-shot
backfill from property_details.listing_events for pre-trigger history.
Tax reassessment forecast TX · Resets to sale price
- Current annual tax
- $3,528 · $294/mo
- Projected year-2 tax
- $3,528 · $294/mo
- Expected delta
- $0/yr ($0/mo · 0.0%)
ⓘ Screening estimate from a state-policy table — verify with the county assessor before closing.
Climate risk First Street
- Flood 6/10 Major FEMA zone X (shaded) · 68% chance over 30 yrs
- Wildfire 1/10 Low
- Heat 9/10 Extreme 7 d/yr ≥109°F today · 24 d/yr by 30 yrs out
- Wind 9/10 Extreme 99% chance of damaging wind over 30 yrs
- Air quality 3/10 Moderate 3 unhealthy d/yr today · 4 by 30 yrs out
Nearby sold comps map
Loading sold comps map…
Walkable amenities ~0.75 mi
Loading nearby amenities…
Taxation est. · year 1
- Rental income
- $19,416
- − Mortgage interest
- −$8,962
- − Property taxes
- −$3,528
- − Insurance
- −$800
- − Repairs & maintenance
- −$1,553
- − Management
- −$1,553
- − HOA
- −$900
- − Depreciation
- −$4,655
- Taxable loss
- −$2,536
- Est. tax savings @ 24.0%
- +$609
- After-tax cash flow
- $650/yr
For passive investors: Depreciation is non-cash, so a rental often shows a tax loss while cash-flowing — sheltering income. Rental losses are passive: they offset passive income freely, and up to $25,000/yr can offset ordinary (W-2) income if you actively participate and your MAGI is under $100k (phasing out to $0 by $150k); unused losses carry forward. On sale, claimed depreciation is recaptured at up to 25%, and gains may owe capital-gains tax (a 1031 exchange can defer both). Figures are a year-1 estimate at your 24.0% rate — not tax advice; consult a CPA.
Schools (NCES district)
- District
- Aldine ISD
- NCES district ID
- 4807710
- Math proficiency
- 16% ▼ -23.00%
- Reading proficiency
- 21% ▼ -11.00%
- Median HH income
- $37,081
- Composite
- 15.42/100
- National rank
- #9317
- State rank
- #790 of 826 in TX
Livability — Houston
- Score
- 74/100
- State rank
- #184
- US rank
- #4771
Category grades
Schools grade is shown separately in the Schools card above.
Census & demographics
- Census place
- Houston, TX
- County
- Harris County · 4,702,590 people
- City population
- 3,226,434
- Metro
- Houston-The Woodlands-Sugar Land, TX
- Population (ZIP)
- 57,047
- Household income
- $54,411
- Rent vs Own
- Severe rent burden
- 2294.0
Population outlook (Harris County) Hauer SSP2
- Today (2025)
- 5,571,493 people
- By 2030
- 6,089,821 · +9.3%
- By 2040
- 7,142,806 · +28.2%
- By 2050
- 8,185,864 · +46.9%
- By 2075
- 10,574,329 · +89.8%
- By 2100
- 12,109,958 · +117.4%
Race, ethnicity, and origin ACS 2023
- Neighborhood character
- Diverse neighborhood (Simpson 0.59)
- Race & ethnicity
- Hispanic / Latino 52% Black 37% Two or more races 18% White 6% Asian 4%
- Hispanic origin (detail)
- Mexican 36%
- Common ancestry
- Lithuanian 1%
- Foreign-born
- 25% · Canada, Vietnam, China
- Languages at home
- 49% English-only · Spanish 47% Vietnamese 3%
Political lean MEDSL · Harris
- 2024 margin
- Lean D (+5.5) · D 52.0% · R 46.4% · Other 1.6%
- 2008→2024 swing
- +3.9pp toward D · 2008: 1.6pp · 2024: 5.5pp
- All cycles
- 2024: D+5.5 2020: D+13.3 2016: D+12.4 2012: D+0.1 2008: D+1.6
Not yet ingested
- Civics
- —
Market trends
- HPI YoY
- ▼ -98.37%
- Current HPI
- 325.0499
- Rent YoY
- ▼ -1.01%
- Metro
- Houston-The Woodlands-Sugar Land, TX
- State GDP YoY
- ▲ 3.95%
- F500 in state
- 110
Industry mix (Fortune 500 HQ in TX)
| Industry | F500 HQs | Revenue |
|---|---|---|
| Energy | 16 | $1,198B |
|
||
| Technology | 5 | $198B |
|
||
| Engineering / Construction | 4 | $72B |
|
||
| Energy Services | 3 | $60B |
|
||
| Utilities | 3 | $41B |
|
||
| Healthcare | 2 | $330B |
|
||
Price history
3 events — show timeline
- 2026-06-05 Listed $160,000 HARMLS
- 2026-04-15 Sold (Public Records) — Public Records
- 1988-08-20 Sold (Public Records) — Public Records
Property tax history
+10.3%/yrLatest (2025): $3,528 · +10.9% YoY. Source: county tax records.
Cash-flow waterfall
monthlySold comps — $/sqft
last 12 mo · ≤1 miLoading sold comps…