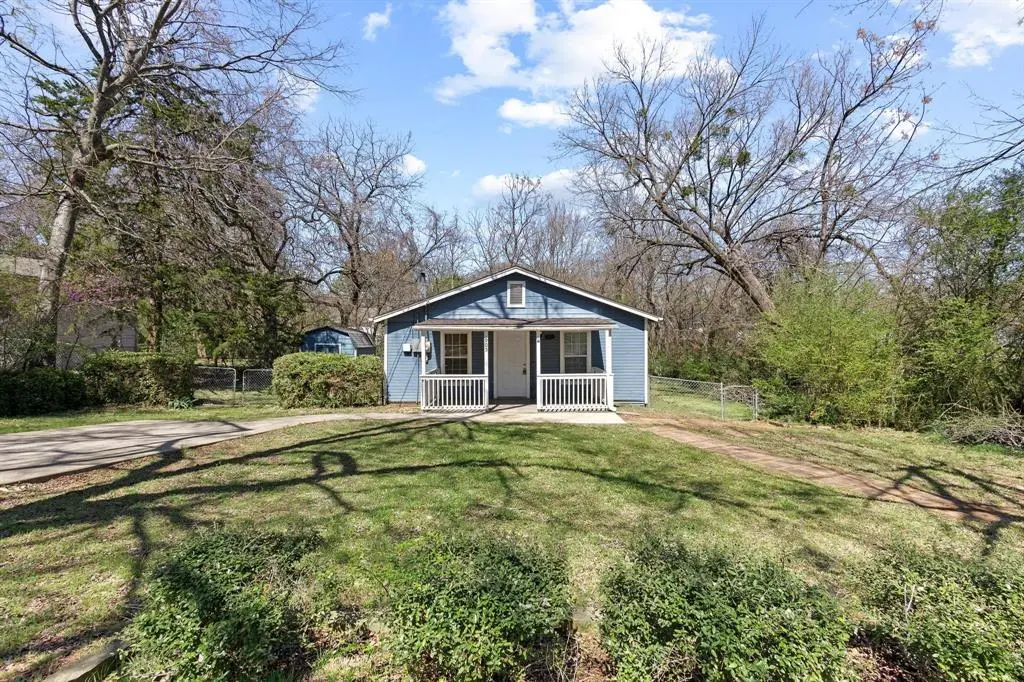
905 Thatcher St · Denison, TX
Flood risk 1/10 · Minimal
- FEMA flood zone
- X (unshaded)
- Chance of flooding over 30 yrs
- 0.0%
- Est. flood insurance / yr
- $507 – $1,088
Fire risk 3/10 · Minor
- Est. fire insurance / yr
- $1,222 – $2,270
Heat risk 6/10 · Moderate
- Hot days now (above 108°F)
- 7 days/yr
- Hot days in 30 yrs
- 21 days/yr
Wind risk 4/10 · Minor
- Chance of severe wind over 30 yrs
- 22.0%
Air-quality risk 2/10 · Minimal
- Unhealthy air days now
- 2 days/yr
- Unhealthy air days in 30 yrs
- 2 days/yr
Risk factors via First Street. Map © Google.
Why this score? — see what drove the D- grade
The composite is a weighted blend of 9 inputs, each scored 0–100. Each bar is that input's sub-score; the figure is the points it added to the 100-point composite (weight × sub-score).
- Cash flow +12.2/30.0
- ARV discount +7.6/15.0
- 1% rule +4.2/10.0
- Schools +3.7/10.0
- Livability +3.7/5.0
- DSCR +3.6/10.0
- Rent growth +2.5/5.0
- Condition / age +2.5/5.0
- Appreciation +0.0/10.0
$149,000
🖨 Deal sheet (PDF) 📄 Offer letter ✓ Due diligence
Listing remarks MLS
This 3-bedroom, 2-bath home at 905 Thatcher Street offers an excellent opportunity for buyers seeking affordability and space at an attractive price point. With 936 square feet of single-story living, the home features a functional layout with a dedicated living area and separate dining space, providing comfortable day-to-day living. Situated on an oversized 0.273-acre lot, the property stands out with its expansive yard, offering outdoor flexibility and potential that is hard to find in this price range. The home also includes a private driveway, city utilities, and no HOA, adding to its overall appeal and accessibility. Built in 1986 and priced competitively, this property presents strong value for first-time buyers, downsizers, or investors looking to secure a property with both land and potential. Schedule your viewing today.
Key facts
- City utilities
- Private driveway
- Expansive yard
Tags
Neighborhood map
What this means for you Summary
Snapshot
- This is a 3-bed/2.0-bath single-family listed at $149k.
Deal economics
- At list price, monthly cash flow is $-31 ($-367/yr) — negative.
- To cash-flow at today's rent, offer at most $144k (3.6% below list).
- To meet the 1% rule (rent ≥ 1% of price), the offer needs to be $137k (7.9% below list).
- Recommended offer: $137k (7.9% below list) — sets the bar for 1% rule.
- Cap rate 6.0% vs local median 3.9% in Denison — top-decile yield for the area; either an underpriced asset or a hidden risk that comps aren't pricing in. Stress-test before assuming the spread holds.
Location & tenants
- Location reads 73/100 on livability (#221 in TX) — a middle-class / working-renter tenant base. Strengths: cost of living A+, housing A+, crime A; Watch: health & safety D+, amenities F, commute F.
- Denison ISD (urban): math 43% / reading 44% proficiency, ranked #315 of 826 in TX (top 38%) — families likely to look elsewhere, expect single-tenant / working-renter base with shorter leases.
- Zoned schools: Hyde Park El (math 52% / reading 47%, grade D, #865 of 4,322 statewide, top 21%, 465 students, 54% FRL); Henry Scott Middle (math 36% / reading 48%, grade D-, #572 of 1,662 statewide, top 36%, 749 students, 66% FRL); Denison H S (math 53% / reading 53%, grade C-, #437 of 1,632 statewide, top 27%, 1,310 students, 58% FRL) — zoned schools at 59% FRL track the district average.
- Market conditions: Rents flat; 492 active listings in the ZIP; 16 comparable units currently listed for rent nearby; rentals lingering (median 46d on market — plan ~5-8 weeks vacancy on turnover, expect pricing pressure); 56% of comp listings sitting > 30 days — soft ceiling on asking rent; 2,272 units permitted in Grayson County in 2024 (750 in 5+ unit buildings).
Forward outlook
- Local home prices are declining (-3.0%/yr); year-one equity from $1k of loan paydown is wiped out by about $4k of value loss. Plan a longer hold.
- Grayson County population projected at +12% by 2050 — modest demand growth; plan on rents tracking national, not racing it.
Negotiation context
- It's been on market 54 days — a 3% lower offer ($145k) is reasonable based on typical stale-listing flexibility.
- 6 sale attempts since 10y ago; this cycle's ask has dropped $10k (6%) from the opening price — seller is motivated, your offer sets the floor, not the list.
Risks & watch-outs
- Climate carrying-cost: extreme-heat days projected 7→21/yr by 2055 (HVAC capex compounding) — expect insurance premiums to compound above CPI over the hold.
Questions for the listing agent
- What do current leases actually rent for vs. the listed asking? Can we see a recent rent roll and the last 12 months of T-12 income?
- It's been on market 54 days. Have you received any prior offers? Is the seller open to a 8% concession, seller financing, or rate buy-down credit?
- Is there a deadline driving the sale (1031 exchange, divorce, estate, relocation)? That informs how much negotiation room exists.
- Schools are D-rated, which usually means shorter tenancies and higher turnover. Who's the typical renter profile here, and what's been the actual vacancy rate?
- The area grade is low — what's the realistic commute time and amenity access for the typical tenant pool here? Any planned neighborhood developments (good or bad) we should know about?
- What's the average days-on-market for RENTAL listings here right now (not sales)? A rising rental-DOM trend means longer vacancies and softer asking-rent achievability than the comps imply.
- What's the recent tenant-quality profile in this submarket — average credit score on applications, eviction rate, late-payment / NSF rate, and stable-employment percentage? A property-management company in the area should have these aggregated.
- How much new for-sale + rental construction is in the pipeline within 1–3 miles? Heavy new supply typically softens prices + rents 12–24 months out; constrained supply supports both.
Investment metrics
- 1% rule
- 0.92% ✗
- Cap rate
- 6.05%
- Cash-on-cash
- -0.88%
- DSCR
- 0.96
- GRM
- 9.1
CMA / ARV
- ARV (median comp)
- $149,297
- List price
- $149,000
- Delta
- -0.20%
- Verdict
- FAIR
- Comps
- 20 within 1.0 mi
Show comp detail 10 sales within ~0.75 mi
| Address | Dist | Beds/Ba | Sqft | Sold | Price | $/sf | Match |
|---|---|---|---|---|---|---|---|
| 905 Thatcher St | 0.00mi | 3/2.0 | 936 (0%) | 1mo | $149,000 | $159 | 99 |
| 515 Forrest Ln | 0.43mi | 3/1.5 | 980 (+5%) | 4mo | $145,000 | $148 | 66 |
| 1027 Star St | 0.21mi | 2/1.0 (-1) | 924 (-1%) | 21mo | $138,000 | $149 | 62 |
| 514 W Baker St | 0.41mi | 2/2.0 (-1) | 896 (-4%) | 11mo | $175,000 | $195 | 60 |
| 933 W Ford St | 0.52mi | 2/1.0 (-1) | 910 (-3%) | 8mo | $160,000 | $176 | 56 |
| 1050 Star St | 0.24mi | 2/1.0 (-1) | 840 (-10%) | 10mo | $129,000 | $154 | 54 |
| 513 W Coffin St | 0.54mi | 3/1.0 | 1,049 (+12%) | 2mo | $62,500 | $60 | 49 |
| 907 W Ford St | 0.51mi | 3/1.0 | 846 (-10%) | 13mo | $149,900 | $177 | 45 |
| 1054 Star St | 0.25mi | 2/1.0 (-1) | 840 (-10%) | 23mo | $155,000 | $185 | 43 |
| 911 Rice St | 0.32mi | 2/1.0 (-1) | 1,064 (+14%) | 16mo | $118,950 | $112 | 40 |
Match score weights: distance 35% · size 25% · config 20% · recency 20%. Top-matched comps best support the ARV.
Projected returns pro-forma
-3.0% appreciation · 0.05% rent growth · sell at horizon
- IRR
- -21.3%
- Equity multiple
- 0.28×
- Total profit
- $-29,975
- Equity at exit
- $22,216
- IRR
- -24.9%
- Equity multiple
- -0.05×
- Total profit
- $-43,613
- Equity at exit
- $12,883
Cash invested: $41,720 (down + closing). Projections, not guarantees.
Landlord ↔ Tenant lean methodology
- Overall (STATE)
- 87 Strongly Landlord-Friendly
- State Texas
- 87 Strongly Landlord-Friendly · R+5
- County
- — inherits STATE
- City
- — inherits STATE
ZIP-level market 75020
- Rents YoY
- 0.1%
- Active inventory
- 492
- Price-to-rent
- 9.1×
Monthly cashflow live
- Estimated rent
- $1,372 high interval (Pro) →
- Mortgage (P&I)
- −$781
- Tax from tax record
- −$271 /mo · $3,248/yr
- Insurance
- −$62
- HOA
- −$0
- Vacancy / Maint / Mgmt
- −$288
- Net cashflow
- $-31
Break-even live
Sensitivity live
| Price | -10% $54 | -5% $12 | +0% $-31 | +5% $-73 | +10% $-115 |
|---|---|---|---|---|---|
| Rent | -10% $-139 | -5% $-85 | +0% $-31 | +5% $24 | +10% $78 |
| Rate | -1.0pp $44 | -0.5pp $7 | base $-31 | +0.5pp $-69 | +1.0pp $-108 |
UW: 25.0% down · 7.5% · 30yr · 1.5% tax · 5.0% vac · 8.0% maint · 8.0% mgmt
Financing live
Cash to close
- Down payment
- $37,250
- Closing costs
- $4,470
- Reserves months
- —
- Total cash needed
- —
Loan-product check · same deal, 3 products live
Conventional
25% down · 7.5% · 30yr
- Down + closing
- —
- Monthly P&I
- —
- Monthly cashflow
- —
- DSCR
- —
- Eligible?
- —
Personal DTI + credit; lowest rate.
DSCR
20% down · 8.5% · 30yr
- Down + closing
- —
- Monthly P&I
- —
- Monthly cashflow
- —
- DSCR
- —
- Eligible?
- —
No personal income docs; deal must DSCR.
Hard money
10% down · 12.0% · 12mo
- Down + closing
- —
- Monthly P&I
- —
- Monthly cashflow
- —
- DSCR
- —
- Eligible?
- —
Short-term bridge; refi at stabilization.
Rent comps 16 comps
| Address | Beds | Baths | Sqft | Rent | $/sqft | DOM | Units | Dist |
|---|---|---|---|---|---|---|---|---|
| 1021 Rice St Unit 102 Denison, TX | 2.0 | 2.0 | 1013 | $1,125 | $1.11 | 46d | 1 | 0.38mi |
| 531 W Collins St Unit NA Denison, TX | 4.0 | 2.0 | 1080 | $1,560 | $1.44 | 23d | 1 | 0.44mi |
| 2400 S Barrett Ave Denison, TX | 3.0 | 2.0 | 1090 | $1,349 | $1.24 | 46d | 1 | 0.44mi |
| 615 W Coffin St Denison, TX | 2.0 | 1.0 | 800 | $1,250 | $1.56 | 23d | 1 | 0.48mi |
| 740 W Bullock St Denison, TX | 2.0 | 1.0 | 1000 | $1,250 | $1.25 | 23d | 1 | 0.84mi |
| 1527 S Austin Ave Denison, TX | 1.0–2.0 | 1.0–1.5 | 850 | $999 | $1.18 | 23d | 2 | 1.13mi |
| 108 W Acheson St Denison, TX | 3.0 | 2.0 | 1056 | $1,550 | $1.47 | 46d | 1 | 1.22mi |
| 818 W Texas St Denison, TX | 3.0 | 1.0 | 720 | $1,100 | $1.53 | 23d | 1 | 1.27mi |
| 1011 S Perry Ave Denison, TX | 2.0 | 2.0 | 1079 | $1,350 | $1.25 | 46d | 1 | 1.32mi |
| 214 E Acheson St Denison, TX | 2.0 | 1.0 | 963 | $1,499 | $1.56 | 46d | 1 | 1.33mi |
| 912 S Armstrong st. / 731 W. Hull AVE Denison, TX | 2.0 | 1.0 | 580 | $849 | $1.46 | 23d | 1 | 1.37mi |
| 701 W Hull St Denison, TX | 2.0 | 1.0 | 637 | $1,100 | $1.73 | 46d | 1 | 1.39mi |
| 526 W Munson St Denison, TX | 2.0 | 1.0 | 778 | $849 | $1.09 | 23d | 2 | 1.45mi |
| 526 W Munson St Unit 2 Denison, TX | 2.0 | 1.0 | 778 | $999 | $1.28 | 46d | 1 | 1.45mi |
| 120 E Monterey St Unit 120 Denison, TX | 2.0 | 1.0 | 800 | $900 | $1.12 | 46d | 1 | 1.45mi |
| 224 W Hull St Unit A Denison, TX | 2.0 | 1.0 | 743 | $1,250 | $1.68 | 46d | 1 | 1.47mi |
Listing history 19 events
-
2026-05-14status Pending 850-char remark
Show marketing remark (850 chars)
This 3-bedroom, 2-bath home at 905 Thatcher Street offers an excellent opportunity for buyers seeking affordability and space at an attractive price point. With 936 square feet of single-story living, the home features a functional layout with a dedicated living area and separate dining space, providing comfortable day-to-day living. Situated on an oversized 0.273-acre lot, the property stands out with its expansive yard, offering outdoor flexibility and potential that is hard to find in this price range. The home also includes a private driveway, city utilities, and no HOA, adding to its overall appeal and accessibility. Built in 1986 and priced competitively, this property presents strong value for first-time buyers, downsizers, or investors looking to secure a property with both land and potential. Schedule your viewing today.
-
2026-05-10historical Active Option Contract 850-char remark
Show marketing remark (850 chars)
This 3-bedroom, 2-bath home at 905 Thatcher Street offers an excellent opportunity for buyers seeking affordability and space at an attractive price point. With 936 square feet of single-story living, the home features a functional layout with a dedicated living area and separate dining space, providing comfortable day-to-day living. Situated on an oversized 0.273-acre lot, the property stands out with its expansive yard, offering outdoor flexibility and potential that is hard to find in this price range. The home also includes a private driveway, city utilities, and no HOA, adding to its overall appeal and accessibility. Built in 1986 and priced competitively, this property presents strong value for first-time buyers, downsizers, or investors looking to secure a property with both land and potential. Schedule your viewing today.
-
2026-04-21status Active 850-char remark
Show marketing remark (850 chars)
This 3-bedroom, 2-bath home at 905 Thatcher Street offers an excellent opportunity for buyers seeking affordability and space at an attractive price point. With 936 square feet of single-story living, the home features a functional layout with a dedicated living area and separate dining space, providing comfortable day-to-day living. Situated on an oversized 0.273-acre lot, the property stands out with its expansive yard, offering outdoor flexibility and potential that is hard to find in this price range. The home also includes a private driveway, city utilities, and no HOA, adding to its overall appeal and accessibility. Built in 1986 and priced competitively, this property presents strong value for first-time buyers, downsizers, or investors looking to secure a property with both land and potential. Schedule your viewing today.
-
2026-04-20historical Active Option Contract 850-char remark
Show marketing remark (850 chars)
This 3-bedroom, 2-bath home at 905 Thatcher Street offers an excellent opportunity for buyers seeking affordability and space at an attractive price point. With 936 square feet of single-story living, the home features a functional layout with a dedicated living area and separate dining space, providing comfortable day-to-day living. Situated on an oversized 0.273-acre lot, the property stands out with its expansive yard, offering outdoor flexibility and potential that is hard to find in this price range. The home also includes a private driveway, city utilities, and no HOA, adding to its overall appeal and accessibility. Built in 1986 and priced competitively, this property presents strong value for first-time buyers, downsizers, or investors looking to secure a property with both land and potential. Schedule your viewing today.
-
2026-04-07price $149,000 850-char remark
Show marketing remark (850 chars)
This 3-bedroom, 2-bath home at 905 Thatcher Street offers an excellent opportunity for buyers seeking affordability and space at an attractive price point. With 936 square feet of single-story living, the home features a functional layout with a dedicated living area and separate dining space, providing comfortable day-to-day living. Situated on an oversized 0.273-acre lot, the property stands out with its expansive yard, offering outdoor flexibility and potential that is hard to find in this price range. The home also includes a private driveway, city utilities, and no HOA, adding to its overall appeal and accessibility. Built in 1986 and priced competitively, this property presents strong value for first-time buyers, downsizers, or investors looking to secure a property with both land and potential. Schedule your viewing today.
-
2026-03-17$159,000 Active 850-char remark
Show marketing remark (850 chars)
This 3-bedroom, 2-bath home at 905 Thatcher Street offers an excellent opportunity for buyers seeking affordability and space at an attractive price point. With 936 square feet of single-story living, the home features a functional layout with a dedicated living area and separate dining space, providing comfortable day-to-day living. Situated on an oversized 0.273-acre lot, the property stands out with its expansive yard, offering outdoor flexibility and potential that is hard to find in this price range. The home also includes a private driveway, city utilities, and no HOA, adding to its overall appeal and accessibility. Built in 1986 and priced competitively, this property presents strong value for first-time buyers, downsizers, or investors looking to secure a property with both land and potential. Schedule your viewing today.
-
2023-12-15historical $1,250
-
2023-12-06$1,250
-
2017-03-10soldstatus
-
2017-03-09soldstatus Sold 239-char remark
Show marketing remark (239 chars)
Investor Special. 3 bedroom 1 bath with large deck. Large fenced yard. 2 storage buildings. Potential here for retirement or rental property. Easy access to highway, shopping and hosptials. Buyer to verify school district and measurements.
-
2017-03-06status Pending 239-char remark
Show marketing remark (239 chars)
Investor Special. 3 bedroom 1 bath with large deck. Large fenced yard. 2 storage buildings. Potential here for retirement or rental property. Easy access to highway, shopping and hosptials. Buyer to verify school district and measurements.
-
2016-11-06status Active 239-char remark
Show marketing remark (239 chars)
Investor Special. 3 bedroom 1 bath with large deck. Large fenced yard. 2 storage buildings. Potential here for retirement or rental property. Easy access to highway, shopping and hosptials. Buyer to verify school district and measurements.
-
2016-10-27historical Active Option Contract 239-char remark
Show marketing remark (239 chars)
Investor Special. 3 bedroom 1 bath with large deck. Large fenced yard. 2 storage buildings. Potential here for retirement or rental property. Easy access to highway, shopping and hosptials. Buyer to verify school district and measurements.
-
2016-10-01$45,000 Active 239-char remark
Show marketing remark (239 chars)
Investor Special. 3 bedroom 1 bath with large deck. Large fenced yard. 2 storage buildings. Potential here for retirement or rental property. Easy access to highway, shopping and hosptials. Buyer to verify school district and measurements.
-
2016-09-21historical
-
2016-08-17price $45,000
-
2016-04-24price $50,000
-
2016-01-23$55,000 Active
-
1995-07-28soldstatus
ⓘ Source: listings_history table (triggers on properties + properties_extension) + one-shot
backfill from property_details.listing_events for pre-trigger history.
Tax reassessment forecast TX · Resets to sale price
- Current annual tax
- $3,248 · $271/mo
- Projected year-2 tax
- $3,248 · $271/mo
- Expected delta
- $0/yr ($0/mo · 0.0%)
ⓘ Screening estimate from a state-policy table — verify with the county assessor before closing.
Climate risk First Street
- Flood 1/10 Low FEMA zone X (unshaded) · 0% chance over 30 yrs
- Wildfire 3/10 Moderate
- Heat 6/10 Major 7 d/yr ≥108°F today · 21 d/yr by 30 yrs out
- Wind 4/10 Moderate 22% chance of damaging wind over 30 yrs
- Air quality 2/10 Low 2 unhealthy d/yr today · 2 by 30 yrs out
Nearby sold comps map
Loading sold comps map…
Walkable amenities ~0.75 mi
Loading nearby amenities…
Taxation est. · year 1
- Rental income
- $16,459
- − Mortgage interest
- −$8,346
- − Property taxes
- −$3,248
- − Insurance
- −$745
- − Repairs & maintenance
- −$1,317
- − Management
- −$1,317
- − Depreciation
- −$4,335
- Taxable loss
- −$2,849
- Est. tax savings @ 24.0%
- +$684
- After-tax cash flow
- $317/yr
For passive investors: Depreciation is non-cash, so a rental often shows a tax loss while cash-flowing — sheltering income. Rental losses are passive: they offset passive income freely, and up to $25,000/yr can offset ordinary (W-2) income if you actively participate and your MAGI is under $100k (phasing out to $0 by $150k); unused losses carry forward. On sale, claimed depreciation is recaptured at up to 25%, and gains may owe capital-gains tax (a 1031 exchange can defer both). Figures are a year-1 estimate at your 24.0% rate — not tax advice; consult a CPA.
Schools (NCES district)
- District
- Denison ISD
- NCES district ID
- 4816710
- Math proficiency
- 43% ▼ -7.00%
- Reading proficiency
- 44% ▼ -3.00%
- Median HH income
- $41,650
- Composite
- 36.6/100
- National rank
- #4629
- State rank
- #315 of 826 in TX
Livability — Denison
- Score
- 73/100
- State rank
- #221
- US rank
- #5428
Category grades
Schools grade is shown separately in the Schools card above.
Census & demographics
- Census place
- Denison, TX
- County
- Grayson County · 108,053 people
- City population
- 34,008
- Metro
- Sherman-Denison, TX
- Population (ZIP)
- 24,835
- Household income
- $71,605
- Rent vs Own
- Severe rent burden
- 997.0
Population outlook (Grayson County) Hauer SSP2
- Today (2025)
- 134,540 people
- By 2030
- 138,653 · +3.1%
- By 2040
- 145,958 · +8.5%
- By 2050
- 151,218 · +12.4%
- By 2075
- 161,802 · +20.3%
- By 2100
- 159,036 · +18.2%
Race, ethnicity, and origin ACS 2023
- Neighborhood character
- Predominantly White (73%)
- Race & ethnicity
- White 73% Hispanic / Latino 13% Two or more races 9% Black 6%
- Hispanic origin (detail)
- Mexican 11%
- Common ancestry
- Slovak 5% Serbian 2% Portuguese 2%
- Foreign-born
- 4% · Canada
- Languages at home
- 93% English-only · Spanish 6%
Political lean MEDSL · Grayson
- 2024 margin
- Solid R (+54.3) · D 22.5% · R 76.7%
- 2008→2024 swing
- -16.4pp toward R · 2008: -37.9pp · 2024: -54.3pp
- All cycles
- 2024: R+54.3 2020: R+49.9 2016: R+53.1 2012: R+48.0 2008: R+37.9
Not yet ingested
- Civics
- —
Market trends
- HPI YoY
- ▼ -295.96%
- Current HPI
- 257.1806
- Rent YoY
- ▬ 0.05%
- Metro
- Sherman-Denison, TX
- State GDP YoY
- ▲ 3.95%
- F500 in state
- 110
Industry mix (Fortune 500 HQ in TX)
| Industry | F500 HQs | Revenue |
|---|---|---|
| Energy | 16 | $1,198B |
|
||
| Technology | 5 | $198B |
|
||
| Engineering / Construction | 4 | $72B |
|
||
| Energy Services | 3 | $60B |
|
||
| Utilities | 3 | $41B |
|
||
| Healthcare | 2 | $330B |
|
||
Price history
+170.9% since first listed19 events — show timeline
- 2026-05-14 Pending — NTREIS
- 2026-05-10 Contingent — NTREIS
- 2026-04-21 Relisted — NTREIS
- 2026-04-20 Contingent — NTREIS
- 2026-04-07 Price Changed $149,000 NTREIS
- 2026-03-17 Listed $159,000 NTREIS
- 2023-12-15 Rental Removed $1,250 NTREIS
- 2023-12-06 Listed for Rent $1,250 NTREIS
- 2017-03-10 Sold (Public Records) — Public Records
- 2017-03-09 Sold (MLS) — NTREIS
- 2017-03-06 Pending — NTREIS
- 2016-11-06 Relisted — NTREIS
- 2016-10-27 Contingent — NTREIS
- 2016-10-01 Listed $45,000 NTREIS
- 2016-09-21 Listing Removed — NTREIS
- 2016-08-17 Price Changed $45,000 NTREIS
- 2016-04-24 Price Changed $50,000 NTREIS
- 2016-01-23 Listed $55,000 NTREIS
- 1995-07-28 Sold (Public Records) — Public Records
Property tax history
+6.8%/yrLatest (2025): $3,248 · +2.8% YoY. Source: county tax records.
Cash-flow waterfall
monthlySold comps — $/sqft
last 12 mo · ≤1 miLoading sold comps…