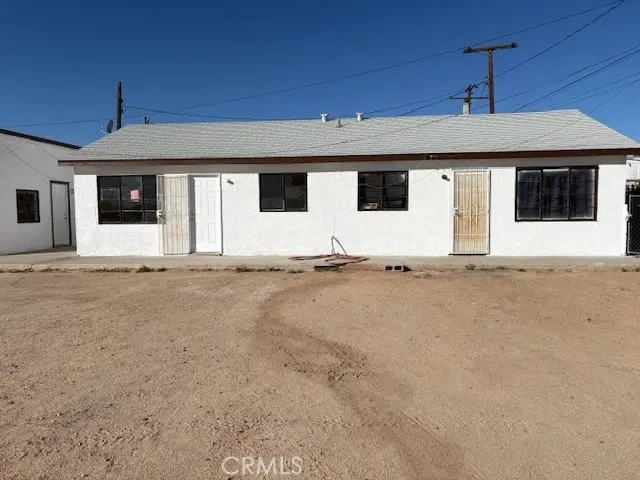
 Triplex
451 W Yermo · Yermo, CA
Flood risk 1/10 · Minimal
- FEMA flood zone
- X (unshaded)
- Chance of flooding over 30 yrs
- 0.0%
- Est. flood insurance / yr
- $507 – $1,088
Fire risk 3/10 · Minor
- Est. fire insurance / yr
- $659 – $1,223
Heat risk 8/10 · Major
- Hot days now (above 106°F)
- 6 days/yr
- Hot days in 30 yrs
- 16 days/yr
Wind risk 1/10 · Minimal
- Chance of severe wind over 30 yrs
- —
Air-quality risk 6/10 · Moderate
- Unhealthy air days now
- 10 days/yr
- Unhealthy air days in 30 yrs
- 14 days/yr
Risk factors via First Street. Map © Google.
Why this score? — see what drove the B- grade
The composite is a weighted blend of 9 inputs, each scored 0–100. Each bar is that input's sub-score; the figure is the points it added to the 100-point composite (weight × sub-score).
- Cash flow +29.0/30.0
- DSCR +10.0/10.0
- ARV discount +7.5/15.0
- 1% rule +7.3/10.0
- Appreciation +5.1/10.0
- Schools +2.7/10.0
- Rent growth +2.5/5.0
- Livability +2.5/5.0
- Condition / age +2.5/5.0
$230,000
🖨 Deal sheet 📄 Offer letter ✓ Due diligence
Multi-family units
County records classify this as Multi-Family (2-4 Unit). Listing-text estimate: 3 units. confirmed
Listing remarks MLS
$20K Price Reduction! Investor opportunity in Yermo! This triplex at 451 W Yermo Rd features three 1-bedroom, 1-bath units and offers strong potential for rental income or a value-add investment. Built in 1950 and situated on an approximately 2,375 sq ft lot, the property provides convenient on-site parking and a practical layout. Located just minutes from I-15, with easy access to Barstow and the High Desert corridor, and near local landmarks such as EddieWorld. Ideal for investors seeking a small multifamily asset with upside potential.
Key facts
- Near local landmarks
- Practical layout
- On-site parking
Tags
Neighborhood map
What this means for you Summary
Snapshot
- This is a 3 × 1-bed/1-bath units multifamily listed at $230k.
Deal economics
- At list price, monthly cash flow is $787 ($9k/yr) — positive. Per door: $262/mo.
- The deal already cash-flows at list — no discount required.
- Meets the 1% rule at list price ($3k rent vs $230k).
- Recommended offer: $209k (9.0% below list) — sets the bar for market timing.
Location & tenants
- Location reads: area grade B — affects rentability + tenant quality, not the cash-flow math above.
- Silver Valley Unified (town): math 23% / reading 39% proficiency, ranked #323 of 517 in CA (top 62%) — families likely to look elsewhere, expect single-tenant / working-renter base with shorter leases.
- Market conditions: 31 active listings in the ZIP; 5,458 units permitted in San Bernardino County in 2024 (1,500 in 5+ unit buildings).
Forward outlook
- In year one you build about $2k of equity ($2k loan paydown + $577 appreciation (0.2% local appreciation)).
- San Bernardino County population projected at +15% by 2050 — modest demand growth; plan on rents tracking national, not racing it.
- At projected returns (0.2% appreciation + 3.0% rent growth), your $64k cash investment doubles in ~5 years — after that, you're playing with house money.
Negotiation context
- It's been on market 99 days — a 9% lower offer ($209k) is reasonable based on typical stale-listing flexibility.
- 6 sale attempts since 8y ago; this cycle's ask has dropped $20k (8%) from the opening price — seller is motivated, your offer sets the floor, not the list.
- Current owner paid $145k; list at $230k implies a 59% gain — meaningful room to come down on a strong offer.
Risks & watch-outs
- Watch-outs: built in 1950 — expect roof / HVAC / electrical / plumbing capex.
- Climate carrying-cost: extreme-heat days projected 6→16/yr by 2055 (HVAC capex compounding) — expect insurance premiums to compound above CPI over the hold.
Questions for the listing agent
- It's been on market 99 days. Have you received any prior offers? Is the seller open to a 9% concession, seller financing, or rate buy-down credit?
- Can we see the unit-by-unit rent roll, current vacancy, and any below-market leases? What's the average tenancy length?
- What capital expenditures (roof, boiler, parking lot, exteriors) have been made in the last 5 years, and what's planned in the next 2?
- Built in 1950 — when were the roof, HVAC, electrical panel, plumbing, and water heater last replaced?
- Why hasn't it sold? Are there any deal-killer items the seller is aware of (foundation, flood, title, zoning, code violations)?
- Is there a deadline driving the sale (1031 exchange, divorce, estate, relocation)? That informs how much negotiation room exists.
- What's the average days-on-market for RENTAL listings here right now (not sales)? A rising rental-DOM trend means longer vacancies and softer asking-rent achievability than the comps imply.
- What's the recent tenant-quality profile in this submarket — average credit score on applications, eviction rate, late-payment / NSF rate, and stable-employment percentage? A property-management company in the area should have these aggregated.
- How much new apartment / multifamily construction is in the pipeline within 1–3 miles? Heavy new supply (>2% of stock underway) typically softens rents 12–24 months out; light construction supports rent growth.
Investment metrics
- 1% rule
- 1.23% ✓
- Cap rate
- 10.40%
- Cash-on-cash
- 14.66%
- DSCR
- 1.65
- GRM
- 6.8
CMA / ARV
No comps found within radius.
Projected returns pro-forma
0.25% appreciation · 3.0% rent growth · sell at horizon
- IRR
- 14.7%
- Equity multiple
- 1.72×
- Total profit
- $46,051
- Equity at exit
- $69,685
- IRR
- 18.9%
- Equity multiple
- 3.14×
- Total profit
- $137,726
- Equity at exit
- $86,115
Cash invested: $64,400 (down + closing). Projections, not guarantees.
Landlord ↔ Tenant lean methodology
- Overall (STATE)
- 18 Strongly Tenant-Friendly
- State California
- 18 Strongly Tenant-Friendly · D+13
- County
- — inherits STATE
- City
- — inherits STATE
ZIP-level market 92398
- Home prices YoY
- 0.1%
- Active inventory
- 31
- Price-to-rent
- 20.3×
Monthly cashflow live
- Estimated rent
- $2,836 medium interval (Pro) →
- Mortgage (P&I)
- −$1,206
- Tax from tax record
- −$152 /mo · $1,823/yr
- Insurance
- −$96
- HOA
- −$0
- Vacancy / Maint / Mgmt
- −$596
- Net cashflow
- $787
Break-even live
3-unit breakdown (identical units grouped — click to expand)
| Units | Beds | Baths | Est. rent |
|---|---|---|---|
| 3× units | 1 | 1 | $2,835 |
| #1 | 1 | 1 | $945 |
| #2 | 1 | 1 | $945 |
| #3 | 1 | 1 | $945 |
| Total (3 units) | $2,836 | ||
UW: 25.0% down · 7.5% · 30yr · 1.5% tax · 5.0% vac · 8.0% maint · 8.0% mgmt
Financing live
Cash to close
- Down payment
- $57,500
- Closing costs
- $6,900
- Reserves months
- —
- Total cash needed
- —
Loan-product check · same deal, 3 products live
Conventional
25% down · 7.5% · 30yr
- Down + closing
- —
- Monthly P&I
- —
- Monthly cashflow
- —
- DSCR
- —
- Eligible?
- —
Personal DTI + credit; lowest rate.
DSCR
20% down · 8.5% · 30yr
- Down + closing
- —
- Monthly P&I
- —
- Monthly cashflow
- —
- DSCR
- —
- Eligible?
- —
No personal income docs; deal must DSCR.
Hard money
10% down · 12.0% · 12mo
- Down + closing
- —
- Monthly P&I
- —
- Monthly cashflow
- —
- DSCR
- —
- Eligible?
- —
Short-term bridge; refi at stabilization.
Listing history 31 events
-
2026-06-18days on market $230,000 Active 99 DOM
-
2026-06-17days on market $230,000 Active 98 DOM
-
2026-06-16days on market $230,000 Active 97 DOM
-
2026-06-15days on market $230,000 Active 96 DOM
-
2026-06-13days on market $230,000 Active 94 DOM
-
2026-06-13days on market $230,000 Active 93 DOM
-
2026-06-09days on market $230,000 Active 90 DOM
-
2026-06-08days on market $230,000 Active 89 DOM
-
2026-06-07days on market $230,000 Active 88 DOM
-
2026-06-04days on market $230,000 Active 85 DOM
-
2026-06-03days on market $230,000 Active 84 DOM
-
2026-06-02days on market $230,000 Active 83 DOM
-
2026-06-01days on market $230,000 Active 82 DOM
-
2026-05-31days on market $230,000 Active 81 DOM
-
2026-03-23price $230,000 544-char remark
Show marketing remark (544 chars)
$20K Price Reduction! Investor opportunity in Yermo! This triplex at 451 W Yermo Rd features three 1-bedroom, 1-bath units and offers strong potential for rental income or a value-add investment. Built in 1950 and situated on an approximately 2,375 sq ft lot, the property provides convenient on-site parking and a practical layout. Located just minutes from I-15, with easy access to Barstow and the High Desert corridor, and near local landmarks such as EddieWorld. Ideal for investors seeking a small multifamily asset with upside potential.
-
2026-03-11$250,000 Active 544-char remark
Show marketing remark (544 chars)
$20K Price Reduction! Investor opportunity in Yermo! This triplex at 451 W Yermo Rd features three 1-bedroom, 1-bath units and offers strong potential for rental income or a value-add investment. Built in 1950 and situated on an approximately 2,375 sq ft lot, the property provides convenient on-site parking and a practical layout. Located just minutes from I-15, with easy access to Barstow and the High Desert corridor, and near local landmarks such as EddieWorld. Ideal for investors seeking a small multifamily asset with upside potential.
-
2019-11-27soldstatus $145,000 Closed Sale 347-char remark
Show marketing remark (347 chars)
Calling all investors! Triplex located in Yermo close to the famous Eddie's World! Each unit offers one bedroom, one bathroom, living and dining area, tons of parking and just minutes away from the 15 freeway. This is perfect for someone looking for extra income or living onsite and renting the other units out! Seller is entertaining all offers!
-
2019-11-27soldstatus $145,000
Show marketing remark (347 chars)
Calling all investors! Triplex located in Yermo close to the famous Eddie's World! Each unit offers one bedroom, one bathroom, living and dining area, tons of parking and just minutes away from the 15 freeway. This is perfect for someone looking for extra income or living onsite and renting the other units out! Seller is entertaining all offers!
-
2019-07-29$149,500 Active 347-char remark
Show marketing remark (347 chars)
Calling all investors! Triplex located in Yermo close to the famous Eddie's World! Each unit offers one bedroom, one bathroom, living and dining area, tons of parking and just minutes away from the 15 freeway. This is perfect for someone looking for extra income or living onsite and renting the other units out! Seller is entertaining all offers!
-
2019-07-29$149,500
Show marketing remark (347 chars)
Calling all investors! Triplex located in Yermo close to the famous Eddie's World! Each unit offers one bedroom, one bathroom, living and dining area, tons of parking and just minutes away from the 15 freeway. This is perfect for someone looking for extra income or living onsite and renting the other units out! Seller is entertaining all offers!
-
2019-07-21historical
-
2019-01-21$149,900
-
2018-09-05historical
-
2018-09-05historical
-
2018-05-05$139,500 Active
-
2018-02-05$139,500
-
2017-06-15soldstatus $93,000
-
2017-02-24soldstatus $45,000
-
1994-03-22soldstatus $40,000
-
1991-05-13soldstatus $47,000
ⓘ Source: listings_history table (triggers on properties + properties_extension) + one-shot
backfill from property_details.listing_events for pre-trigger history.
Tax reassessment forecast CA · Resets to sale price
- Current annual tax
- $1,823 · $152/mo
- Projected year-2 tax
- $1,823 · $152/mo
- Expected delta
- $0/yr ($0/mo · 0.0%)
ⓘ Screening estimate from a state-policy table — verify with the county assessor before closing.
Climate risk First Street
- Flood 1/10 Low FEMA zone X (unshaded) · 0% chance over 30 yrs
- Wildfire 3/10 Moderate
- Heat 8/10 Severe 6 d/yr ≥106°F today · 16 d/yr by 30 yrs out
- Wind 1/10 Low
- Air quality 6/10 Major 10 unhealthy d/yr today · 14 by 30 yrs out
Nearby sold comps map
Loading sold comps map…
Walkable amenities ~0.75 mi
Loading nearby amenities…
Taxation est. · year 1
- Rental income
- $34,032
- − Mortgage interest
- −$12,884
- − Property taxes
- −$1,823
- − Insurance
- −$1,150
- − Repairs & maintenance
- −$2,723
- − Management
- −$2,723
- − Depreciation
- −$6,691
- Taxable income
- $6,039
- Est. tax owed @ 24.0%
- −$1,449
- After-tax cash flow
- $7,989/yr
For passive investors: Depreciation is non-cash, so a rental often shows a tax loss while cash-flowing — sheltering income. Rental losses are passive: they offset passive income freely, and up to $25,000/yr can offset ordinary (W-2) income if you actively participate and your MAGI is under $100k (phasing out to $0 by $150k); unused losses carry forward. On sale, claimed depreciation is recaptured at up to 25%, and gains may owe capital-gains tax (a 1031 exchange can defer both). Figures are a year-1 estimate at your 24.0% rate — not tax advice; consult a CPA.
Schools (NCES district)
- District
- Silver Valley Unified
- NCES district ID
- 0636820
- Math proficiency
- 23% ▼ -12.00%
- Reading proficiency
- 39% ▼ -12.00%
- Median HH income
- $48,754
- Composite
- 26.85/100
- National rank
- #7105
- State rank
- #323 of 517 in CA
Livability — Yermo
No livability data for this city. (Only ~50 U.S. cities are tracked.)
Census & demographics
- Census place
- Yermo, CA
- Population (ZIP)
- 1,657
Population outlook (San Bernardino County) Hauer SSP2
- Today (2025)
- 2,300,329 people
- By 2030
- 2,378,907 · +3.4%
- By 2040
- 2,523,137 · +9.7%
- By 2050
- 2,642,388 · +14.9%
- By 2075
- 2,880,769 · +25.2%
- By 2100
- 2,909,436 · +26.5%
Race, ethnicity, and origin ACS 2023
- Neighborhood character
- Predominantly White (69%)
- Race & ethnicity
- White 69% Hispanic / Latino 22% Two or more races 17% Asian 8%
- Hispanic origin (detail)
- Mexican 22%
- Common ancestry
- German 3% Italian 2% Iranian 1%
- Foreign-born
- 19% · Canada
- Languages at home
- 75% English-only · Arabic 12% Spanish 11% Tagalog/Filipino 1%
Political lean MEDSL · San Bernardino
- 2024 margin
- Toss-up / Even · D 47.5% · R 49.7% · Other 2.8%
- 2008→2024 swing
- -8.5pp toward R · 2008: 6.3pp · 2024: -2.1pp
- All cycles
- 2024: R+2.1 2020: D+10.7 2016: D+9.8 2012: D+5.4 2008: D+6.3
Not yet ingested
- Civics
- —
Market trends
- HPI YoY
- ▲ 0.25%
- Current HPI
- 306.9731
- Rent YoY
- —
- Metro
- —
- State GDP YoY
- ▲ 3.21%
- F500 in state
- 116
Industry mix (Fortune 500 HQ in CA)
| Industry | F500 HQs | Revenue |
|---|---|---|
| Technology | 27 | $1,492B |
|
||
| Financial Services | 3 | $174B |
|
||
| Retail | 3 | $44B |
|
||
| Insurance | 3 | $26B |
|
||
| Media / Entertainment | 2 | $115B |
|
||
| Pharmaceuticals / Biotech | 2 | $62B |
|
||
Price history
+389.4% since first listed17 events — show timeline
- 2026-03-23 Price Changed $230,000 CRMLS
- 2026-03-11 Listed $250,000 CRMLS
- 2019-11-27 Sold (Public Records) $145,000 Public Records
- 2019-11-27 Sold (MLS) $145,000 CRMLS
- 2019-11-27 Sold (MLS) $145,000 CRMLS
- 2019-07-29 Listed $149,500 CRMLS
- 2019-07-29 Listed $149,500 CRMLS
- 2019-07-21 Listing Removed — CRMLS
- 2019-01-21 Listed $149,900 CRMLS
- 2018-09-05 Listing Removed — CRMLS
- 2018-09-05 Listing Removed — CRMLS
- 2018-05-05 Listed $139,500 CRMLS
- 2018-02-05 Listed $139,500 CRMLS
- 2017-06-15 Sold (Public Records) $93,000 Public Records
- 2017-02-24 Sold (Public Records) $45,000 Public Records
- 1994-03-22 Sold (Public Records) $40,000 Public Records
- 1991-05-13 Sold (Public Records) $47,000 Public Records
Property tax history
+5.3%/yrLatest (2025): $1,823 · +1.7% YoY. Source: county tax records.
Cash-flow waterfall
monthlySold comps — $/sqft
last 12 mo · ≤1 miLoading sold comps…