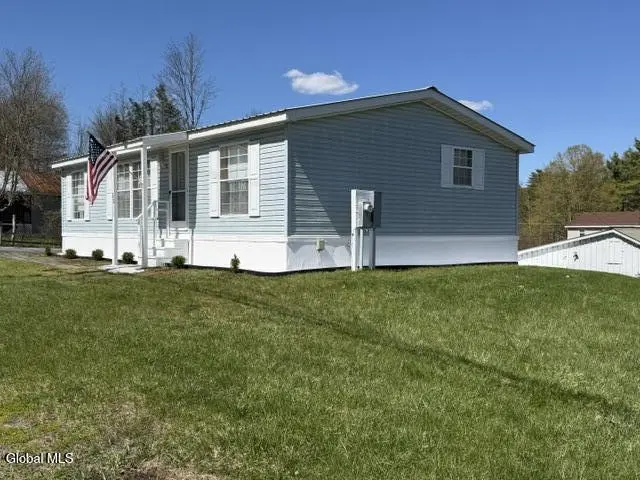
52 2nd Ave · Hadley, NY
Flood risk 1/10 · Minimal
- FEMA flood zone
- X
- Chance of flooding over 30 yrs
- 0.0%
- Est. flood insurance / yr
- $507 – $1,088
Fire risk 3/10 · Minor
- Est. fire insurance / yr
- $691 – $1,283
Heat risk 2/10 · Minimal
- Hot days now (above 92°F)
- 7 days/yr
- Hot days in 30 yrs
- 17 days/yr
Wind risk 2/10 · Minimal
- Chance of severe wind over 30 yrs
- 3.0%
Air-quality risk 1/10 · Minimal
- Unhealthy air days now
- 0 days/yr
- Unhealthy air days in 30 yrs
- 0 days/yr
Risk factors via First Street. Map © Google.
Why this score? — see what drove the C grade
The composite is a weighted blend of 9 inputs, each scored 0–100. Each bar is that input's sub-score; the figure is the points it added to the 100-point composite (weight × sub-score).
- ARV discount +15.0/15.0
- Cash flow +12.9/30.0
- Appreciation +10.0/10.0
- Schools +4.2/10.0
- DSCR +3.9/10.0
- Livability +3.0/5.0
- Rent growth +2.5/5.0
- Condition / age +2.5/5.0
- 1% rule +2.4/10.0
$157,500
🖨 Deal sheet (PDF) 📄 Offer letter ✓ Due diligence
Listing remarks
Opportunity awaits as this affordable cozy Hadley 3-bedroom 2 bath ranch style home hits the market! This home features a large sun filled living room with vaulted ceiling and large windows, large kitchen, 1st floor laundry room, large primary bedroom with primary bath and walk in closet! Lot features large storage shed and back deck! Great location makes for a must see!
Key facts
- 0.24 acre lot
- 4 parking spots
- Built 1991
Property features AI
Exterior
- Parking: Driveway parking for 4 vehicles
- Utilities: Public water; Septic tank sewer
- Home design: Single-family residence; Updated/remodeled; Level, landscaped lot (approximately 0.24 acre)
- Construction: Vinyl siding; Metal and asphalt roof
- Exterior features: Deck; Paved driveway; Exterior lighting; Shed(s)
Interior
- Kitchen: Range; Refrigerator
- Bedrooms: Primary bedroom on the first floor; Two additional bedrooms on the first floor
- Flooring: Carpet
- Bathrooms: Two full bathrooms on the first floor; Primary bathroom on the first floor; Full bathroom on the first floor
- Heating & cooling: Forced air heating; Oil heating
- Interior features: Paddle fan; Vaulted ceilings; Walk-in closets; Chair rail; 8 total rooms
- Laundry & utility: Main-level laundry room; Washer/Dryer (included)
Neighborhood map
What this means for you Summary
Snapshot
- This is a 3-bed/2.0-bath single-family listed at $158k.
Deal economics
- At list price, monthly cash flow is $-10 ($-123/yr) — negative.
- To cash-flow at today's rent, offer at most $156k (1.2% below list).
- To meet the 1% rule (rent ≥ 1% of price), the offer needs to be $116k (26.2% below list).
- Recommended offer: $116k (26.2% below list) — sets the bar for 1% rule.
Location & tenants
- Location reads 60/100 on livability (#974 in NY) — a middle-class / working-renter tenant base. Strengths: housing A+, crime A, cost of living B; Watch: amenities F, commute F, health & safety D-.
- Hadley-Luzerne Central School District (rural): math 41% / reading 57% proficiency, ranked #396 of 590 in NY (top 67%) — families likely to look elsewhere, expect single-tenant / working-renter base with shorter leases.
- Zoned schools: Stuart M Townsend Elementary School (math 27% / reading 47%, grade F, #1,519 of 2,108 statewide, top 74%, 340 students, 52% FRL); Hadley-Luzerne Junior-Senior High School (math 62% / reading 67%, grade B-, #776 of 1,100 statewide, top 73%, 304 students, 54% FRL).
- Market conditions: 45 active listings in the ZIP; 1,132 units permitted in Saratoga County in 2024 (378 in 5+ unit buildings).
Forward outlook
- In year one you build about $17k of equity ($1k loan paydown + $16k appreciation (10.0% local appreciation)).
- Saratoga County population projected at +4% by 2050 — modest demand growth; plan on rents tracking national, not racing it.
- At projected returns (10.0% appreciation + 3.0% rent growth), your $44k cash investment doubles in ~3 years — after that, you're playing with house money.
- By year 3, paydown + projected appreciation supports a ~$43k cash-out refi (75% LTV) — recoverable capital for the next deal without selling this one.
Negotiation context
- It's been on market 27 days — a 2% lower offer ($155k) is reasonable based on typical stale-listing flexibility.
Questions for the listing agent
- What do current leases actually rent for vs. the listed asking? Can we see a recent rent roll and the last 12 months of T-12 income?
- Is there a deadline driving the sale (1031 exchange, divorce, estate, relocation)? That informs how much negotiation room exists.
- Schools are F-rated, which usually means shorter tenancies and higher turnover. Who's the typical renter profile here, and what's been the actual vacancy rate?
- What's the average days-on-market for RENTAL listings here right now (not sales)? A rising rental-DOM trend means longer vacancies and softer asking-rent achievability than the comps imply.
- What's the recent tenant-quality profile in this submarket — average credit score on applications, eviction rate, late-payment / NSF rate, and stable-employment percentage? A property-management company in the area should have these aggregated.
- How much new for-sale + rental construction is in the pipeline within 1–3 miles? Heavy new supply typically softens prices + rents 12–24 months out; constrained supply supports both.
Investment metrics
- 1% rule
- 0.74% ✗
- Cap rate
- 6.21%
- Cash-on-cash
- -0.28%
- DSCR
- 0.99
- GRM
- 11.3
CMA / ARV
- ARV (on-the-fly)
- $194,880
- Comps found
- 3
Show comp detail 3 sales within ~0.75 mi
| Address | Dist | Beds/Ba | Sqft | Sold | Price | $/sf | Match |
|---|---|---|---|---|---|---|---|
| 26 3rd Ave | 0.23mi | 2/1.0 (-1) | 924 (-4%) | 11mo | $188,000 | $203 | 65 |
| 81 1st Ave | 0.12mi | 2/1.0 (-1) | 861 (-10%) | 23mo | $44,560 | $52 | 49 |
| 51 Rollman Cir | 0.69mi | 3/2.0 | 1,100 (+15%) | 10mo | $325,000 | $295 | 36 |
Match score weights: distance 35% · size 25% · config 20% · recency 20%. Top-matched comps best support the ARV.
Projected returns pro-forma
10.0% appreciation · 3.0% rent growth · sell at horizon
- IRR
- 24.1%
- Equity multiple
- 2.93×
- Total profit
- $85,045
- Equity at exit
- $141,888
- IRR
- 21.3%
- Equity multiple
- 6.69×
- Total profit
- $250,796
- Equity at exit
- $305,988
Cash invested: $44,100 (down + closing). Projections, not guarantees.
Landlord ↔ Tenant lean methodology
- Overall (STATE)
- 15 Strongly Tenant-Friendly
- State New York
- 15 Strongly Tenant-Friendly · D+10
- County
- — inherits STATE
- City
- — inherits STATE
ZIP-level market 12835
- Home prices YoY
- 20.0%
- Active inventory
- 45
- Price-to-rent
- 11.3×
Monthly cashflow live
- Estimated rent
- $1,163 medium interval (Pro) →
- Mortgage (P&I)
- −$826
- Tax from tax record
- −$37 /mo · $445/yr
- Insurance
- −$66
- HOA
- −$0
- Vacancy / Maint / Mgmt
- −$244
- Net cashflow
- $-10
Break-even live
Sensitivity live
| Price | -10% $79 | -5% $34 | +0% $-10 | +5% $-55 | +10% $-99 |
|---|---|---|---|---|---|
| Rent | -10% $-102 | -5% $-56 | +0% $-10 | +5% $36 | +10% $82 |
| Rate | -1.0pp $69 | -0.5pp $30 | base $-10 | +0.5pp $-51 | +1.0pp $-93 |
UW: 25.0% down · 7.5% · 30yr · 1.5% tax · 5.0% vac · 8.0% maint · 8.0% mgmt
Financing live
Cash to close
- Down payment
- $39,375
- Closing costs
- $4,725
- Reserves months
- —
- Total cash needed
- —
Loan-product check · same deal, 3 products live
Conventional
25% down · 7.5% · 30yr
- Down + closing
- —
- Monthly P&I
- —
- Monthly cashflow
- —
- DSCR
- —
- Eligible?
- —
Personal DTI + credit; lowest rate.
DSCR
20% down · 8.5% · 30yr
- Down + closing
- —
- Monthly P&I
- —
- Monthly cashflow
- —
- DSCR
- —
- Eligible?
- —
No personal income docs; deal must DSCR.
Hard money
10% down · 12.0% · 12mo
- Down + closing
- —
- Monthly P&I
- —
- Monthly cashflow
- —
- DSCR
- —
- Eligible?
- —
Short-term bridge; refi at stabilization.
Listing history 1 events
-
2026-05-01$157,500 Active 373-char remark
ⓘ Source: listings_history table (triggers on properties + properties_extension) + one-shot
backfill from property_details.listing_events for pre-trigger history.
Tax reassessment forecast NY · Partial reset (capped growth)
- Current annual tax
- $445 · $37/mo
- Projected year-2 tax
- $1,553 · $129/mo
- Expected delta
- +$1,108/yr (+$92/mo · 249.1%)
ⓘ Screening estimate from a state-policy table — verify with the county assessor before closing.
Climate risk First Street
- Flood 1/10 Low FEMA zone X · 0% chance over 30 yrs
- Wildfire 3/10 Moderate
- Heat 2/10 Low 7 d/yr ≥92°F today · 17 d/yr by 30 yrs out
- Wind 2/10 Low 3% chance of damaging wind over 30 yrs
- Air quality 1/10 Low 0 unhealthy d/yr today · 0 by 30 yrs out
Nearby sold comps map
Loading sold comps map…
Walkable amenities ~0.75 mi
Loading nearby amenities…
Taxation est. · year 1
- Rental income
- $13,950
- − Mortgage interest
- −$8,822
- − Property taxes
- −$445
- − Insurance
- −$788
- − Repairs & maintenance
- −$1,116
- − Management
- −$1,116
- − Depreciation
- −$4,582
- Taxable loss
- −$2,918
- Est. tax savings @ 24.0%
- +$700
- After-tax cash flow
- $577/yr
For passive investors: Depreciation is non-cash, so a rental often shows a tax loss while cash-flowing — sheltering income. Rental losses are passive: they offset passive income freely, and up to $25,000/yr can offset ordinary (W-2) income if you actively participate and your MAGI is under $100k (phasing out to $0 by $150k); unused losses carry forward. On sale, claimed depreciation is recaptured at up to 25%, and gains may owe capital-gains tax (a 1031 exchange can defer both). Figures are a year-1 estimate at your 24.0% rate — not tax advice; consult a CPA.
Schools (NCES district)
- District
- Hadley-Luzerne Central School District
- NCES district ID
- 3613110
- Math proficiency
- 41% ▼ -15.00%
- Reading proficiency
- 57% ▲ 2.00%
- Median HH income
- $52,974
- Composite
- 42.18/100
- National rank
- #3292
- State rank
- #396 of 590 in NY
Livability — Hadley
- Score
- 60/100
- State rank
- #974
- US rank
- #19019
Category grades
Schools grade is shown separately in the Schools card above.
Census & demographics
- Census place
- Hadley, NY
- Population (ZIP)
- 2,700
Population outlook (Saratoga County) Hauer SSP2
- Today (2025)
- 238,889 people
- By 2030
- 243,681 · +2.0%
- By 2040
- 249,118 · +4.3%
- By 2050
- 248,638 · +4.1%
- By 2075
- 241,675 · +1.2%
- By 2100
- 213,150 · -10.8%
Race, ethnicity, and origin ACS 2023
- Neighborhood character
- Predominantly White (94%)
- Race & ethnicity
- White 94% Two or more races 4% Hispanic / Latino 1%
- Common ancestry
- Romanian 9% Lithuanian 5% Iranian 3%
- Foreign-born
- 5% · Canada
- Languages at home
- 96% English-only · Other Indo-European 1% Russian/Polish/Slavic 1%
Political lean MEDSL · Saratoga
- 2024 margin
- Toss-up / Even · D 50.9% · R 49.1%
- 2008→2024 swing
- -1.6pp toward R · 2008: 3.4pp · 2024: 1.8pp
- All cycles
- 2024: D+1.8 2020: D+5.4 2016: R+4.4 2012: D+2.1 2008: D+3.4
Not yet ingested
- Civics
- —
Market trends
- HPI YoY
- ▲ 54.89%
- Current HPI
- 328.7243
- Rent YoY
- —
- Metro
- —
- State GDP YoY
- ▲ 2.60%
- F500 in state
- 92
Industry mix (Fortune 500 HQ in NY)
| Industry | F500 HQs | Revenue |
|---|---|---|
| Financial Services | 10 | $950B |
|
||
| Consumer Goods | 9 | $162B |
|
||
| Insurance | 4 | $225B |
|
||
| Telecommunications | 2 | $144B |
|
||
| Pharmaceuticals | 2 | $112B |
|
||
| Media / Entertainment | 2 | $69B |
|
||
Price history
2 events — show timeline
- 2026-05-28 Pending — Global MLS
- 2026-05-01 Listed $157,500 Global MLS
Property tax history
-7.0%/yrLatest (2017): $445 · +1.0% YoY. Source: county tax records.
Cash-flow waterfall
monthlySold comps — $/sqft
last 12 mo · ≤1 miLoading sold comps…