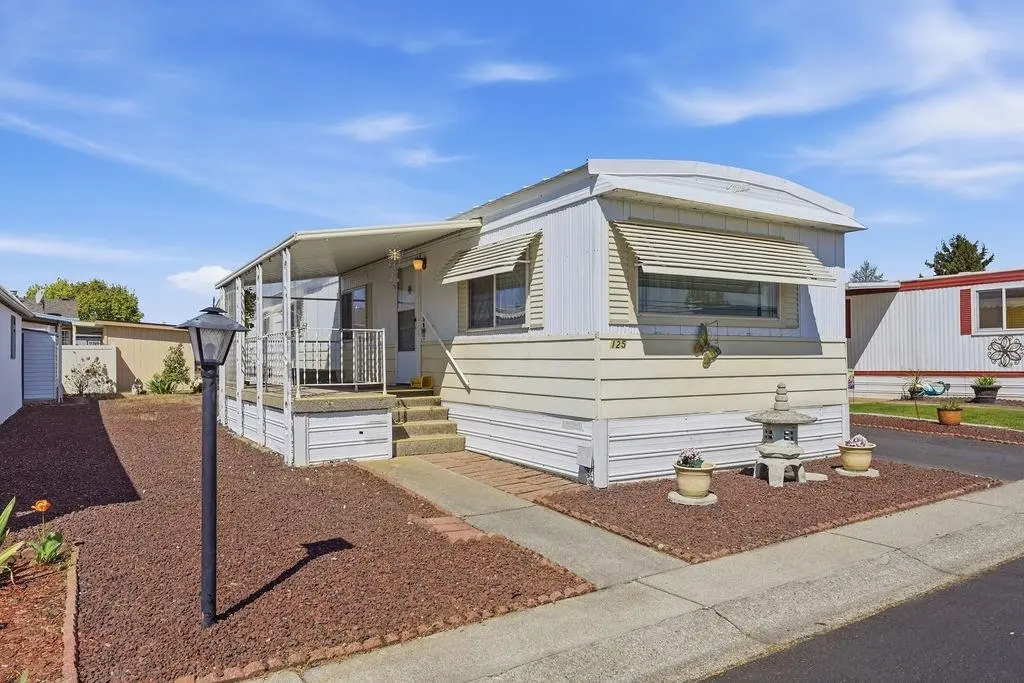
1211 E Lyons Ave #125 · Spokane, WA
Flood risk 1/10 · Minimal
- FEMA flood zone
- X (unshaded)
- Chance of flooding over 30 yrs
- 0.0%
- Est. flood insurance / yr
- $507 – $1,088
Fire risk 1/10 · Minimal
- Est. fire insurance / yr
- $604 – $1,122
Heat risk 3/10 · Minor
- Hot days now (above 94°F)
- 6 days/yr
- Hot days in 30 yrs
- 12 days/yr
Wind risk 1/10 · Minimal
- Chance of severe wind over 30 yrs
- —
Air-quality risk 10/10 · Severe
- Unhealthy air days now
- 19 days/yr
- Unhealthy air days in 30 yrs
- 21 days/yr
Risk factors via First Street. Map © Google.
Why this score? — see what drove the B- grade
The composite is a weighted blend of 9 inputs, each scored 0–100. Each bar is that input's sub-score; the figure is the points it added to the 100-point composite (weight × sub-score).
- Cash flow +30.0/30.0
- 1% rule +10.0/10.0
- DSCR +10.0/10.0
- Schools +4.6/10.0
- Livability +4.0/5.0
- Rent growth +3.3/5.0
- Condition / age +2.5/5.0
- ARV discount +1.6/15.0
- Appreciation +0.0/10.0
$69,900
🖨 Deal sheet (PDF) 📄 Offer letter ✓ Due diligence
Listing remarks MLS
Well maintained 2 bedroom, 2 bathroom in Contempo mobile home park.
Key facts
- Attached half bath
- Walk-in tub
- Eat-up bar
Tags
Property features AI
Finance
- Other: Living area recorded as 980; Listed by Amplify Real Estate Services
- Financial info: Land lease: $750
- HOA & community: Senior community (Contempo park)
Exterior
- Parking: Attached carport; 2 carport spaces
- Utilities: Public water and sewer (per public records)
- Home design: Manufactured home (Marlette); Skirted foundation
- Construction: Steel frame construction; Metal roof; Manufactured house structure
- Exterior features: Deck; Level lot; Private, paved road frontage; Community pool
Interior
- Kitchen: Free-standing range; Dishwasher; Refrigerator
- Bedrooms: 2 bedrooms
- Heating & cooling: Natural gas forced air heating; Central air conditioning
- Interior features: Hot water; Utility room; Roll-in shower; Grab bars throughout
- Laundry & utility: Washer; Dryer
Neighborhood map
What this means for you Summary
Snapshot
- This is a 2-bed/1.0-bath manufactured listed at $70k.
Deal economics
- At list price, monthly cash flow is $568 ($7k/yr) — positive.
- The deal already cash-flows at list — no discount required.
- Meets the 1% rule at list price ($1k rent vs $70k).
- Recommended offer: $69k (1.5% below list) — sets the bar for market timing.
- Cap rate 16.1% vs local median 3.2% in Spokane — top-decile yield for the area; either an underpriced asset or a hidden risk that comps aren't pricing in. Stress-test before assuming the spread holds.
Location & tenants
- Location reads 80/100 on livability (#93 in WA, #1,822 nationally) — a professional / high-income tenant draw. Strengths: amenities A+, commute A+, housing A+; Watch: crime F.
- Spokane School District (urban): math 47% / reading 58% proficiency, ranked #136 of 291 in WA (top 47%) — acceptable for families but not a draw, mixed tenant base, ~2y average lease.
- Zoned schools: Arlington Elementary (399 students, 84% FRL); Rogers High School (1,536 students, 83% FRL) — zoned schools average 84% FRL vs 50% district-wide (34 pts higher); higher-poverty schools than district average — tighter screening recommended.
- Market conditions: Rents rising (+3.2%/yr); 236 active listings in the ZIP; 40 comparable units currently listed for rent nearby; rentals at typical pace (median 24d on market — plan ~3-4 weeks tenant-placement turnaround); 3,608 units permitted in Spokane County in 2024 (1,792 in 5+ unit buildings).
Forward outlook
- Local home prices are declining (-3.0%/yr); year-one equity from $483 of loan paydown is wiped out by about $2k of value loss. Plan a longer hold.
- Spokane County population projected at +13% by 2050 — modest demand growth; plan on rents tracking national, not racing it.
- At projected returns (-3.0% appreciation + 3.2% rent growth), your $20k cash investment doubles in ~4 years — after that, you're playing with house money.
Negotiation context
- It's been on market 22 days — a 2% lower offer ($69k) is reasonable based on typical stale-listing flexibility.
- 2 sale attempts since 20y ago with the ask held roughly flat each time — persistent listings suggest the price (not the market) is what's stuck; bring a comps-based counter.
- Current owner paid $22k; list at $70k implies a 218% gain — meaningful room to come down on a strong offer.
Questions for the listing agent
- Built in 1976 — when were the roof, HVAC, electrical panel, plumbing, and water heater last replaced?
- Is there a deadline driving the sale (1031 exchange, divorce, estate, relocation)? That informs how much negotiation room exists.
- Schools are B-rated — typically a magnet for longer-tenancy family renters. What's the average tenant stay here, and is there a school-zone premium baked into asking?
- Crime grade is F in this area — have there been break-ins, vandalism, or insurance claims at this property in the last 3 years? What carrier currently insures it and at what premium?
- What's the average days-on-market for RENTAL listings here right now (not sales)? A rising rental-DOM trend means longer vacancies and softer asking-rent achievability than the comps imply.
- What's the recent tenant-quality profile in this submarket — average credit score on applications, eviction rate, late-payment / NSF rate, and stable-employment percentage? A property-management company in the area should have these aggregated.
- How much new for-sale + rental construction is in the pipeline within 1–3 miles? Heavy new supply typically softens prices + rents 12–24 months out; constrained supply supports both.
Investment metrics
- 1% rule
- 1.80% ✓
- Cap rate
- 16.05%
- Cash-on-cash
- 34.85%
- DSCR
- 2.55
- GRM
- 4.6
CMA / ARV
- ARV (on-the-fly)
- $61,740
- Comps found
- 12
Show comp detail 12 sales within ~0.75 mi
| Address | Dist | Beds/Ba | Sqft | Sold | Price | $/sf | Match |
|---|---|---|---|---|---|---|---|
| 1211 E Lyons Ave #104 | 0.00mi | 2/1.0 | 980 (0%) | 8mo | $78,000 | $80 | 94 |
| 1211 E Lyons Ave #67 | 0.00mi | 2/1.0 | 944 (-4%) | 2mo | $59,000 | $63 | 92 |
| 1205 E Lyons Ave #137 | 0.15mi | 2/1.0 | 980 (0%) | 8mo | $92,000 | $94 | 86 |
| 6417 N Cincinnati St #34 | 0.39mi | 2/1.0 | 980 (0%) | 4mo | $69,500 | $71 | 78 |
| 1209 E Lyons Ave #221 | 0.17mi | 3/2.0 (+1) | 980 (0%) | 7mo | $86,900 | $89 | 77 |
| 1211 E Lyons Ave #123 | 0.00mi | 2/1.0 | 840 (-14%) | 3mo | $50,000 | $60 | 74 |
| 1205 E Lyons Ave #18 | 0.17mi | 2/2.0 | 906 (-8%) | 2mo | $119,000 | $131 | 73 |
| 1205 E Lyons Ave #20 | 0.17mi | 2/1.0 | 840 (-14%) | 3mo | $30,000 | $36 | 66 |
| 1205 E Lyons Rd #162 | 0.17mi | 2/1.0 | 1,124 (+15%) | 3mo | $68,000 | $60 | 65 |
| 7303 N Crestline #44 St | 0.66mi | 2/2.0 | 980 (0%) | 6mo | $60,000 | $61 | 60 |
| 7303 N Crestline St #35 | 0.66mi | 2/2.0 | 1,064 (+9%) | 4mo | $56,170 | $53 | 48 |
| 7303 N Crestline St #49 | 0.66mi | 2/1.0 | 840 (-14%) | 3mo | $27,000 | $32 | 43 |
Match score weights: distance 35% · size 25% · config 20% · recency 20%. Top-matched comps best support the ARV.
Projected returns pro-forma
-3.0% appreciation · 3.25% rent growth · sell at horizon
- IRR
- 30.6%
- Equity multiple
- 2.29×
- Total profit
- $25,176
- Equity at exit
- $10,422
- IRR
- 38.0%
- Equity multiple
- 4.57×
- Total profit
- $69,784
- Equity at exit
- $6,044
Cash invested: $19,572 (down + closing). Projections, not guarantees.
Landlord ↔ Tenant lean methodology
- Overall (STATE)
- 28 Tenant-Leaning
- State Washington
- 28 Tenant-Leaning · D+8
- County
- — inherits STATE
- City
- — inherits STATE
ZIP-level market 99207
- Home prices YoY
- -21.3%
- Rents YoY
- 3.2%
- Active inventory
- 236
- Price-to-rent
- 4.6×
Monthly cashflow live
- Estimated rent
- $1,260 high interval (Pro) →
- Mortgage (P&I)
- −$367
- Tax from tax record
- −$31 /mo · $375/yr
- Insurance
- −$29
- HOA
- −$0
- Vacancy / Maint / Mgmt
- −$265
- Net cashflow
- $568
Break-even live
Sensitivity live
| Price | -10% $608 | -5% $588 | +0% $568 | +5% $549 | +10% $529 |
|---|---|---|---|---|---|
| Rent | -10% $469 | -5% $519 | +0% $568 | +5% $618 | +10% $668 |
| Rate | -1.0pp $604 | -0.5pp $586 | base $568 | +0.5pp $550 | +1.0pp $532 |
UW: 25.0% down · 7.5% · 30yr · 1.5% tax · 5.0% vac · 8.0% maint · 8.0% mgmt
Financing live
Cash to close
- Down payment
- $17,475
- Closing costs
- $2,097
- Reserves months
- —
- Total cash needed
- —
Loan-product check · same deal, 3 products live
Conventional
25% down · 7.5% · 30yr
- Down + closing
- —
- Monthly P&I
- —
- Monthly cashflow
- —
- DSCR
- —
- Eligible?
- —
Personal DTI + credit; lowest rate.
DSCR
20% down · 8.5% · 30yr
- Down + closing
- —
- Monthly P&I
- —
- Monthly cashflow
- —
- DSCR
- —
- Eligible?
- —
No personal income docs; deal must DSCR.
Hard money
10% down · 12.0% · 12mo
- Down + closing
- —
- Monthly P&I
- —
- Monthly cashflow
- —
- DSCR
- —
- Eligible?
- —
Short-term bridge; refi at stabilization.
Rent comps 40 comps
| Address | Beds | Baths | Sqft | Rent | $/sqft | DOM | Units | Dist |
|---|---|---|---|---|---|---|---|---|
| 901 E Holyoke Ave Spokane, WA | 1.0 | 1.0 | 588 | $1,075 | $1.83 | 24d | 3 | 0.26mi |
| 6980 N Nevada St Spokane, WA | 1.0–2.0 | 1.0 | 622 | $1,383 | $2.22 | 24d | 1 | 0.26mi |
| 910 E Holyoke Ave Spokane, WA | 1.0–2.0 | 1.0 | 755 | $1,425 | $1.89 | 14d | 4 | 0.28mi |
| 1015 E Cozza Dr Unit 14 Spokane, WA | 2.0 | 1.0 | 902 | $1,110 | $1.23 | 24d | 1 | 0.33mi |
| 1015 E Cozza Dr Unit 41 Spokane, WA | 1.0 | 1.0 | 660 | $1,065 | $1.61 | 24d | 1 | 0.33mi |
| 1015 E Cozza Dr Unit 65 Spokane, WA | 1.0 | 1.0 | 660 | $1,065 | $1.61 | 14d | 1 | 0.33mi |
| 1015 E Cozza Dr Unit 165 Spokane, WA | 1.0 | 1.0 | 660 | $1,010 | $1.53 | 14d | 1 | 0.38mi |
| 1015 E Cozza Dr Unit 160 Spokane, WA | 1.0 | 1.0 | 660 | $1,010 | $1.53 | 24d | 1 | 0.40mi |
| 617 E Houston Ave Unit HH340 Spokane, WA | 2.0 | 1.0 | 710 | $1,100 | $1.55 | 14d | 1 | 0.41mi |
| 1015 E Cozza Dr Unit 167 Spokane, WA | 1.0 | 1.0 | 660 | $1,050 | $1.59 | 24d | 1 | 0.41mi |
| 6603 N Standard St Unit 6605 Spokane, WA | 2.0 | 1.0 | 750 | $1,200 | $1.60 | 24d | 1 | 0.47mi |
| 1011 E Sharpsburg Ave Unit 574 Spokane, WA | 1.0 | 1.0 | 660 | $1,065 | $1.61 | 24d | 1 | 0.49mi |
| 1011 E Sharpsburg Ave Unit 494 Spokane, WA | 2.0 | 1.0 | 902 | $1,150 | $1.27 | 24d | 1 | 0.52mi |
| 6107 N Standard St Spokane, WA | 2.0 | 1.5 | 850 | $2,350 | $2.76 | 24d | 1 | 0.60mi |
| 7808 N Morton St Unit 631 Spokane, WA | 1.0 | 1.0 | 660 | $1,050 | $1.59 | 24d | 1 | 0.69mi |
| 1718 E Lincoln Rd Spokane, WA | 1.0–2.0 | 1.0–2.0 | 975 | $1,795 | $1.84 | 14d | 10 | 0.71mi |
| 6203 N Astor St Spokane, WA | 2.0 | 1.0 | 1100 | $1,400 | $1.27 | 14d | 1 | 0.72mi |
| 6203 N Astor St Unit 2 Spokane, WA | 2.0 | 1.5 | 1100 | $1,400 | $1.27 | 21d | 1 | 0.72mi |
| 7024 N Colton St Spokane, WA | 2.0 | 2.0 | 1082 | $1,385 | $1.28 | 14d | 1 | 0.73mi |
| 121 E Wedgewood Ave Spokane, WA | 1.0–3.0 | 1.0–1.5 | 833 | $1,205 | $1.45 | 14d | 17 | 0.74mi |
| 2414 E Francis Ave Unit 1 Spokane, WA | 2.0 | 1.0 | 800 | $1,200 | $1.50 | 14d | 1 | 0.84mi |
| 824 E North Ave Unit 824 Spokane, WA | 2.0 | 1.0 | 770 | $1,195 | $1.55 | 24d | 1 | 0.86mi |
| 6029 N Mayfair St Unit 7 Spokane, WA | 1.0 | 1.0 | 725 | $1,025 | $1.41 | 14d | 1 | 0.93mi |
| 6018 N Ruby St #8 Spokane, WA | 2.0 | 1.0 | 600 | $995 | $1.66 | 14d | 1 | 0.96mi |
| 6601 N Atlantic St Unit 6625 Spokane, WA | 2.0 | 1.0 | 697 | $1,000 | $1.43 | 14d | 1 | 1.02mi |
| 7001 N Atlantic St Spokane, WA | 1.0 | 1.0 | 600 | $995 | $1.66 | 24d | 1 | 1.04mi |
| 8424 N Nevada St Unit 308 Spokane, WA | 1.0 | 1.0 | 660 | $1,065 | $1.61 | 24d | 1 | 1.04mi |
| 8424 N Nevada St Apt 314 Spokane, WA | 1.0 | 1.0 | 660 | $1,065 | $1.61 | 44d | 1 | 1.07mi |
| 8424 N Nevada St Unit 54 Spokane, WA | 1.0 | 1.0 | 660 | $1,050 | $1.59 | 24d | 1 | 1.07mi |
| 8424 N Nevada St Unit 412 Spokane, WA | 1.0 | 1.0 | 660 | $1,010 | $1.53 | 44d | 1 | 1.07mi |
| 6229 N Regal St Unit B Spokane, WA | 2.0 | 1.0 | 822 | $1,150 | $1.40 | 24d | 1 | 1.10mi |
| 6105 N Regal St Unit B Spokane, WA | 2.0 | 1.5 | 600 | $1,295 | $2.16 | 14d | 1 | 1.11mi |
| 2506 E Rowan Ave Unit 2508 Spokane, WA | 2.0 | 1.0 | 760 | $1,350 | $1.78 | 24d | 1 | 1.16mi |
| 636 E Magnesium Rd Spokane, WA | 1.0–3.0 | 1.0–3.0 | 1053 | $1,780 | $1.69 | 14d | 12 | 1.22mi |
| 3015 E Central Ave Apt 1 Spokane, WA | 2.0 | 1.0 | 736 | $1,000 | $1.36 | 24d | 1 | 1.30mi |
| 1910 E Wellesley Ave Unit 1912 Spokane, WA | 2.0 | 1.0 | 800 | $1,125 | $1.41 | 24d | 1 | 1.37mi |
| 8422 N Mayfair St Unit 2 Spokane, WA | 2.0 | 1.0 | 800 | $1,195 | $1.49 | 24d | 1 | 1.39mi |
| 401 E Magnesium Rd Spokane, WA | 1.0–2.0 | 1.0 | 730 | $1,290 | $1.77 | 44d | 4 | 1.40mi |
| 849 E Magnesium Rd Spokane, WA | 1.0–3.0 | 1.0–2.0 | 931 | $1,512 | $1.62 | 14d | 6 | 1.42mi |
| 39 E Mayfair Ct Apt 2 Spokane, WA | 2.0 | 1.0 | 850 | $995 | $1.17 | 44d | 1 | 1.45mi |
Listing history 4 events
-
2026-05-21status Pending
-
2026-04-28$69,900 Active
-
2006-06-02soldstatus $22,000 67-char remark
Show marketing remark (67 chars)
Well maintained 2 bedroom, 2 bathroom in Contempo mobile home park.
-
2006-05-16$24,500 67-char remark
Show marketing remark (67 chars)
Well maintained 2 bedroom, 2 bathroom in Contempo mobile home park.
ⓘ Source: listings_history table (triggers on properties + properties_extension) + one-shot
backfill from property_details.listing_events for pre-trigger history.
Tax reassessment forecast WA · Resets to sale price
- Current annual tax
- $375 · $31/mo
- Projected year-2 tax
- $685 · $57/mo
- Expected delta
- +$310/yr (+$26/mo · 82.5%)
ⓘ Screening estimate from a state-policy table — verify with the county assessor before closing.
Climate risk First Street
- Flood 1/10 Low FEMA zone X (unshaded) · 0% chance over 30 yrs
- Wildfire 1/10 Low
- Heat 3/10 Moderate 6 d/yr ≥94°F today · 12 d/yr by 30 yrs out
- Wind 1/10 Low
- Air quality 10/10 Extreme 19 unhealthy d/yr today · 21 by 30 yrs out
Nearby sold comps map
Loading sold comps map…
Walkable amenities ~0.75 mi
Loading nearby amenities…
Taxation est. · year 1
- Rental income
- $15,119
- − Mortgage interest
- −$3,915
- − Property taxes
- −$375
- − Insurance
- −$350
- − Repairs & maintenance
- −$1,210
- − Management
- −$1,210
- − Depreciation
- −$2,033
- Taxable income
- $6,026
- Est. tax owed @ 24.0%
- −$1,446
- After-tax cash flow
- $5,374/yr
For passive investors: Depreciation is non-cash, so a rental often shows a tax loss while cash-flowing — sheltering income. Rental losses are passive: they offset passive income freely, and up to $25,000/yr can offset ordinary (W-2) income if you actively participate and your MAGI is under $100k (phasing out to $0 by $150k); unused losses carry forward. On sale, claimed depreciation is recaptured at up to 25%, and gains may owe capital-gains tax (a 1031 exchange can defer both). Figures are a year-1 estimate at your 24.0% rate — not tax advice; consult a CPA.
Schools (NCES district)
- District
- Spokane School District
- NCES district ID
- 5308250
- Math proficiency
- 47% ▲ 1.00%
- Reading proficiency
- 58% ▲ 1.00%
- Median HH income
- $43,187
- Composite
- 46.1/100
- National rank
- #5477
- State rank
- #136 of 291 in WA
Livability — Spokane
- Score
- 80/100
- State rank
- #93
- US rank
- #1822
Category grades
Schools grade is shown separately in the Schools card above.
Census & demographics
- Census place
- Spokane, WA
- County
- Spokane County · 496,401 people
- City population
- 298,820
- Metro
- Spokane-Spokane Valley, WA
- Population (ZIP)
- 32,770
- Household income
- $60,452
- Rent vs Own
- Severe rent burden
- 1557.0
Population outlook (Spokane County) Hauer SSP2
- Today (2025)
- 531,314 people
- By 2030
- 549,278 · +3.4%
- By 2040
- 577,822 · +8.8%
- By 2050
- 598,188 · +12.6%
- By 2075
- 630,744 · +18.7%
- By 2100
- 622,360 · +17.1%
Race, ethnicity, and origin ACS 2023
- Neighborhood character
- Predominantly White (76%)
- Race & ethnicity
- White 76% Two or more races 10% Hispanic / Latino 8% Black 4% Asian 3% Native American 1%
- Hispanic origin (detail)
- Mexican 5%
- Common ancestry
- Portuguese 3% Lithuanian 3% Slovak 3%
- Foreign-born
- 6% · Canada, Vietnam, Philippines
- Languages at home
- 90% English-only · Spanish 3% Russian/Polish/Slavic 1% Other Asian/Pacific 1%
Political lean MEDSL · Spokane
- 2024 margin
- Toss-up / Even · D 46.0% · R 51.0% · Other 3.0%
- 2008→2024 swing
- -3.8pp toward R · 2008: -1.1pp · 2024: -5.0pp
- All cycles
- 2024: R+5.0 2020: R+4.3 2016: R+8.3 2012: R+6.3 2008: R+1.1
Not yet ingested
- Civics
- —
Market trends
- HPI YoY
- ▼ -103.43%
- Current HPI
- 381.758
- Rent YoY
- ▲ 3.25%
- Metro
- Spokane-Spokane Valley, WA
- State GDP YoY
- ▲ 4.65%
- F500 in state
- 22
Industry mix (Fortune 500 HQ in WA)
| Industry | F500 HQs | Revenue |
|---|---|---|
| Retail | 2 | $269B |
|
||
| Technology / Retail | 1 | $638B |
|
||
| Technology | 1 | $245B |
|
||
| Telecommunications | 1 | $38B |
|
||
| Food / Beverage | 1 | $36B |
|
||
| Automotive / Trucks | 1 | $34B |
|
||
Price history
+185.3% since first listed4 events — show timeline
- 2026-05-21 Pending — SPOKANEMLS as Distributed by MLS Grid
- 2026-04-28 Listed $69,900 SPOKANEMLS as Distributed by MLS Grid
- 2006-06-02 Sold (MLS) $22,000 SPOKANEMLS as Distributed by MLS Grid
- 2006-05-16 Listed $24,500 SPOKANEMLS as Distributed by MLS Grid
Property tax history
+7.6%/yrLatest (2026): $375 · +64.2% YoY. Source: county tax records.
Cash-flow waterfall
monthlySold comps — $/sqft
last 12 mo · ≤1 miLoading sold comps…