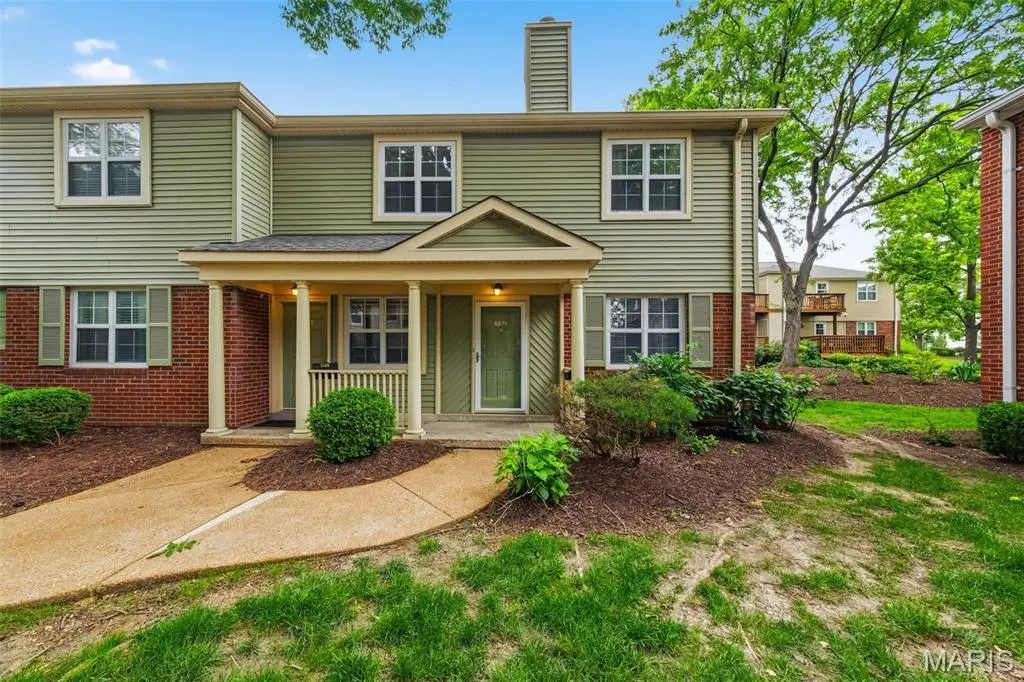
8871 Flamingo Ct · Brentwood, MO
Flood risk 1/10 · Minimal
- FEMA flood zone
- X (unshaded)
- Chance of flooding over 30 yrs
- 0.0%
- Est. flood insurance / yr
- $507 – $1,088
Fire risk 1/10 · Minimal
- Est. fire insurance / yr
- $1,054 – $1,958
Heat risk 5/10 · Moderate
- Hot days now (above 107°F)
- 7 days/yr
- Hot days in 30 yrs
- 21 days/yr
Wind risk 2/10 · Minimal
- Chance of severe wind over 30 yrs
- 1.0%
Air-quality risk 3/10 · Minor
- Unhealthy air days now
- 3 days/yr
- Unhealthy air days in 30 yrs
- 4 days/yr
Risk factors via First Street. Map © Google.
Why this score? — see what drove the D grade
The composite is a weighted blend of 9 inputs, each scored 0–100. Each bar is that input's sub-score; the figure is the points it added to the 100-point composite (weight × sub-score).
- Cash flow +9.8/30.0
- ARV discount +7.5/15.0
- Schools +5.8/10.0
- 1% rule +5.5/10.0
- Livability +4.2/5.0
- Rent growth +2.9/5.0
- DSCR +2.8/10.0
- Condition / age +2.5/5.0
- Appreciation +0.0/10.0
$165,000
🖨 Deal sheet (PDF) 📄 Offer letter ✓ Due diligence
Listing remarks
Welcome to worry-free living in the heart of Brentwood Forest! This beautifully updated, ground-level unit offers the perfect blend of comfort, convenience, and privacy. As a highly desirable end unit tucked away in a quiet courtyard, this 2-bedroom, 1-bathroom home provides a peaceful retreat while keeping you close to everything. Step inside to find a fresh, clean interior featuring brand-new carpet, crisp paint, and a modern, updated bathroom vanity. The fully equipped kitchen boasts stylish appliances. All the appliances including the newer washer and dryer are included in the sale. The open dining area features sliding glass doors that lead to an oversized, private deck with extra stor
Key facts
- $363 HOA
- Parking
- Community pool
Property features AI
Finance
- HOA & community: HOA: Brentwood Forest; Monthly association fee; Community amenities include clubhouse, lake, pool, spa/hot tub, tennis courts, and trails; Association fee covers clubhouse
Exterior
- Parking: Assigned parking; Asphalt parking surface; 1 parking space
- Utilities: Public water; Public sewer; Electric service by Ameren; Cable available
- Home design: Residential condominium; One-level
- Construction: Frame construction
- Exterior features: Deck; Level lot
Interior
- Kitchen: Built-in electric range; Microwave; Dishwasher; Refrigerator; Disposal
- Bedrooms: 2 bedrooms on the main level
- Flooring: Carpet; Ceramic tile
- Bathrooms: 1 full bathroom on the main level
- Heating & cooling: Forced air heating; Central air; Ceiling fan(s)
- Interior features: Dishwasher; Disposal; Microwave; Built-in electric range; Refrigerator; Gas water heater; Ceiling fan(s); Central air; Forced air heating
- Laundry & utility: Stacked washer and dryer
Neighborhood map
What this means for you Summary
Snapshot
- This is a 2-bed/1.0-bath condo listed at $165k.
Deal economics
- At list price, monthly cash flow is $-105 ($-1k/yr) — negative.
- To cash-flow at today's rent, offer at most $146k (11.3% below list).
- Meets the 1% rule at list price ($2k rent vs $165k).
- Recommended offer: $146k (11.3% below list) — sets the bar for cash-flow.
Location & tenants
- Location reads 84/100 on livability (#6 in MO, #689 nationally) — a professional / high-income tenant draw. Strengths: employment A+, housing A+, cost of living B; Watch: crime C-.
- Brentwood (suburban): math 65% / reading 66% proficiency, ranked #4 of 324 in MO (top 1%) — acceptable for families but not a draw, mixed tenant base, ~2y average lease; only 18% free/reduced lunch — higher-income household profile.
- Zoned schools: Mark Twain Elem. (math 67% / reading 67%, grade B+, #46 of 1,115 statewide, top 5%, 157 students, 18% FRL); Brentwood High (math 62% / reading 74%, grade B, #12 of 521 statewide, top 2%, 191 students, 30% FRL).
- Market conditions: Rents rising (+1.5%/yr); 130 active listings in the ZIP; 27 comparable units currently listed for rent nearby; rentals at typical pace (median 25d on market — plan ~3-4 weeks tenant-placement turnaround); 44% of comp listings sitting > 30 days — soft ceiling on asking rent; solid renter incomes; 920 units permitted in St. Louis County in 2024 (250 in 5+ unit buildings).
Forward outlook
- Local home prices are declining (-3.0%/yr); year-one equity from $1k of loan paydown is wiped out by about $5k of value loss. Plan a longer hold.
Negotiation context
- Only 4 days on market — expect competitive offers; lowballing is unlikely to land.
Risks & watch-outs
- Watch-outs: HOA is 21% of rent; built in 1950 — expect roof / HVAC / electrical / plumbing capex.
- Climate carrying-cost: extreme-heat days projected 7→21/yr by 2055 (HVAC capex compounding) — expect insurance premiums to compound above CPI over the hold.
Questions for the listing agent
- What do current leases actually rent for vs. the listed asking? Can we see a recent rent roll and the last 12 months of T-12 income?
- Built in 1950 — when were the roof, HVAC, electrical panel, plumbing, and water heater last replaced?
- What does the HOA fee cover, when was the last increase, and are there any pending special assessments or reserve-fund shortfalls?
- Any open or pending special assessments — roof, HVAC, plumbing, elevator, façade? What's the per-unit balance and payoff schedule, and is the seller paying it off at close or rolling it to the buyer?
- Is there a deadline driving the sale (1031 exchange, divorce, estate, relocation)? That informs how much negotiation room exists.
- Schools are A-rated — typically a magnet for longer-tenancy family renters. What's the average tenant stay here, and is there a school-zone premium baked into asking?
- The area grade is low — what's the realistic commute time and amenity access for the typical tenant pool here? Any planned neighborhood developments (good or bad) we should know about?
- What's the average days-on-market for RENTAL listings here right now (not sales)? A rising rental-DOM trend means longer vacancies and softer asking-rent achievability than the comps imply.
- What's the recent tenant-quality profile in this submarket — average credit score on applications, eviction rate, late-payment / NSF rate, and stable-employment percentage? A property-management company in the area should have these aggregated.
- How much new apartment / multifamily construction is in the pipeline within 1–3 miles? Heavy new supply (>2% of stock underway) typically softens rents 12–24 months out; light construction supports rent growth.
Investment metrics
- 1% rule
- 1.05% ✓
- Cap rate
- 5.53%
- Cash-on-cash
- -2.74%
- DSCR
- 0.88
- GRM
- 8.0
CMA / ARV
No comps found within radius.
Projected returns pro-forma
-3.0% appreciation · 1.49% rent growth · sell at horizon
- IRR
- -22.9%
- Equity multiple
- 0.22×
- Total profit
- $-35,811
- Equity at exit
- $24,602
- IRR
- -23.0%
- Equity multiple
- -0.06×
- Total profit
- $-49,195
- Equity at exit
- $14,266
Cash invested: $46,200 (down + closing). Projections, not guarantees.
Landlord ↔ Tenant lean methodology
- Overall (STATE)
- 81 Strongly Landlord-Friendly
- State Missouri
- 81 Strongly Landlord-Friendly · R+10
- County
- — inherits STATE
- City
- — inherits STATE
ZIP-level market 63144
- Rents YoY
- 1.5%
- Active inventory
- 130
- Price-to-rent
- 8.0×
Monthly cashflow live
- Estimated rent
- $1,727 high interval (Pro) →
- Mortgage (P&I)
- −$865
- Tax from tax record
- −$172 /mo · $2,069/yr
- Insurance
- −$69
- HOA
- −$363
- Vacancy / Maint / Mgmt
- −$363
- Net cashflow
- $-105
Break-even live
Sensitivity live
| Price | -10% $-12 | -5% $-59 | +0% $-105 | +5% $-152 | +10% $-199 |
|---|---|---|---|---|---|
| Rent | -10% $-242 | -5% $-174 | +0% $-105 | +5% $-37 | +10% $31 |
| Rate | -1.0pp $-22 | -0.5pp $-64 | base $-105 | +0.5pp $-148 | +1.0pp $-192 |
UW: 25.0% down · 7.5% · 30yr · 1.5% tax · 5.0% vac · 8.0% maint · 8.0% mgmt
Financing live
Cash to close
- Down payment
- $41,250
- Closing costs
- $4,950
- Reserves months
- —
- Total cash needed
- —
Loan-product check · same deal, 3 products live
Conventional
25% down · 7.5% · 30yr
- Down + closing
- —
- Monthly P&I
- —
- Monthly cashflow
- —
- DSCR
- —
- Eligible?
- —
Personal DTI + credit; lowest rate.
DSCR
20% down · 8.5% · 30yr
- Down + closing
- —
- Monthly P&I
- —
- Monthly cashflow
- —
- DSCR
- —
- Eligible?
- —
No personal income docs; deal must DSCR.
Hard money
10% down · 12.0% · 12mo
- Down + closing
- —
- Monthly P&I
- —
- Monthly cashflow
- —
- DSCR
- —
- Eligible?
- —
Short-term bridge; refi at stabilization.
Rent comps 27 comps
| Address | Beds | Baths | Sqft | Rent | $/sqft | DOM | Units | Dist |
|---|---|---|---|---|---|---|---|---|
| 1469 Bobolink Pl Saint Louis, MO | 2.0 | 1.0 | 981 | $1,700 | $1.73 | 45d | 1 | 0.09mi |
| 8901 Cardinal Ter Saint Louis, MO | 2.0 | 1.0 | 1004 | $1,600 | $1.59 | 11d | 1 | 0.14mi |
| 1607 Redbird Cv Saint Louis, MO | 2.0 | 1.0 | 946 | $2,038 | $2.15 | 0d | 1 | 0.23mi |
| 9071 Wrenwood Ln Saint Louis, MO | 2.0 | 1.0 | 1060 | $1,650 | $1.56 | 45d | 1 | 0.24mi |
| 1696 E Swan Cir Saint Louis, MO | 2.0 | 1.0 | 967 | $1,600 | $1.65 | 45d | 1 | 0.25mi |
| 1800 S Brentwood Blvd Saint Louis, MO | 1.0–3.0 | 1.0–2.0 | 1164 | $2,120 | $1.82 | 0d | 18 | 0.35mi |
| 1736 Redbird Cv Saint Louis, MO | 2.0 | 1.0 | 900 | $1,800 | $2.00 | 45d | 1 | 0.35mi |
| 8661 Litzsinger Rd Saint Louis, MO | 2.0 | 1.0 | 910 | $1,765 | $1.94 | 45d | 1 | 0.87mi |
| 2501 Mary Ave Brentwood, MO | 1.0 | 1.5 | 1100 | $1,725 | $1.57 | 9d | 1 | 0.94mi |
| 8056 Davis Dr Unit 80562N Saint Louis, MO | 1.0 | 1.0 | 840 | $1,700 | $2.02 | 45d | 1 | 0.96mi |
| 9386 Golden Gate Rd Saint Louis, MO | 2.0 | 1.0 | 840 | $2,283 | $2.72 | 0d | 1 | 1.03mi |
| 9006 Madge Ave Saint Louis, MO | 2.0 | 2.0 | 1000 | $2,100 | $2.10 | 9d | 1 | 1.03mi |
| 72 Van Mark Way Brentwood, MO | 1.0–2.0 | 1.0 | 780 | $1,236 | $1.58 | 0d | 4 | 1.13mi |
| 7570 Oxford Dr Apt 2S Clayton, MO | 2.0 | 1.0 | 1100 | $2,600 | $2.36 | 0d | 1 | 1.18mi |
| 2806 Hilldale Ave Saint Louis, MO | 2.0 | 2.0 | 1104 | $2,550 | $2.31 | 0d | 1 | 1.23mi |
| 7553 Buckingham Dr Clayton, MO | 2.0 | 1.0 | 900 | $1,695 | $1.88 | 45d | 1 | 1.27mi |
| 7530 Buckingham Dr Saint Louis, MO | 1.0 | 1.0 | 800 | $900 | $1.12 | 45d | 1 | 1.28mi |
| 7537 Buckingham Dr Saint Louis, MO | 2.0 | 1.0 | 1000 | $1,850 | $1.85 | 9d | 1 | 1.29mi |
| 7720 Gissler Ave Unit 1E Richmond Heights, MO | 1.0 | 1.0 | 900 | $925 | $1.03 | 45d | 1 | 1.30mi |
| 7784 W Bruno Ave Saint Louis, MO | 2.0 | 1.0 | 900 | $950 | $1.06 | 45d | 1 | 1.32mi |
| 7555 Byron Pl Unit 55-1N Clayton, MO | 3.0 | 1.0 | 1100 | $1,900 | $1.73 | 25d | 1 | 1.33mi |
| 7828 Laclede Forest Dr Maplewood, MO | 1.0–2.0 | 1.0 | 725 | $1,345 | $1.86 | 4d | 2 | 1.34mi |
| 7551 Byron Pl Unit 51-2S Clayton, MO | 2.0 | 1.0 | 900 | $1,500 | $1.67 | 45d | 1 | 1.34mi |
| 7551 Byron Pl Unit 51-1S Clayton, MO | 2.0 | 1.0 | 900 | $1,400 | $1.56 | 25d | 1 | 1.34mi |
| 9305 Manchester Rd St. Louis, MO | 1.0–2.0 | 1.0 | 776 | $1,445 | $1.86 | 3d | 12 | 1.37mi |
| 1421 Claytonia Ter Unit 1F Richmond Heights, MO | 2.0 | 1.0 | 855 | $1,125 | $1.32 | 11d | 1 | 1.43mi |
| 1034 N Rock Hill Rd Saint Louis, MO | 2.0 | 1.0 | 696 | $1,650 | $2.37 | 45d | 1 | 1.48mi |
HOA detail condo
- Monthly dues
- $363 · $4,356/yr
- Assessments
- None detected in remarks — confirm with the listing agent.
Listing history 6 events
-
2026-05-23historical $165,000
-
2005-05-31soldstatus $149,900
-
2004-05-24soldstatus $144,000
-
2002-07-10soldstatus $124,000
-
1996-11-04soldstatus $65,000
-
1994-01-15soldstatus $60,000
ⓘ Source: listings_history table (triggers on properties + properties_extension) + one-shot
backfill from property_details.listing_events for pre-trigger history.
Tax reassessment forecast MO · Resets to sale price
- Current annual tax
- $2,069 · $172/mo
- Projected year-2 tax
- $2,069 · $172/mo
- Expected delta
- $0/yr ($0/mo · 0.0%)
ⓘ Screening estimate from a state-policy table — verify with the county assessor before closing.
Climate risk First Street
- Flood 1/10 Low FEMA zone X (unshaded) · 0% chance over 30 yrs
- Wildfire 1/10 Low
- Heat 5/10 Major 7 d/yr ≥107°F today · 21 d/yr by 30 yrs out
- Wind 2/10 Low 100% chance of damaging wind over 30 yrs
- Air quality 3/10 Moderate 3 unhealthy d/yr today · 4 by 30 yrs out
Nearby sold comps map
Loading sold comps map…
Walkable amenities ~0.75 mi
Loading nearby amenities…
Taxation est. · year 1
- Rental income
- $20,718
- − Mortgage interest
- −$9,243
- − Property taxes
- −$2,069
- − Insurance
- −$825
- − Repairs & maintenance
- −$1,657
- − Management
- −$1,657
- − HOA
- −$4,356
- − Depreciation
- −$4,800
- Taxable loss
- −$3,889
- Est. tax savings @ 24.0%
- +$933
- After-tax cash flow
- $-332/yr
For passive investors: Depreciation is non-cash, so a rental often shows a tax loss while cash-flowing — sheltering income. Rental losses are passive: they offset passive income freely, and up to $25,000/yr can offset ordinary (W-2) income if you actively participate and your MAGI is under $100k (phasing out to $0 by $150k); unused losses carry forward. On sale, claimed depreciation is recaptured at up to 25%, and gains may owe capital-gains tax (a 1031 exchange can defer both). Figures are a year-1 estimate at your 24.0% rate — not tax advice; consult a CPA.
Schools (NCES district)
- District
- Brentwood
- NCES district ID
- 2905880
- Math proficiency
- 65% ▼ -3.00%
- Reading proficiency
- 66% ▼ -1.00%
- Median HH income
- $69,522
- Composite
- 57.51/100
- National rank
- #1069
- State rank
- #4 of 324 in MO
Livability — Brentwood
- Score
- 84/100
- State rank
- #6
- US rank
- #689
Category grades
Schools grade is shown separately in the Schools card above.
Census & demographics
- Census place
- Brentwood, MO
- County
- Saint Louis County · 888,823 people
- City population
- 9,505
- Metro
- St. Louis, MO-IL
- Population (ZIP)
- 9,505
- Household income
- $104,438
- Rent vs Own
- Severe rent burden
- 310.0
Population outlook (St. Louis County) Hauer SSP2
- Today (2025)
- 1,025,227 people
- By 2030
- 1,028,023 · +0.3%
- By 2040
- 1,020,940 · -0.4%
- By 2050
- 1,007,280 · -1.8%
- By 2075
- 987,277 · -3.7%
- By 2100
- 921,984 · -10.1%
Race, ethnicity, and origin ACS 2023
- Neighborhood character
- Predominantly White (78%)
- Race & ethnicity
- White 78% Two or more races 10% Asian 7% Black 5% Hispanic / Latino 2%
- Common ancestry
- Romanian 4% Italian 3% Slovak 2%
- Foreign-born
- 11% · China, Canada, South Korea
- Languages at home
- 91% English-only · Other Asian/Pacific 2% Spanish 2% Russian/Polish/Slavic 1%
Political lean MEDSL · St. Louis
- 2024 margin
- Strong D (+23.4) · D 60.8% · R 37.4% · Other 1.7%
- 2008→2024 swing
- +3.5pp toward D · 2008: 19.9pp · 2024: 23.4pp
- All cycles
- 2024: D+23.4 2020: D+24.0 2016: D+16.2 2012: D+13.7 2008: D+19.9
Not yet ingested
- Civics
- —
Market trends
- HPI YoY
- ▼ -411.33%
- Current HPI
- 207.0145
- Rent YoY
- ▲ 1.49%
- Metro
- St. Louis, MO-IL
- State GDP YoY
- ▲ 1.84%
- F500 in state
- 20
Industry mix (Fortune 500 HQ in MO)
| Industry | F500 HQs | Revenue |
|---|---|---|
| Healthcare | 1 | $163B |
|
||
| Insurance | 1 | $21B |
|
||
| Industrial Technology | 1 | $17B |
|
||
| Retail | 1 | $16B |
|
||
| Industrial Distribution | 1 | $10B |
|
||
| Utilities | 1 | $9B |
|
||
Price history
+175.0% since first listed6 events — show timeline
- 2026-05-23 Coming Soon $165,000 MARIS as Distributed by MLS Grid
- 2005-05-31 Sold (Public Records) $149,900 Public Records
- 2004-05-24 Sold (Public Records) $144,000 Public Records
- 2002-07-10 Sold (Public Records) $124,000 Public Records
- 1996-11-04 Sold (Public Records) $65,000 Public Records
- 1994-01-15 Sold (Public Records) $60,000 Public Records
Property tax history
+3.0%/yrLatest (2022): $2,069 · +0.8% YoY. Source: county tax records.
Cash-flow waterfall
monthlySold comps — $/sqft
last 12 mo · ≤1 miLoading sold comps…