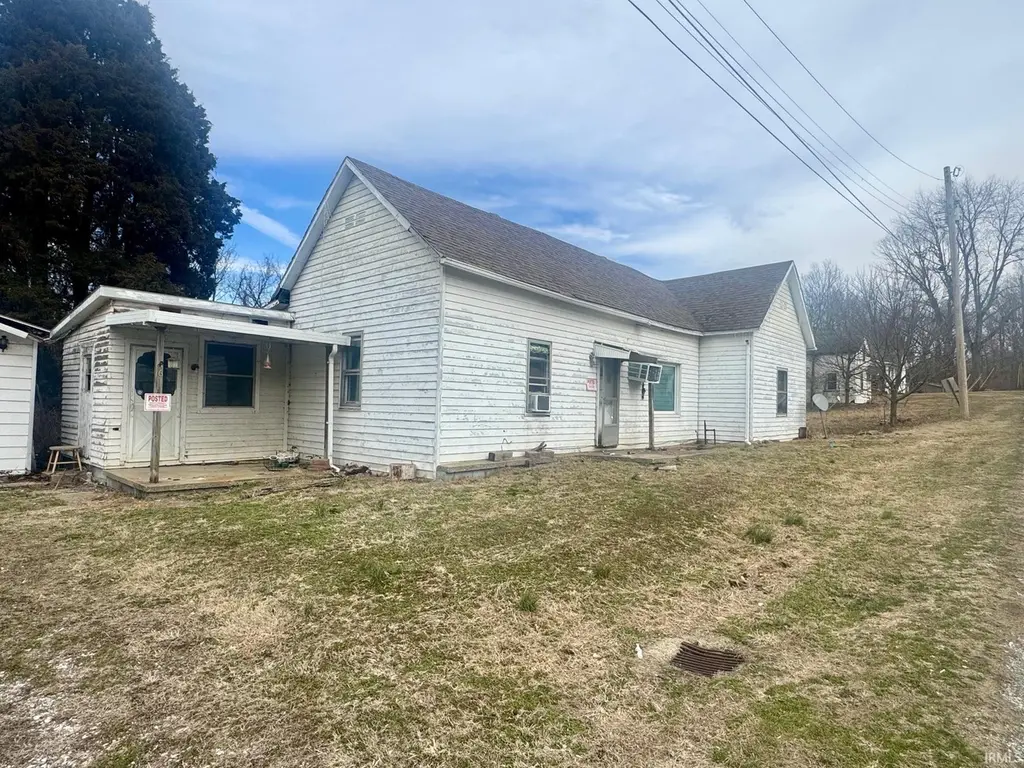
614 E Center St · Hazleton, IN
Flood risk 1/10 · Minimal
- FEMA flood zone
- X (unshaded)
- Chance of flooding over 30 yrs
- 0.0%
- Est. flood insurance / yr
- $473 – $860
Fire risk 1/10 · Minimal
- Est. fire insurance / yr
- $717 – $1,331
Heat risk 4/10 · Minor
- Hot days now (above 106°F)
- 7 days/yr
- Hot days in 30 yrs
- 19 days/yr
Wind risk 2/10 · Minimal
- Chance of severe wind over 30 yrs
- 3.0%
Air-quality risk 2/10 · Minimal
- Unhealthy air days now
- 1 days/yr
- Unhealthy air days in 30 yrs
- 2 days/yr
Risk factors via First Street. Map © Google.
Why this score? — see what drove the B+ grade
The composite is a weighted blend of 9 inputs, each scored 0–100. Each bar is that input's sub-score; the figure is the points it added to the 100-point composite (weight × sub-score).
- Cash flow +30.0/30.0
- 1% rule +10.0/10.0
- DSCR +10.0/10.0
- Appreciation +10.0/10.0
- ARV discount +7.5/15.0
- Livability +3.1/5.0
- Schools +2.7/10.0
- Rent growth +2.5/5.0
- Condition / age +2.5/5.0
$40,000
🖨 Deal sheet (PDF) 📄 Offer letter ✓ Due diligence
Listing remarks MLS
Fixer upper, investment opportunity! Home and detached garage in need of extensive repair. Also could be a great spot for a new home! Selling AS IS
Key facts
- 2.1 acre lot
- 2 garage spots
- Built 1930
Neighborhood map
What this means for you Summary
Snapshot
- This is a 2-bed/1.5-bath single-family listed at $40k.
Deal economics
- At list price, monthly cash flow is $582 ($7k/yr) — positive.
- The deal already cash-flows at list — no discount required.
- Meets the 1% rule at list price ($1k rent vs $40k).
- Recommended offer: $36k (9.0% below list) — sets the bar for market timing.
Location & tenants
- Location reads 61/100 on livability (#493 in IN) — a middle-class / working-renter tenant base. Strengths: cost of living A+, housing A+; Watch: crime D, employment D, schools F.
- North Gibson School Corporation (rural): math 28% / reading 36% proficiency, ranked #223 of 301 in IN (top 74%) — families likely to look elsewhere, expect single-tenant / working-renter base with shorter leases.
- Market conditions: 7 active listings in the ZIP; 167 units permitted in Gibson County in 2024 (68 in 5+ unit buildings).
Forward outlook
- In year one you build about $4k of equity ($277 loan paydown + $4k appreciation (10.0% local appreciation)).
- Gibson County population projected to shrink 10% by 2050 — rents likely to lag national; underwrite the cash flow, not the appreciation.
- At projected returns (10.0% appreciation + 3.0% rent growth), your $11k cash investment doubles in ~1 year — after that, you're playing with house money.
- By year 7, paydown + projected appreciation supports a ~$31k cash-out refi (75% LTV) — recoverable capital for the next deal without selling this one.
Negotiation context
- It's been on market 114 days — a 9% lower offer ($36k) is reasonable based on typical stale-listing flexibility.
- Current owner paid $25k; list at $40k implies a 60% gain — meaningful room to come down on a strong offer.
Risks & watch-outs
- Watch-outs: built in 1930 — expect roof / HVAC / electrical / plumbing capex.
Questions for the listing agent
- It's been on market 114 days. Have you received any prior offers? Is the seller open to a 9% concession, seller financing, or rate buy-down credit?
- Built in 1930 — when were the roof, HVAC, electrical panel, plumbing, and water heater last replaced?
- Why hasn't it sold? Are there any deal-killer items the seller is aware of (foundation, flood, title, zoning, code violations)?
- Is there a deadline driving the sale (1031 exchange, divorce, estate, relocation)? That informs how much negotiation room exists.
- Schools are F-rated, which usually means shorter tenancies and higher turnover. Who's the typical renter profile here, and what's been the actual vacancy rate?
- Crime grade is D in this area — have there been break-ins, vandalism, or insurance claims at this property in the last 3 years? What carrier currently insures it and at what premium?
- What's the average days-on-market for RENTAL listings here right now (not sales)? A rising rental-DOM trend means longer vacancies and softer asking-rent achievability than the comps imply.
- What's the recent tenant-quality profile in this submarket — average credit score on applications, eviction rate, late-payment / NSF rate, and stable-employment percentage? A property-management company in the area should have these aggregated.
- How much new for-sale + rental construction is in the pipeline within 1–3 miles? Heavy new supply typically softens prices + rents 12–24 months out; constrained supply supports both.
Investment metrics
- 1% rule
- 2.71% ✓
- Cap rate
- 23.74%
- Cash-on-cash
- 62.33%
- DSCR
- 3.77
- GRM
- 3.1
CMA / ARV
- ARV (median comp)
- $133,840
- List price
- $40,000
- Delta
- -70.11%
- Verdict
- UNDERPRICED
- Comps
- 4 within 1.0 mi
Show comp detail 2 sales within ~0.75 mi
| Address | Dist | Beds/Ba | Sqft | Sold | Price | $/sf | Match |
|---|---|---|---|---|---|---|---|
| 500 E Second St | 0.21mi | 2/1.0 | 1,336 (-6%) | 20mo | $155,000 | $116 | 62 |
| 212 E Third St | 0.37mi | 3/1.0 (+1) | 1,478 (+4%) | 14mo | $108,000 | $73 | 58 |
Match score weights: distance 35% · size 25% · config 20% · recency 20%. Top-matched comps best support the ARV.
Projected returns pro-forma
10.0% appreciation · 3.0% rent growth · sell at horizon
- IRR
- 74.2%
- Equity multiple
- 6.25×
- Total profit
- $58,850
- Equity at exit
- $36,035
- IRR
- 68.2%
- Equity multiple
- 13.87×
- Total profit
- $144,198
- Equity at exit
- $77,711
Cash invested: $11,200 (down + closing). Projections, not guarantees.
Landlord ↔ Tenant lean methodology
- Overall (STATE)
- 90 Strongly Landlord-Friendly
- State Indiana
- 90 Strongly Landlord-Friendly · R+11
- County
- — inherits STATE
- City
- — inherits STATE
ZIP-level market 47640
- Home prices YoY
- 4.9%
- Active inventory
- 7
- Price-to-rent
- 3.1×
Monthly cashflow live
- Estimated rent
- $1,083 medium interval (Pro) →
- Mortgage (P&I)
- −$210
- Tax from tax record
- −$48 /mo · $572/yr
- Insurance
- −$17
- HOA
- −$0
- Vacancy / Maint / Mgmt
- −$227
- Net cashflow
- $582
Break-even live
Sensitivity live
| Price | -10% $604 | -5% $593 | +0% $582 | +5% $570 | +10% $559 |
|---|---|---|---|---|---|
| Rent | -10% $496 | -5% $539 | +0% $582 | +5% $625 | +10% $667 |
| Rate | -1.0pp $602 | -0.5pp $592 | base $582 | +0.5pp $571 | +1.0pp $561 |
UW: 25.0% down · 7.5% · 30yr · 1.5% tax · 5.0% vac · 8.0% maint · 8.0% mgmt
Financing live
Cash to close
- Down payment
- $10,000
- Closing costs
- $1,200
- Reserves months
- —
- Total cash needed
- —
Loan-product check · same deal, 3 products live
Conventional
25% down · 7.5% · 30yr
- Down + closing
- —
- Monthly P&I
- —
- Monthly cashflow
- —
- DSCR
- —
- Eligible?
- —
Personal DTI + credit; lowest rate.
DSCR
20% down · 8.5% · 30yr
- Down + closing
- —
- Monthly P&I
- —
- Monthly cashflow
- —
- DSCR
- —
- Eligible?
- —
No personal income docs; deal must DSCR.
Hard money
10% down · 12.0% · 12mo
- Down + closing
- —
- Monthly P&I
- —
- Monthly cashflow
- —
- DSCR
- —
- Eligible?
- —
Short-term bridge; refi at stabilization.
Listing history 18 events
-
2026-06-21days on market $40,000 Active 114 DOM
-
2026-06-18days on market $40,000 Active 112 DOM
-
2026-06-17days on market $40,000 Active 111 DOM
-
2026-06-16days on market $40,000 Active 110 DOM
-
2026-06-15days on market $40,000 Active 109 DOM
-
2026-06-13days on market $40,000 Active 107 DOM
-
2026-06-12days on market $40,000 Active 106 DOM
-
2026-06-09days on market $40,000 Active 103 DOM
-
2026-06-08days on market $40,000 Active 102 DOM
-
2026-06-07days on market $40,000 Active 101 DOM
-
2026-06-04days on market $40,000 Active 97 DOM
-
2026-06-02days on market $40,000 Active 96 DOM
-
2026-06-01days on market $40,000 Active 95 DOM
-
2026-05-31days on market $40,000 Active 94 DOM
-
2026-05-31days on market $40,000 Active 93 DOM
-
2026-02-26$40,000 Active 147-char remark
Show marketing remark (147 chars)
Fixer upper, investment opportunity! Home and detached garage in need of extensive repair. Also could be a great spot for a new home! Selling AS IS
-
2017-04-13soldstatus $25,000
-
2011-04-18soldstatus $32,500
ⓘ Source: listings_history table (triggers on properties + properties_extension) + one-shot
backfill from property_details.listing_events for pre-trigger history.
Tax reassessment forecast IN · Partial reset (capped growth)
- Current annual tax
- $572 · $48/mo
- Projected year-2 tax
- $572 · $48/mo
- Expected delta
- $0/yr ($0/mo · 0.0%)
ⓘ Screening estimate from a state-policy table — verify with the county assessor before closing.
Climate risk First Street
- Flood 1/10 Low FEMA zone X (unshaded) · 0% chance over 30 yrs
- Wildfire 1/10 Low
- Heat 4/10 Moderate 7 d/yr ≥106°F today · 19 d/yr by 30 yrs out
- Wind 2/10 Low 3% chance of damaging wind over 30 yrs
- Air quality 2/10 Low 1 unhealthy d/yr today · 2 by 30 yrs out
Nearby sold comps map
Loading sold comps map…
Walkable amenities ~0.75 mi
Loading nearby amenities…
Taxation est. · year 1
- Rental income
- $13,000
- − Mortgage interest
- −$2,241
- − Property taxes
- −$572
- − Insurance
- −$200
- − Repairs & maintenance
- −$1,040
- − Management
- −$1,040
- − Depreciation
- −$1,164
- Taxable income
- $6,744
- Est. tax owed @ 24.0%
- −$1,618
- After-tax cash flow
- $5,362/yr
For passive investors: Depreciation is non-cash, so a rental often shows a tax loss while cash-flowing — sheltering income. Rental losses are passive: they offset passive income freely, and up to $25,000/yr can offset ordinary (W-2) income if you actively participate and your MAGI is under $100k (phasing out to $0 by $150k); unused losses carry forward. On sale, claimed depreciation is recaptured at up to 25%, and gains may owe capital-gains tax (a 1031 exchange can defer both). Figures are a year-1 estimate at your 24.0% rate — not tax advice; consult a CPA.
Schools (NCES district)
- District
- North Gibson School Corporation
- NCES district ID
- 1807770
- Math proficiency
- 28% ▼ -10.00%
- Reading proficiency
- 36% ▼ -4.00%
- Median HH income
- $44,595
- Composite
- 27.32/100
- National rank
- #6992
- State rank
- #223 of 301 in IN
Livability — Hazleton
- Score
- 61/100
- State rank
- #493
- US rank
- #17550
Category grades
Schools grade is shown separately in the Schools card above.
Census & demographics
- Census place
- Hazleton, IN
- Population (ZIP)
- 882
Population outlook (Gibson County) Hauer SSP2
- Today (2025)
- 33,671 people
- By 2030
- 33,409 · -0.8%
- By 2040
- 32,364 · -3.9%
- By 2050
- 30,453 · -9.6%
- By 2075
- 24,610 · -26.9%
- By 2100
- 16,217 · -51.8%
Race, ethnicity, and origin ACS 2023
- Neighborhood character
- Predominantly White (97%)
- Race & ethnicity
- White 97% Two or more races 3%
- Common ancestry
- Slovak 7% Romanian 6% Lithuanian 4%
Political lean MEDSL · Gibson
- 2024 margin
- Solid R (+51.4) · D 23.4% · R 74.8% · Other 1.8%
- 2008→2024 swing
- -38.2pp toward R · 2008: -13.2pp · 2024: -51.4pp
- All cycles
- 2024: R+51.4 2020: R+48.2 2016: R+47.6 2012: R+31.0 2008: R+13.2
Not yet ingested
- Civics
- —
Market trends
- HPI YoY
- ▲ 11.50%
- Current HPI
- 247.5918
- Rent YoY
- —
- Metro
- —
- State GDP YoY
- ▲ 2.90%
- F500 in state
- 18
Industry mix (Fortune 500 HQ in IN)
| Industry | F500 HQs | Revenue |
|---|---|---|
| Industrial Machinery | 2 | $37B |
|
||
| Healthcare | 1 | $177B |
|
||
| Pharmaceuticals | 1 | $45B |
|
||
| Metals / Steel | 1 | $18B |
|
||
| Agriculture | 1 | $17B |
|
||
| Packaging | 1 | $12B |
|
||
Price history
+23.1% since first listed3 events — show timeline
- 2026-02-26 Listed $40,000 IRMLS
- 2017-04-13 Sold (Public Records) $25,000 Public Records
- 2011-04-18 Sold (Public Records) $32,500 Public Records
Property tax history
+0.8%/yrLatest (2024): $572 · -4.8% YoY. Source: county tax records.
Cash-flow waterfall
monthlySold comps — $/sqft
last 12 mo · ≤1 miLoading sold comps…