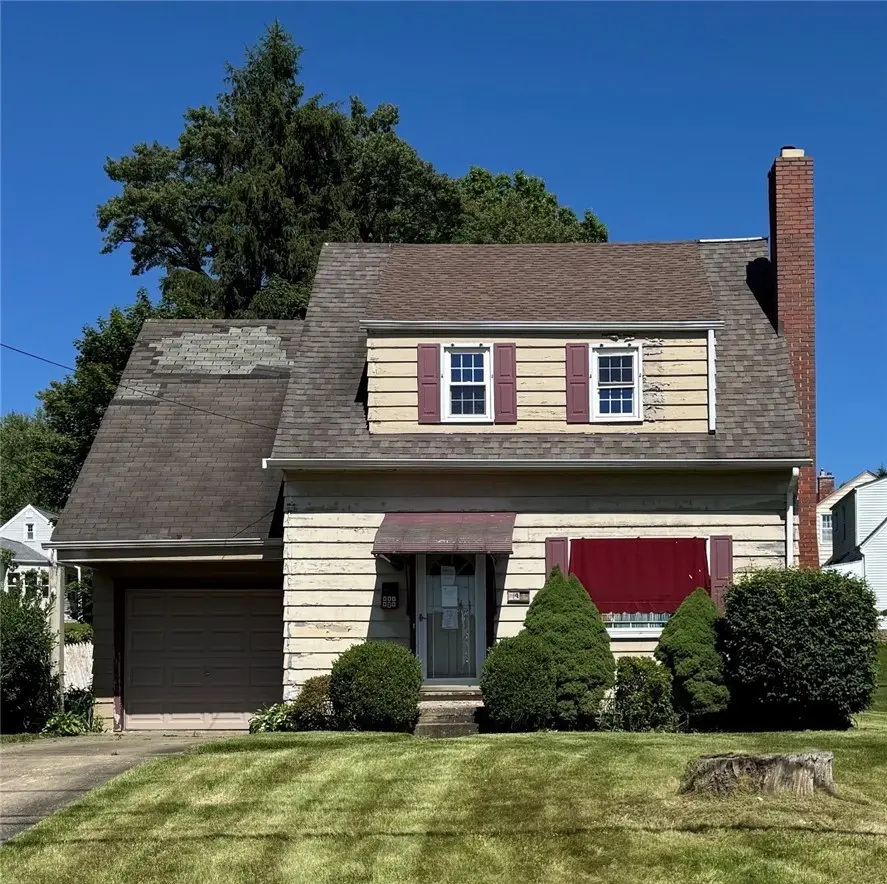
749 Pershing St · Ellwood City, PA
Flood risk 1/10 · Minimal
- FEMA flood zone
- X (unshaded)
- Chance of flooding over 30 yrs
- 0.0%
- Est. flood insurance / yr
- $473 – $860
Fire risk 1/10 · Minimal
- Est. fire insurance / yr
- $511 – $949
Heat risk 3/10 · Minor
- Hot days now (above 97°F)
- 7 days/yr
- Hot days in 30 yrs
- 18 days/yr
Wind risk 1/10 · Minimal
- Chance of severe wind over 30 yrs
- —
Air-quality risk 3/10 · Minor
- Unhealthy air days now
- 2 days/yr
- Unhealthy air days in 30 yrs
- 3 days/yr
Risk factors via First Street. Map © Google.
Why this score? — see what drove the B- grade
The composite is a weighted blend of 9 inputs, each scored 0–100. Each bar is that input's sub-score; the figure is the points it added to the 100-point composite (weight × sub-score).
- Cash flow +30.0/30.0
- 1% rule +10.0/10.0
- DSCR +10.0/10.0
- ARV discount +7.5/15.0
- Livability +3.6/5.0
- Schools +3.5/10.0
- Rent growth +2.5/5.0
- Condition / age +2.5/5.0
- Appreciation +0.0/10.0
$54,900
🖨 Deal sheet 📄 Offer letter ✓ Due diligence
Listing remarks MLS
749 Pershing Street is nestled in Ellwood City’s desirable Ewing Park neighborhood — brimming with potential! Featuring a spacious living and dining area with brick fireplace. The country-style kitchen has cabinets galore. Enjoy family gatherings or your morning coffee on the deck overlooking the spacious backyard. Upstairs, you’ll find 3 generous-sized bedrooms and a full bath. The lower level offers laundry and plenty of storage space. This home offers a solid layout and classic details. Just steps from community amenities like football games, public swimming pool, shopping and restaurants, this property is an ideal investment opportunity. With some TLC, it has the potential to shine as a beautiful family home or income-producing rental.
Key facts
- Brick fireplace
- Community amenities
- Public swimming pool
Tags
Property features AI
Finance
- HOA & community: Public transportation nearby
Exterior
- Parking: Detached garage (1 parking space)
- Utilities: Public water; Public sewer
- Home design: 2-story frame home; Asphalt roof; Resale property
- Construction: Frame construction; Asphalt roof
- Exterior features: Public water; Public sewer; Public transportation access
Interior
- Bathrooms: One full bathroom
- Interior features: Decorative fireplace (1)
Neighborhood map
What this means for you Summary
Snapshot
- This is a 3-bed/1.0-bath single-family listed at $55k.
Deal economics
- At list price, monthly cash flow is $687 ($8k/yr) — positive.
- The deal already cash-flows at list — no discount required.
- Meets the 1% rule at list price ($1k rent vs $55k).
- Recommended offer: $54k (1.5% below list) — sets the bar for market timing.
- Cap rate 21.3% vs local median 5.3% in Ellwood City — top-decile yield for the area; either an underpriced asset or a hidden risk that comps aren't pricing in. Stress-test before assuming the spread holds.
Location & tenants
- Location reads 72/100 on livability (#610 in PA) — a middle-class / working-renter tenant base. Strengths: crime A+, cost of living A+, housing A+; Watch: health & safety C-, amenities F, commute F.
- Ellwood City Area SD (town): math 28% / reading 56% proficiency, ranked #334 of 539 in PA (top 62%) — families likely to look elsewhere, expect single-tenant / working-renter base with shorter leases.
- Market conditions: 53 active listings in the ZIP; 1 comparable units currently listed for rent nearby; 51 units permitted in Lawrence County in 2024 (0 in 5+ unit buildings).
Forward outlook
- Local home prices are declining (-3.0%/yr); year-one equity from $380 of loan paydown is wiped out by about $2k of value loss. Plan a longer hold.
- Lawrence County population projected at -25% by 2050 — secular population decline; favor cash flow + early exit over multi-decade hold.
- At projected returns (-3.0% appreciation + 3.0% rent growth), your $15k cash investment doubles in ~3 years — after that, you're playing with house money.
Negotiation context
- It's been on market 15 days — a 2% lower offer ($54k) is reasonable based on typical stale-listing flexibility.
- 7 sale attempts since 4y ago with the ask held roughly flat each time — persistent listings suggest the price (not the market) is what's stuck; bring a comps-based counter.
Risks & watch-outs
- Watch-outs: built in 1943 — expect roof / HVAC / electrical / plumbing capex.
Questions for the listing agent
- Built in 1943 — when were the roof, HVAC, electrical panel, plumbing, and water heater last replaced?
- Is there a deadline driving the sale (1031 exchange, divorce, estate, relocation)? That informs how much negotiation room exists.
- Schools are B-rated — typically a magnet for longer-tenancy family renters. What's the average tenant stay here, and is there a school-zone premium baked into asking?
- What's the average days-on-market for RENTAL listings here right now (not sales)? A rising rental-DOM trend means longer vacancies and softer asking-rent achievability than the comps imply.
- What's the recent tenant-quality profile in this submarket — average credit score on applications, eviction rate, late-payment / NSF rate, and stable-employment percentage? A property-management company in the area should have these aggregated.
- How much new for-sale + rental construction is in the pipeline within 1–3 miles? Heavy new supply typically softens prices + rents 12–24 months out; constrained supply supports both.
Investment metrics
- 1% rule
- 2.46% ✓
- Cap rate
- 21.31%
- Cash-on-cash
- 53.64%
- DSCR
- 3.39
- GRM
- 3.4
CMA / ARV
- ARV (on-the-fly)
- $166,410
- Comps found
- 12
Show comp detail 12 sales within ~0.75 mi
| Address | Dist | Beds/Ba | Sqft | Sold | Price | $/sf | Match |
|---|---|---|---|---|---|---|---|
| 908 Aetna Dr | 0.23mi | 3/1.5 | 1,156 (-10%) | 4mo | $220,000 | $190 | 67 |
| 209 Line Ave | 0.42mi | 3/1.5 | 1,206 (-6%) | 3mo | $180,000 | $149 | 66 |
| 104 Pittsburgh Cir | 0.58mi | 3/1.5 | 1,334 (+3%) | 4mo | $100,000 | $75 | 62 |
| 511 Bridge St | 0.56mi | 3/1.5 | 1,404 (+9%) | 2mo | $135,000 | $96 | 55 |
| 412 Orchard Ave | 0.60mi | 3/1.5 | 1,400 (+8%) | 3mo | $170,000 | $121 | 53 |
| 118 Glen Ave | 0.64mi | 3/1.0 | 1,400 (+8%) | 6mo | $239,900 | $171 | 51 |
| 328 Line Ave | 0.57mi | 2/2.5 (-1) | 1,203 (-7%) | 2mo | $205,000 | $170 | 50 |
| 434 1st Ave | 0.69mi | 3/2.5 | 1,392 (+8%) | 3mo | $65,000 | $47 | 46 |
| 418 1st Ave | 0.66mi | 2/1.5 (-1) | 1,200 (-7%) | 6mo | $141,000 | $118 | 46 |
| 306 E Hazen Ave | 0.73mi | 3/2.0 | 1,442 (+12%) | 3mo | $185,500 | $129 | 40 |
| 108 Golf Ave | 0.67mi | 2/2.0 (-1) | 1,168 (-10%) | 5mo | $219,900 | $188 | 40 |
| 410 Wampum Ave | 0.68mi | 2/1.0 (-1) | 1,096 (-15%) | 8mo | $75,000 | $68 | 32 |
Match score weights: distance 35% · size 25% · config 20% · recency 20%. Top-matched comps best support the ARV.
Projected returns pro-forma
-3.0% appreciation · 3.0% rent growth · sell at horizon
- IRR
- 51.8%
- Equity multiple
- 3.27×
- Total profit
- $34,886
- Equity at exit
- $8,186
- IRR
- 57.1%
- Equity multiple
- 6.65×
- Total profit
- $86,811
- Equity at exit
- $4,747
Cash invested: $15,372 (down + closing). Projections, not guarantees.
Landlord ↔ Tenant lean methodology
- Overall (STATE)
- 62 Landlord-Friendly
- State Pennsylvania
- 62 Landlord-Friendly · EVEN
- County
- — inherits STATE
- City
- — inherits STATE
ZIP-level market 16117
- Home prices YoY
- -7.5%
- Active inventory
- 53
- Price-to-rent
- 3.4×
Monthly cashflow live
- Estimated rent
- $1,350 medium interval (Pro) →
- Mortgage (P&I)
- −$288
- Tax est. 1.5%
- −$69 /mo · $824/yr
- Insurance
- −$23
- HOA
- −$0
- Vacancy / Maint / Mgmt
- −$284
- Net cashflow
- $687
Break-even live
UW: 25.0% down · 7.5% · 30yr · 1.5% tax · 5.0% vac · 8.0% maint · 8.0% mgmt
Financing live
Cash to close
- Down payment
- $13,725
- Closing costs
- $1,647
- Reserves months
- —
- Total cash needed
- —
Loan-product check · same deal, 3 products live
Conventional
25% down · 7.5% · 30yr
- Down + closing
- —
- Monthly P&I
- —
- Monthly cashflow
- —
- DSCR
- —
- Eligible?
- —
Personal DTI + credit; lowest rate.
DSCR
20% down · 8.5% · 30yr
- Down + closing
- —
- Monthly P&I
- —
- Monthly cashflow
- —
- DSCR
- —
- Eligible?
- —
No personal income docs; deal must DSCR.
Hard money
10% down · 12.0% · 12mo
- Down + closing
- —
- Monthly P&I
- —
- Monthly cashflow
- —
- DSCR
- —
- Eligible?
- —
Short-term bridge; refi at stabilization.
Rent comps 1 comps
| Address | Beds | Baths | Sqft | Rent | $/sqft | DOM | Units | Dist |
|---|---|---|---|---|---|---|---|---|
| 716 Hazel Ave Ellwood City, PA | 3.0 | 1.5 | 1037 | $1,350 | $1.30 | 3d | 1 | 0.95mi |
Listing history 11 events
-
2026-06-19days on market $54,900 Active 15 DOM
-
2026-06-18days on market $54,900 Active 14 DOM
-
2026-06-17days on market $54,900 Active 13 DOM
-
2026-06-16days on market $54,900 Active 12 DOM
-
2026-06-15days on market $54,900 Active 11 DOM
-
2026-06-14days on market $54,900 Active 9 DOM
-
2026-06-12days on market $54,900 Active 8 DOM
-
2026-06-09days on market $54,900 Active 5 DOM
-
2026-06-08days on market $54,900 Active 4 DOM
-
2026-06-07remarks 681-char remark
-
2026-06-07$54,900 Active 3 DOM
ⓘ Source: listings_history table (triggers on properties + properties_extension) + one-shot
backfill from property_details.listing_events for pre-trigger history.
Climate risk First Street
- Flood 1/10 Low FEMA zone X (unshaded) · 0% chance over 30 yrs
- Wildfire 1/10 Low
- Heat 3/10 Moderate 7 d/yr ≥97°F today · 18 d/yr by 30 yrs out
- Wind 1/10 Low
- Air quality 3/10 Moderate 2 unhealthy d/yr today · 3 by 30 yrs out
Nearby sold comps map
Loading sold comps map…
Walkable amenities ~0.75 mi
Loading nearby amenities…
Taxation est. · year 1
- Rental income
- $16,200
- − Mortgage interest
- −$3,075
- − Property taxes
- −$824
- − Insurance
- −$274
- − Repairs & maintenance
- −$1,296
- − Management
- −$1,296
- − Depreciation
- −$1,597
- Taxable income
- $7,838
- Est. tax owed @ 24.0%
- −$1,881
- After-tax cash flow
- $6,364/yr
For passive investors: Depreciation is non-cash, so a rental often shows a tax loss while cash-flowing — sheltering income. Rental losses are passive: they offset passive income freely, and up to $25,000/yr can offset ordinary (W-2) income if you actively participate and your MAGI is under $100k (phasing out to $0 by $150k); unused losses carry forward. On sale, claimed depreciation is recaptured at up to 25%, and gains may owe capital-gains tax (a 1031 exchange can defer both). Figures are a year-1 estimate at your 24.0% rate — not tax advice; consult a CPA.
Schools (NCES district)
- District
- Ellwood City Area SD
- NCES district ID
- 4209240
- Math proficiency
- 28% ▼ -17.00%
- Reading proficiency
- 56% ▼ -14.00%
- Median HH income
- $44,230
- Composite
- 35.49/100
- National rank
- #4921
- State rank
- #334 of 539 in PA
Livability — Ellwood City
- Score
- 72/100
- State rank
- #610
- US rank
- #5866
Category grades
Schools grade is shown separately in the Schools card above.
Census & demographics
- Census place
- Ellwood City, PA
- Population (ZIP)
- 16,013
Population outlook (Lawrence County) Hauer SSP2
- Today (2025)
- 81,781 people
- By 2030
- 77,978 · -4.7%
- By 2040
- 69,522 · -15.0%
- By 2050
- 61,344 · -25.0%
- By 2075
- 45,027 · -44.9%
- By 2100
- 31,305 · -61.7%
Race, ethnicity, and origin ACS 2023
- Neighborhood character
- Predominantly White (95%)
- Race & ethnicity
- White 95% Two or more races 3% Hispanic / Latino 2%
- Common ancestry
- Romanian 6% Serbian 3% Lithuanian 2%
- Foreign-born
- 1%
- Languages at home
- 97% English-only · Spanish 2%
Political lean MEDSL · Lawrence
- 2024 margin
- Solid R (+33.8) · D 32.8% · R 66.5%
- 2008→2024 swing
- -28.7pp toward R · 2008: -5.1pp · 2024: -33.8pp
- All cycles
- 2024: R+33.8 2020: R+29.6 2016: R+28.1 2012: R+9.0 2008: R+5.1
Not yet ingested
- Civics
- —
Market trends
- HPI YoY
- ▼ -20.81%
- Current HPI
- 257.3336
- Rent YoY
- —
- Metro
- —
- State GDP YoY
- ▲ 1.68%
- F500 in state
- 34
Industry mix (Fortune 500 HQ in PA)
| Industry | F500 HQs | Revenue |
|---|---|---|
| Healthcare | 2 | $309B |
|
||
| Insurance | 2 | $27B |
|
||
| Telecommunications / Media | 1 | $124B |
|
||
| Industrial Distribution | 1 | $22B |
|
||
| Financial Services | 1 | $20B |
|
||
| Chemicals / Materials | 1 | $18B |
|
||
Price history
-57.7% since first listed16 events — show timeline
- 2026-06-04 Listed $54,900 West Penn MLS
- 2025-10-05 Pending — West Penn MLS
- 2025-09-24 Listed $64,900 West Penn MLS
- 2024-06-18 Delisted — West Penn MLS
- 2023-07-05 Relisted — West Penn MLS
- 2023-06-21 Contingent — West Penn MLS
- 2023-06-19 Listed $99,000 West Penn MLS
- 2023-06-14 Delisted — West Penn MLS
- 2023-06-06 Relisted — West Penn MLS
- 2023-04-18 Contingent — West Penn MLS
- 2023-03-08 Relisted — West Penn MLS
- 2023-03-08 Price Changed $99,000 West Penn MLS
- 2022-10-04 Price Changed $109,000 West Penn MLS
- 2022-07-26 Price Changed $115,000 West Penn MLS
- 2022-07-11 Price Changed $120,000 West Penn MLS
- 2022-06-15 Listed $129,900 West Penn MLS
Property tax history
+3.1%/yrLatest (2026): $2,922 · +10.8% YoY. Source: county tax records.
Cash-flow waterfall
monthlySold comps — $/sqft
last 12 mo · ≤1 miLoading sold comps…