 12-Plex
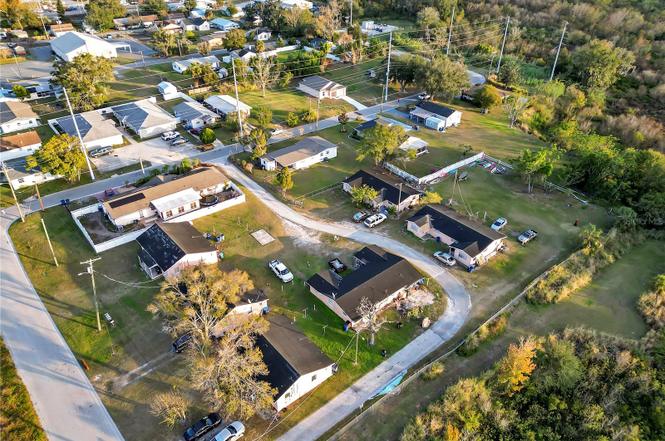
301 SW 3rd Ter · Mulberry, FL
Flood risk 1/10 · Minimal
- FEMA flood zone
- X (unshaded)
- Chance of flooding over 30 yrs
- 0.0%
- Est. flood insurance / yr
- $507 – $1,088
Fire risk 4/10 · Minor
- Est. fire insurance / yr
- $947 – $1,759
Heat risk 9/10 · Severe
- Hot days now (above 108°F)
- 7 days/yr
- Hot days in 30 yrs
- 25 days/yr
Wind risk 9/10 · Severe
- Chance of severe wind over 30 yrs
- 99.0%
Air-quality risk 2/10 · Minimal
- Unhealthy air days now
- 2 days/yr
- Unhealthy air days in 30 yrs
- 2 days/yr
Risk factors via First Street. Map © Google.
Why this score? — see what drove the B- grade
The composite is a weighted blend of 9 inputs, each scored 0–100. Each bar is that input's sub-score; the figure is the points it added to the 100-point composite (weight × sub-score).
- Cash flow +30.0/30.0
- DSCR +10.0/10.0
- 1% rule +8.5/10.0
- ARV discount +7.5/15.0
- Livability +3.7/5.0
- Schools +3.5/10.0
- Rent growth +2.9/5.0
- Condition / age +2.5/5.0
- Appreciation +0.0/10.0
$1,325,000
🖨 Deal sheet 📄 Offer letter ✓ Due diligence
Multi-family units
County records classify this as Multi-Family (5+ Unit). Listing-text estimate: 12 units. confirmed
5+ unit building — per-unit beds/baths from public records are typically unavailable; the breakdown below (if shown) is an estimate from the listing text.
Listing remarks MLS
Take a look at this income producing property. 12 total units /six buildings. This property includes a large extra lot with potential to add another property. Property is usually 100% occupied. There is room for increased rents . Call today
Key facts
- 12 units
- Own hvac
- 6 duplexes
Tags
Property features AI
Finance
- Other: Zoning: R-1; Has additional parcels; Universal property identifier available
- Financial info: Estimated annual market income approximately $147,000; Annual net income approximately $121,331; Tenant pays electricity, water and trash collection; Property includes 12 units across 6 buildings on 2 lots (about 0.79 acres)
Exterior
- Utilities: Public water; Public sewer; Electricity available
- Home design: Residential income property (Duplex); One story
- Construction: Block construction; Shingle roof; Slab foundation; Built as multiple buildings (6 total buildings)
- Exterior features: Other exterior features; Asphalt road access
Interior
- Heating & cooling: Central heating; Central air conditioning
- Interior features: Other interior features
- Laundry & utility: Washer hookup; Electric dryer hookup
Neighborhood map
What this means for you Summary
Snapshot
- This is a 12 × 3-bed/1.5-bath units multifamily listed at $1.32M.
Deal economics
- At list price, monthly cash flow is $5k ($65k/yr) — positive. Per door: $450/mo.
- The deal already cash-flows at list — no discount required.
- Meets the 1% rule at list price ($18k rent vs $1.32M).
- Recommended offer: $1.17M (12.0% below list) — sets the bar for market timing.
Location & tenants
- Location reads 73/100 on livability (#311 in FL) — a middle-class / working-renter tenant base. Strengths: cost of living A+, housing A+, health & safety A+; Watch: schools D, amenities F, commute F.
- Polk (suburban): math 39% / reading 43% proficiency, ranked #62 of 73 in FL (top 85%) — families likely to look elsewhere, expect single-tenant / working-renter base with shorter leases.
- Market conditions: Rents rising (+1.6%/yr); 180 active listings in the ZIP; 5 comparable units currently listed for rent nearby; rentals at typical pace (median 15d on market — plan ~3-4 weeks tenant-placement turnaround); 10,384 units permitted in Polk County in 2024 (1,716 in 5+ unit buildings).
- At $17,941/mo this rent would consume 328% of the median local household income ($66k/yr) (locally 583% of renters already pay >50% of income on rent) — very limited rent-growth headroom before tenants either downsize or default.
Forward outlook
- Local home prices are declining (-3.0%/yr); year-one equity from $9k of loan paydown is wiped out by about $40k of value loss. Plan a longer hold.
- Polk County population projected at +33% by 2050 — long-run rental-demand tailwind backs the buy-and-hold thesis.
- At projected returns (-3.0% appreciation + 1.6% rent growth), your $371k cash investment doubles in ~8 years — after that, you're playing with house money.
Negotiation context
- It's been on market 139 days — a 12% lower offer ($1.17M) is reasonable based on typical stale-listing flexibility.
- 7 sale attempts since 6y ago; this cycle's ask is 120355% above the opening price — seller raised mid-cycle; expect resistance to lowballs.
- Current owner paid $625k; list at $1.32M implies a 112% gain — meaningful room to come down on a strong offer.
Risks & watch-outs
- Watch-outs: built in 1950 — expect roof / HVAC / electrical / plumbing capex.
- Climate carrying-cost: severe wind risk, 99% chance of damaging wind over 30y; extreme-heat days projected 7→25/yr by 2055 (HVAC capex compounding) — expect insurance premiums to compound above CPI over the hold.
Questions for the listing agent
- It's been on market 139 days. Have you received any prior offers? Is the seller open to a 12% concession, seller financing, or rate buy-down credit?
- Can we see the unit-by-unit rent roll, current vacancy, and any below-market leases? What's the average tenancy length?
- What capital expenditures (roof, boiler, parking lot, exteriors) have been made in the last 5 years, and what's planned in the next 2?
- Built in 1950 — when were the roof, HVAC, electrical panel, plumbing, and water heater last replaced?
- Why hasn't it sold? Are there any deal-killer items the seller is aware of (foundation, flood, title, zoning, code violations)?
- Is there a deadline driving the sale (1031 exchange, divorce, estate, relocation)? That informs how much negotiation room exists.
- Schools are D-rated, which usually means shorter tenancies and higher turnover. Who's the typical renter profile here, and what's been the actual vacancy rate?
- What's the average days-on-market for RENTAL listings here right now (not sales)? A rising rental-DOM trend means longer vacancies and softer asking-rent achievability than the comps imply.
- What's the recent tenant-quality profile in this submarket — average credit score on applications, eviction rate, late-payment / NSF rate, and stable-employment percentage? A property-management company in the area should have these aggregated.
- How much new apartment / multifamily construction is in the pipeline within 1–3 miles? Heavy new supply (>2% of stock underway) typically softens rents 12–24 months out; light construction supports rent growth.
Investment metrics
- 1% rule
- 1.35% ✓
- Cap rate
- 11.19%
- Cash-on-cash
- 17.48%
- DSCR
- 1.78
- GRM
- 6.2
CMA / ARV
No comps found within radius.
Projected returns pro-forma
-3.0% appreciation · 1.59% rent growth · sell at horizon
- IRR
- 7.3%
- Equity multiple
- 1.28×
- Total profit
- $104,355
- Equity at exit
- $197,562
- IRR
- 15.4%
- Equity multiple
- 2.17×
- Total profit
- $434,008
- Equity at exit
- $114,562
Cash invested: $371,000 (down + closing). Projections, not guarantees.
Landlord ↔ Tenant lean methodology
- Overall (STATE)
- 87 Strongly Landlord-Friendly
- State Florida
- 87 Strongly Landlord-Friendly · R+3
- County
- — inherits STATE
- City
- — inherits STATE
ZIP-level market 33860
- Home prices YoY
- -22.4%
- Rents YoY
- 1.6%
- Active inventory
- 180
- Price-to-rent
- 73.9×
Monthly cashflow live
- Estimated rent
- $17,941 high interval (Pro) →
- Mortgage (P&I)
- −$6,948
- Tax from tax record
- −$1,270 /mo · $15,236/yr
- Insurance
- −$552
- HOA
- −$0
- Vacancy / Maint / Mgmt
- −$3,768
- Net cashflow
- $5,403
Break-even live
12-unit breakdown (identical units grouped — click to expand)
| Units | Beds | Baths | Est. rent |
|---|---|---|---|
| 12× units | 3 | 1.5 | $17,940 |
| #1 | 3 | 1.5 | $1,495 |
| #2 | 3 | 1.5 | $1,495 |
| #3 | 3 | 1.5 | $1,495 |
| #4 | 3 | 1.5 | $1,495 |
| #5 | 3 | 1.5 | $1,495 |
| #6 | 3 | 1.5 | $1,495 |
| #7 | 3 | 1.5 | $1,495 |
| #8 | 3 | 1.5 | $1,495 |
| #9 | 3 | 1.5 | $1,495 |
| #10 | 3 | 1.5 | $1,495 |
| #11 | 3 | 1.5 | $1,495 |
| #12 | 3 | 1.5 | $1,495 |
| Total (12 units) | $17,941 | ||
UW: 25.0% down · 7.5% · 30yr · 1.5% tax · 5.0% vac · 8.0% maint · 8.0% mgmt
Financing live
Cash to close
- Down payment
- $331,250
- Closing costs
- $39,750
- Reserves months
- —
- Total cash needed
- —
Loan-product check · same deal, 3 products live
Conventional
25% down · 7.5% · 30yr
- Down + closing
- —
- Monthly P&I
- —
- Monthly cashflow
- —
- DSCR
- —
- Eligible?
- —
Personal DTI + credit; lowest rate.
DSCR
20% down · 8.5% · 30yr
- Down + closing
- —
- Monthly P&I
- —
- Monthly cashflow
- —
- DSCR
- —
- Eligible?
- —
No personal income docs; deal must DSCR.
Hard money
10% down · 12.0% · 12mo
- Down + closing
- —
- Monthly P&I
- —
- Monthly cashflow
- —
- DSCR
- —
- Eligible?
- —
Short-term bridge; refi at stabilization.
Rent comps 5 comps
| Address | Beds | Baths | Sqft | Rent | $/sqft | DOM | Units | Dist |
|---|---|---|---|---|---|---|---|---|
| 301 SW 3rd Ter Mulberry, FL | 3.0 | 1.0 | 700 | $1,100 | $1.57 | 3d | 1 | 0.02mi |
| 181 Diesel Rd Mulberry, FL | 2.0 | 1.5 | 1300 | $1,375 | $1.06 | 23d | 1 | 0.29mi |
| 807 NW 1st Ave Mulberry, FL | 2.0 | 1.0 | 832 | $1,675 | $2.01 | 14d | 1 | 0.60mi |
| 609 NE 11th Ave Mulberry, FL | 3.0 | 2.0 | 1369 | $2,000 | $1.46 | 23d | 1 | 0.95mi |
| 177 Lakeview Dr Mulberry, FL | 1.0 | 1.5 | 864 | $1,100 | $1.27 | 14d | 1 | 1.48mi |
Listing history 31 events
-
2026-05-18price $1,325,000
-
2026-05-11price $1,350,000
-
2026-04-28price $1,199,999
-
2026-04-28price $1,999,999
-
2026-04-22price $1,250,000
-
2026-04-20price $1,275,000
-
2026-04-16price $1,300,000
-
2026-04-15price $1,375,000
-
2026-03-24price $1,399,999
-
2026-03-20price $1,409,999
-
2026-03-12price $1,499,999
-
2026-03-01price $1,599,999
-
2026-02-26$1,100
-
2026-02-25price $1,649,999
-
2026-01-05$1,700,000 Active
-
2024-09-30historical $1,100
-
2024-09-26price $1,100
-
2024-09-13price $1,150
-
2024-09-10historical $1,200
-
2024-09-10$1,200
-
2024-09-05$1,200
-
2024-09-05historical $1,200
-
2024-07-19$1,200
-
2020-12-11soldstatus $625,000
-
2020-11-26soldstatus $625,000 Sold 240-char remark
Show marketing remark (240 chars)
Take a look at this income producing property. 12 total units /six buildings. This property includes a large extra lot with potential to add another property. Property is usually 100% occupied. There is room for increased rents . Call today
-
2020-10-22status Pending 240-char remark
Show marketing remark (240 chars)
Take a look at this income producing property. 12 total units /six buildings. This property includes a large extra lot with potential to add another property. Property is usually 100% occupied. There is room for increased rents . Call today
-
2020-10-20status Active 240-char remark
Show marketing remark (240 chars)
Take a look at this income producing property. 12 total units /six buildings. This property includes a large extra lot with potential to add another property. Property is usually 100% occupied. There is room for increased rents . Call today
-
2020-10-14status Pending 240-char remark
Show marketing remark (240 chars)
Take a look at this income producing property. 12 total units /six buildings. This property includes a large extra lot with potential to add another property. Property is usually 100% occupied. There is room for increased rents . Call today
-
2020-10-01$650,000 Active 240-char remark
Show marketing remark (240 chars)
Take a look at this income producing property. 12 total units /six buildings. This property includes a large extra lot with potential to add another property. Property is usually 100% occupied. There is room for increased rents . Call today
-
2005-06-08soldstatus $405,000
-
2005-02-09soldstatus $192,000
ⓘ Source: listings_history table (triggers on properties + properties_extension) + one-shot
backfill from property_details.listing_events for pre-trigger history.
Tax reassessment forecast FL · Resets to sale price
- Current annual tax
- $15,236 · $1,270/mo
- Projected year-2 tax
- $15,236 · $1,270/mo
- Expected delta
- $0/yr ($0/mo · 0.0%)
ⓘ Screening estimate from a state-policy table — verify with the county assessor before closing.
Climate risk First Street
- Flood 1/10 Low FEMA zone X (unshaded) · 0% chance over 30 yrs
- Wildfire 4/10 Moderate
- Heat 9/10 Extreme 7 d/yr ≥108°F today · 25 d/yr by 30 yrs out
- Wind 9/10 Extreme 99% chance of damaging wind over 30 yrs
- Air quality 2/10 Low 2 unhealthy d/yr today · 2 by 30 yrs out
Nearby sold comps map
Loading sold comps map…
Walkable amenities ~0.75 mi
Loading nearby amenities…
Taxation est. · year 1
- Rental income
- $215,292
- − Mortgage interest
- −$74,221
- − Property taxes
- −$15,236
- − Insurance
- −$6,625
- − Repairs & maintenance
- −$17,223
- − Management
- −$17,223
- − Depreciation
- −$38,545
- Taxable income
- $46,218
- Est. tax owed @ 24.0%
- −$11,092
- After-tax cash flow
- $53,746/yr
For passive investors: Depreciation is non-cash, so a rental often shows a tax loss while cash-flowing — sheltering income. Rental losses are passive: they offset passive income freely, and up to $25,000/yr can offset ordinary (W-2) income if you actively participate and your MAGI is under $100k (phasing out to $0 by $150k); unused losses carry forward. On sale, claimed depreciation is recaptured at up to 25%, and gains may owe capital-gains tax (a 1031 exchange can defer both). Figures are a year-1 estimate at your 24.0% rate — not tax advice; consult a CPA.
Schools (NCES district)
- District
- Polk
- NCES district ID
- 1201590
- Math proficiency
- 39% ▼ -11.00%
- Reading proficiency
- 43% ▼ -4.00%
- Median HH income
- $43,979
- Composite
- 34.74/100
- National rank
- #5132
- State rank
- #62 of 73 in FL
Livability — Mulberry
- Score
- 73/100
- State rank
- #311
- US rank
- #5311
Category grades
Schools grade is shown separately in the Schools card above.
Census & demographics
- Census place
- Mulberry, FL
- County
- Polk County · 740,051 people
- City population
- 24,892
- Metro
- Lakeland-Winter Haven, FL
- Population (ZIP)
- 24,892
- Household income
- $65,710
- Rent vs Own
- Severe rent burden
- 583.0
Population outlook (Polk County) Hauer SSP2
- Today (2025)
- 752,975 people
- By 2030
- 804,621 · +6.9%
- By 2040
- 906,117 · +20.3%
- By 2050
- 1,000,476 · +32.9%
- By 2075
- 1,197,520 · +59.0%
- By 2100
- 1,271,518 · +68.9%
Race, ethnicity, and origin ACS 2023
- Neighborhood character
- Diverse neighborhood (Simpson 0.60)
- Race & ethnicity
- White 53% Hispanic / Latino 33% Two or more races 12% Black 10% Asian 1% Native American 1%
- Hispanic origin (detail)
- Mexican 19% Puerto Rican 7% Cuban 2%
- Common ancestry
- Lithuanian 2% Romanian 1% Slovak 1%
- Foreign-born
- 15% · Canada
- Languages at home
- 70% English-only · Spanish 28% Other Indo-European 1%
Political lean MEDSL · Polk
- 2024 margin
- Strong R (+20.7) · D 39.2% · R 59.9%
- 2008→2024 swing
- -14.6pp toward R · 2008: -6.1pp · 2024: -20.7pp
- All cycles
- 2024: R+20.7 2020: R+14.4 2016: R+14.1 2012: R+6.8 2008: R+6.1
Not yet ingested
- Civics
- —
Market trends
- HPI YoY
- ▼ -101.08%
- Current HPI
- 349.7266
- Rent YoY
- ▲ 1.59%
- Metro
- Lakeland-Winter Haven, FL
- State GDP YoY
- ▲ 3.28%
- F500 in state
- 36
Industry mix (Fortune 500 HQ in FL)
| Industry | F500 HQs | Revenue |
|---|---|---|
| Industrial Technology | 2 | $29B |
|
||
| Insurance | 2 | $17B |
|
||
| Retail | 1 | $60B |
|
||
| Technology Distribution | 1 | $58B |
|
||
| Homebuilding | 1 | $35B |
|
||
| Technology Manufacturing | 1 | $35B |
|
||
Price history
+590.1% since first listed31 events — show timeline
- 2026-05-18 Price Changed $1,325,000 Stellar MLS as Distributed by MLS Grid
- 2026-05-11 Price Changed $1,350,000 Stellar MLS as Distributed by MLS Grid
- 2026-04-28 Price Changed $1,199,999 Stellar MLS as Distributed by MLS Grid
- 2026-04-28 Price Changed $1,999,999 Stellar MLS as Distributed by MLS Grid
- 2026-04-22 Price Changed $1,250,000 Stellar MLS as Distributed by MLS Grid
- 2026-04-20 Price Changed $1,275,000 Stellar MLS as Distributed by MLS Grid
- 2026-04-16 Price Changed $1,300,000 Stellar MLS as Distributed by MLS Grid
- 2026-04-15 Price Changed $1,375,000 Stellar MLS as Distributed by MLS Grid
- 2026-03-24 Price Changed $1,399,999 Stellar MLS as Distributed by MLS Grid
- 2026-03-20 Price Changed $1,409,999 Stellar MLS as Distributed by MLS Grid
- 2026-03-12 Price Changed $1,499,999 Stellar MLS as Distributed by MLS Grid
- 2026-03-01 Price Changed $1,599,999 Stellar MLS as Distributed by MLS Grid
- 2026-02-26 Listed for Rent $1,100 APPFOLIO
- 2026-02-25 Price Changed $1,649,999 Stellar MLS as Distributed by MLS Grid
- 2026-01-05 Listed $1,700,000 Stellar MLS as Distributed by MLS Grid
- 2024-09-30 Rental Removed $1,100 APPFOLIO
- 2024-09-26 Price Changed $1,100 APPFOLIO
- 2024-09-13 Price Changed $1,150 APPFOLIO
- 2024-09-10 Rental Removed $1,200 RENTALBEAST
- 2024-09-10 Listed for Rent $1,200 APPFOLIO
- 2024-09-05 Listed for Rent $1,200 RENTALBEAST
- 2024-09-05 Rental Removed $1,200 RENTEC
- 2024-07-19 Listed for Rent $1,200 RENTEC
- 2020-12-11 Sold (Public Records) $625,000 Public Records
- 2020-11-26 Sold (MLS) $625,000 Stellar MLS as Distributed by MLS Grid
- 2020-10-22 Pending — Stellar MLS as Distributed by MLS Grid
- 2020-10-20 Relisted — Stellar MLS as Distributed by MLS Grid
- 2020-10-14 Pending — Stellar MLS as Distributed by MLS Grid
- 2020-10-01 Listed $650,000 Stellar MLS as Distributed by MLS Grid
- 2005-06-08 Sold (Public Records) $405,000 Public Records
- 2005-02-09 Sold (Public Records) $192,000 Public Records
Property tax history
+11.2%/yrLatest (2025): $15,236 · +22.8% YoY. Source: county tax records.
Cash-flow waterfall
monthlySold comps — $/sqft
last 12 mo · ≤1 miLoading sold comps…