362 Saint Johns Rd · Cedar Creek, TX
Flood risk 1/10 · Minimal
- FEMA flood zone
- X (unshaded)
- Chance of flooding over 30 yrs
- 0.0%
- Est. flood insurance / yr
- $507 – $1,088
Fire risk 5/10 · Moderate
- Est. fire insurance / yr
- $1,222 – $2,270
Heat risk 8/10 · Major
- Hot days now (above 108°F)
- 6 days/yr
- Hot days in 30 yrs
- 19 days/yr
Wind risk 8/10 · Major
- Chance of severe wind over 30 yrs
- 80.0%
Air-quality risk 1/10 · Minimal
- Unhealthy air days now
- 0 days/yr
- Unhealthy air days in 30 yrs
- 0 days/yr
Risk factors via First Street. Map © Google.
Why this score? — see what drove the D grade
The composite is a weighted blend of 9 inputs, each scored 0–100. Each bar is that input's sub-score; the figure is the points it added to the 100-point composite (weight × sub-score).
- Appreciation +10.0/10.0
- Cash flow +9.9/30.0
- ARV discount +7.5/15.0
- DSCR +2.8/10.0
- Rent growth +2.5/5.0
- Livability +2.5/5.0
- Condition / age +2.5/5.0
- Schools +2.4/10.0
- 1% rule +1.9/10.0
$275,000
🖨 Deal sheet (PDF) 📄 Offer letter ✓ Due diligence
Listing remarks MLS
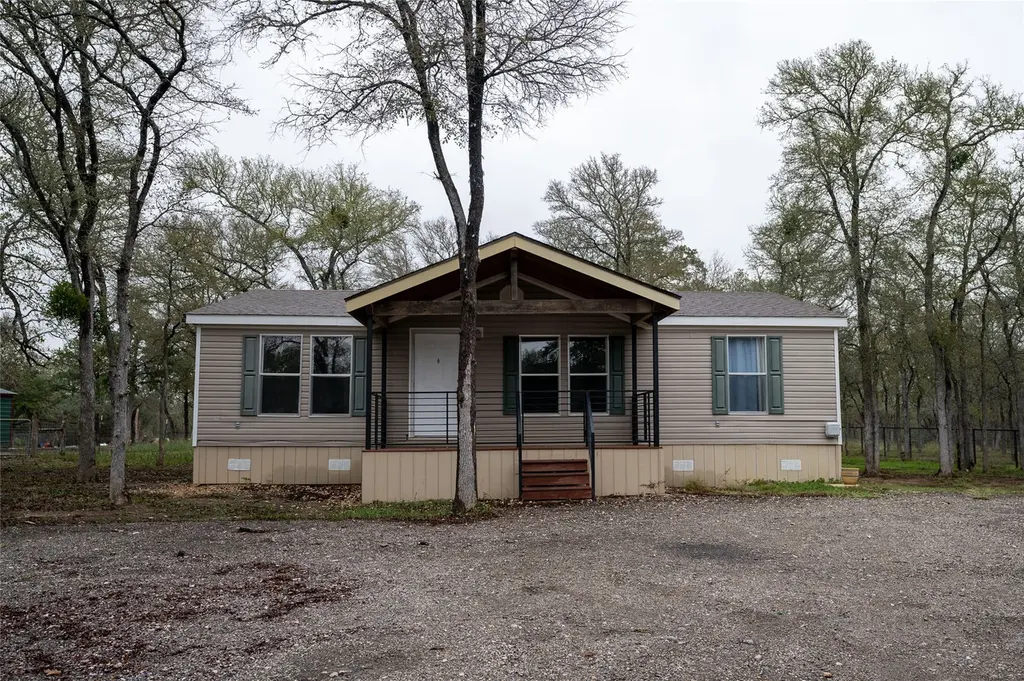
1.17 acre lot with a 2012 built 3 bedroom, 2 bath DWMH. Full length covered back porch with wrought iron railing. Nice scattered trees, fenced perimeter, located in northeastern Caldwell County. The primary suite has a double vanity, separate shower and garden tub. Vinyl plank floors throughout, no carpet. Lockhart ISD, easy access to FM 812. Approximately 30-35 min drive to ABIA & TESLA.
Key facts
- Fenced perimeter
- Double vanity
- Separate shower
Tags
Neighborhood map
What this means for you Summary
Snapshot
- This is a 3-bed/2.0-bath other listed at $275k.
Deal economics
- At list price, monthly cash flow is $-169 ($-2k/yr) — negative.
- To cash-flow at today's rent, offer at most $245k (10.8% below list).
- To meet the 1% rule (rent ≥ 1% of price), the offer needs to be $190k (30.9% below list).
- Recommended offer: $190k (30.9% below list) — sets the bar for 1% rule.
- Cap rate 5.6% vs local median 2.2% in Cedar Creek — top-decile yield for the area; either an underpriced asset or a hidden risk that comps aren't pricing in. Stress-test before assuming the spread holds.
Location & tenants
- Location reads: area grade D — affects rentability + tenant quality, not the cash-flow math above.
- Lockhart ISD (town): math 27% / reading 29% proficiency, ranked #657 of 826 in TX (top 80%) — low school quality limits family demand, transient renter base, plan for 1-2y turnover; 62% free/reduced lunch — lower-income household profile, screen leases tightly.
- Zoned schools: Navarro El (math 27% / reading 30%, grade F, #2,706 of 4,322 statewide, top 63%, 580 students, 72% FRL); Lockhart J H (math 22% / reading 26%, grade F, #1,301 of 1,662 statewide, top 79%, 1,433 students, 74% FRL); Lockhart H S (math 21% / reading 33%, grade F, #1,204 of 1,632 statewide, top 75%, 1,968 students, 69% FRL).
- Market conditions: 202 active listings in the ZIP; 529 units permitted in Caldwell County in 2024 (6 in 5+ unit buildings).
Forward outlook
- In year one you build about $29k of equity ($2k loan paydown + $28k appreciation (10.0% local appreciation)).
- Caldwell County population projected at +33% by 2050 — long-run rental-demand tailwind backs the buy-and-hold thesis.
- By year 2, paydown + projected appreciation supports a ~$47k cash-out refi (75% LTV) — recoverable capital for the next deal without selling this one.
Negotiation context
- It's been on market 159 days — a 12% lower offer ($242k) is reasonable based on typical stale-listing flexibility.
Risks & watch-outs
- Climate carrying-cost: severe wind risk, 80% chance of damaging wind over 30y; moderate wildfire risk; extreme-heat days projected 6→19/yr by 2055 (HVAC capex compounding) — expect insurance premiums to compound above CPI over the hold.
Questions for the listing agent
- What do current leases actually rent for vs. the listed asking? Can we see a recent rent roll and the last 12 months of T-12 income?
- It's been on market 159 days. Have you received any prior offers? Is the seller open to a 31% concession, seller financing, or rate buy-down credit?
- Why hasn't it sold? Are there any deal-killer items the seller is aware of (foundation, flood, title, zoning, code violations)?
- Is there a deadline driving the sale (1031 exchange, divorce, estate, relocation)? That informs how much negotiation room exists.
- The area grade is low — what's the realistic commute time and amenity access for the typical tenant pool here? Any planned neighborhood developments (good or bad) we should know about?
- What's the average days-on-market for RENTAL listings here right now (not sales)? A rising rental-DOM trend means longer vacancies and softer asking-rent achievability than the comps imply.
- What's the recent tenant-quality profile in this submarket — average credit score on applications, eviction rate, late-payment / NSF rate, and stable-employment percentage? A property-management company in the area should have these aggregated.
- How much new for-sale + rental construction is in the pipeline within 1–3 miles? Heavy new supply typically softens prices + rents 12–24 months out; constrained supply supports both.
Investment metrics
- 1% rule
- 0.69% ✗
- Cap rate
- 5.56%
- Cash-on-cash
- -2.63%
- DSCR
- 0.88
- GRM
- 12.1
CMA / ARV
- ARV (median comp)
- $597,174
- List price
- $275,000
- Delta
- -53.95%
- Verdict
- UNDERPRICED
- Comps
- 2 within 2.0 mi
Projected returns pro-forma
10.0% appreciation · 3.0% rent growth · sell at horizon
- IRR
- 22.4%
- Equity multiple
- 2.80×
- Total profit
- $138,904
- Equity at exit
- $247,742
- IRR
- 20.1%
- Equity multiple
- 6.42×
- Total profit
- $417,285
- Equity at exit
- $534,265
Cash invested: $77,000 (down + closing). Projections, not guarantees.
Landlord ↔ Tenant lean methodology
- Overall (STATE)
- 87 Strongly Landlord-Friendly
- State Texas
- 87 Strongly Landlord-Friendly · R+5
- County
- — inherits STATE
- City
- — inherits STATE
ZIP-level market 78616
- Home prices YoY
- 4.8%
- Active inventory
- 202
- Price-to-rent
- 12.1×
Monthly cashflow live
- Estimated rent
- $1,902 medium interval (Pro) →
- Mortgage (P&I)
- −$1,442
- Tax from tax record
- −$114 /mo · $1,373/yr
- Insurance
- −$115
- HOA
- −$0
- Vacancy / Maint / Mgmt
- −$399
- Net cashflow
- $-169
Break-even live
Sensitivity live
| Price | -10% $-13 | -5% $-91 | +0% $-169 | +5% $-247 | +10% $-325 |
|---|---|---|---|---|---|
| Rent | -10% $-319 | -5% $-244 | +0% $-169 | +5% $-94 | +10% $-19 |
| Rate | -1.0pp $-30 | -0.5pp $-99 | base $-169 | +0.5pp $-240 | +1.0pp $-313 |
UW: 25.0% down · 7.5% · 30yr · 1.5% tax · 5.0% vac · 8.0% maint · 8.0% mgmt
Financing live
Cash to close
- Down payment
- $68,750
- Closing costs
- $8,250
- Reserves months
- —
- Total cash needed
- —
Loan-product check · same deal, 3 products live
Conventional
25% down · 7.5% · 30yr
- Down + closing
- —
- Monthly P&I
- —
- Monthly cashflow
- —
- DSCR
- —
- Eligible?
- —
Personal DTI + credit; lowest rate.
DSCR
20% down · 8.5% · 30yr
- Down + closing
- —
- Monthly P&I
- —
- Monthly cashflow
- —
- DSCR
- —
- Eligible?
- —
No personal income docs; deal must DSCR.
Hard money
10% down · 12.0% · 12mo
- Down + closing
- —
- Monthly P&I
- —
- Monthly cashflow
- —
- DSCR
- —
- Eligible?
- —
Short-term bridge; refi at stabilization.
Listing history 16 events
-
2026-06-21days on market $275,000 Active 159 DOM
-
2026-06-18days on market $275,000 Active 156 DOM
-
2026-06-17days on market $275,000 Active 155 DOM
-
2026-06-16days on market $275,000 Active 154 DOM
-
2026-06-15days on market $275,000 Active 153 DOM
-
2026-06-13days on market $275,000 Active 151 DOM
-
2026-06-09days on market $275,000 Active 147 DOM
-
2026-06-08days on market $275,000 Active 146 DOM
-
2026-06-07days on market $275,000 Active 145 DOM
-
2026-06-04days on market $275,000 Active 142 DOM
-
2026-06-03days on market $275,000 Active 141 DOM
-
2026-06-02days on market $275,000 Active 140 DOM
-
2026-06-01days on market $275,000 Active 139 DOM
-
2026-05-31days on market $275,000 Active 138 DOM
-
2026-05-19price $275,000 397-char remark
Show marketing remark (397 chars)
1.17 acre lot with a 2012 built 3 bedroom, 2 bath DWMH. Full length covered back porch with wrought iron railing. Nice scattered trees, fenced perimeter, located in northeastern Caldwell County. The primary suite has a double vanity, separate shower and garden tub. Vinyl plank floors throughout, no carpet. Lockhart ISD, easy access to FM 812. Approximately 30-35 min drive to ABIA & TESLA.
-
2025-12-08$300,000 Active 397-char remark
Show marketing remark (397 chars)
1.17 acre lot with a 2012 built 3 bedroom, 2 bath DWMH. Full length covered back porch with wrought iron railing. Nice scattered trees, fenced perimeter, located in northeastern Caldwell County. The primary suite has a double vanity, separate shower and garden tub. Vinyl plank floors throughout, no carpet. Lockhart ISD, easy access to FM 812. Approximately 30-35 min drive to ABIA & TESLA.
ⓘ Source: listings_history table (triggers on properties + properties_extension) + one-shot
backfill from property_details.listing_events for pre-trigger history.
Tax reassessment forecast TX · Resets to sale price
- Current annual tax
- $1,373 · $114/mo
- Projected year-2 tax
- $5,032 · $419/mo
- Expected delta
- +$3,660/yr (+$305/mo · 266.6%)
ⓘ Screening estimate from a state-policy table — verify with the county assessor before closing.
Climate risk First Street
- Flood 1/10 Low FEMA zone X (unshaded) · 0% chance over 30 yrs
- Wildfire 5/10 Major
- Heat 8/10 Severe 6 d/yr ≥108°F today · 19 d/yr by 30 yrs out
- Wind 8/10 Severe 80% chance of damaging wind over 30 yrs
- Air quality 1/10 Low 0 unhealthy d/yr today · 0 by 30 yrs out
Nearby sold comps map
Loading sold comps map…
Walkable amenities ~0.75 mi
Loading nearby amenities…
Taxation est. · year 1
- Rental income
- $22,819
- − Mortgage interest
- −$15,404
- − Property taxes
- −$1,373
- − Insurance
- −$1,375
- − Repairs & maintenance
- −$1,825
- − Management
- −$1,825
- − Depreciation
- −$8,000
- Taxable loss
- −$6,984
- Est. tax savings @ 24.0%
- +$1,676
- After-tax cash flow
- $-350/yr
For passive investors: Depreciation is non-cash, so a rental often shows a tax loss while cash-flowing — sheltering income. Rental losses are passive: they offset passive income freely, and up to $25,000/yr can offset ordinary (W-2) income if you actively participate and your MAGI is under $100k (phasing out to $0 by $150k); unused losses carry forward. On sale, claimed depreciation is recaptured at up to 25%, and gains may owe capital-gains tax (a 1031 exchange can defer both). Figures are a year-1 estimate at your 24.0% rate — not tax advice; consult a CPA.
Schools (NCES district)
- District
- Lockhart ISD
- NCES district ID
- 4827870
- Math proficiency
- 27% ▼ -12.00%
- Reading proficiency
- 29% ▼ -2.00%
- Median HH income
- $48,868
- Composite
- 24.44/100
- National rank
- #7674
- State rank
- #657 of 826 in TX
Livability — Cedar Creek
No livability data for this city. (Only ~50 U.S. cities are tracked.)
Census & demographics
- City population
- 19,830
- Population (ZIP)
- 10,008
Population outlook (Caldwell County) Hauer SSP2
- Today (2025)
- 46,557 people
- By 2030
- 49,673 · +6.7%
- By 2040
- 55,827 · +19.9%
- By 2050
- 61,832 · +32.8%
- By 2075
- 77,212 · +65.8%
- By 2100
- 89,225 · +91.6%
Race, ethnicity, and origin ACS 2023
- Neighborhood character
- Predominantly Hispanic (77%)
- Race & ethnicity
- Hispanic / Latino 77% Two or more races 48% White 17% Native American 2% Black 1%
- Hispanic origin (detail)
- Mexican 72%
- Common ancestry
- Iranian 1% Romanian 1% Lithuanian 1%
- Foreign-born
- 24% · Canada
- Languages at home
- 48% English-only · Spanish 51% German/W. Germanic 1%
Political lean MEDSL · Caldwell
- 2024 margin
- R (+14.4) · D 42.2% · R 56.6% · Other 1.2%
- 2008→2024 swing
- -8.4pp toward R · 2008: -6.0pp · 2024: -14.4pp
- All cycles
- 2024: R+14.4 2020: R+9.1 2016: R+15.8 2012: R+11.1 2008: R+6.0
Not yet ingested
- Civics
- —
Market trends
- HPI YoY
- ▲ 14.00%
- Current HPI
- 308.45
- Rent YoY
- —
- Metro
- —
- State GDP YoY
- ▲ 3.95%
- F500 in state
- 110
Industry mix (Fortune 500 HQ in TX)
| Industry | F500 HQs | Revenue |
|---|---|---|
| Energy | 16 | $1,198B |
|
||
| Technology | 5 | $198B |
|
||
| Engineering / Construction | 4 | $72B |
|
||
| Energy Services | 3 | $60B |
|
||
| Utilities | 3 | $41B |
|
||
| Healthcare | 2 | $330B |
|
||
Price history
-8.3% since first listed2 events — show timeline
- 2026-05-19 Price Changed $275,000 Unlock MLS
- 2025-12-08 Listed $300,000 Unlock MLS
Property tax history
+9.8%/yrLatest (2025): $1,373 · -8.9% YoY. Source: county tax records.
Cash-flow waterfall
monthlySold comps — $/sqft
last 12 mo · ≤1 miLoading sold comps…