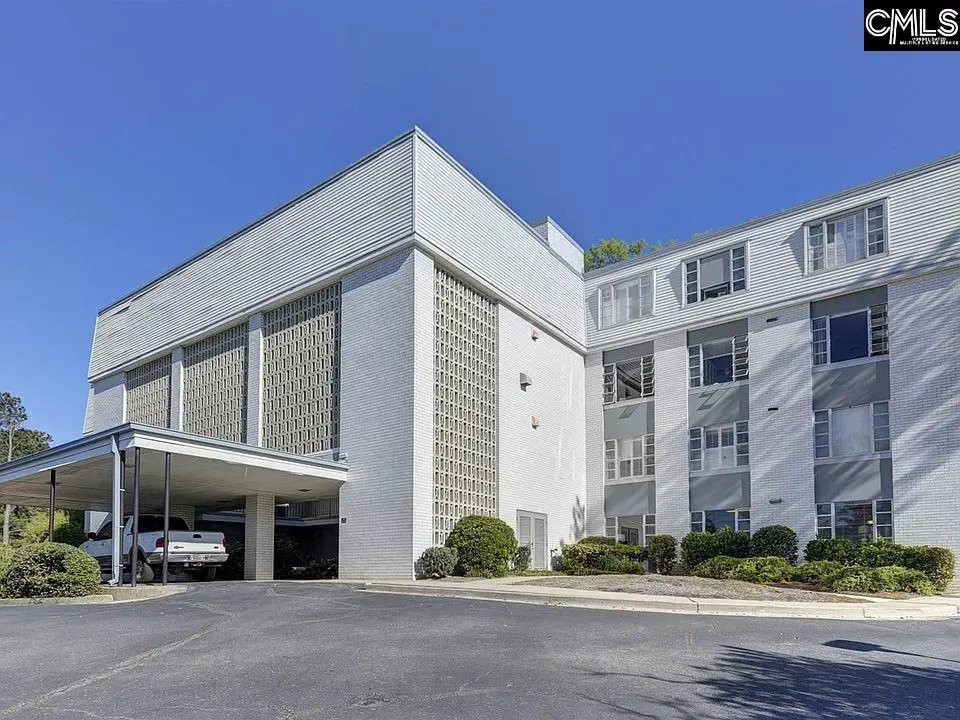
1718 Madison Rd #20 · Forest Acres, SC
Flood risk 1/10 · Minimal
- FEMA flood zone
- X (unshaded)
- Chance of flooding over 30 yrs
- 0.0%
- Est. flood insurance / yr
- $473 – $860
Fire risk 1/10 · Minimal
- Est. fire insurance / yr
- $783 – $1,453
Heat risk 7/10 · Major
- Hot days now (above 109°F)
- 7 days/yr
- Hot days in 30 yrs
- 16 days/yr
Wind risk 6/10 · Moderate
- Chance of severe wind over 30 yrs
- 68.0%
Air-quality risk 3/10 · Minor
- Unhealthy air days now
- 2 days/yr
- Unhealthy air days in 30 yrs
- 2 days/yr
Risk factors via First Street. Map © Google.
Why this score? — see what drove the F grade
The composite is a weighted blend of 9 inputs, each scored 0–100. Each bar is that input's sub-score; the figure is the points it added to the 100-point composite (weight × sub-score).
- ARV discount +7.5/15.0
- 1% rule +4.3/10.0
- Cash flow +3.9/30.0
- Rent growth +3.7/5.0
- Livability +3.7/5.0
- Schools +2.6/10.0
- Condition / age +2.5/5.0
- DSCR +0.0/10.0
- Appreciation +0.0/10.0
$175,000
🖨 Deal sheet (PDF) 📄 Offer letter ✓ Due diligence
Listing remarks
PENDING - STILL SHOWING / ACCEPTING BACK OFFERS- Elegant 2-Bedroom Condo with Timeless Character | The Madison, Forest Acres. Welcome to The Madison — one of Forest Acres' most sought-after addresses. This beautifully maintained 2-bedroom condo blends classic charm with a spacious, thoughtful layout. Minutes from Trader Joe's, Trenholm Plaza, and downtown Main Street. This condo is also walking distance to the new $100mm redevelopment of Richland Mall, spanning 25.5 acres, featuring a vibrant mix of retail shops, restaurants, a dog park and Columbia's newest concert venue. Best of all, the HOA at the Madison covers electricity, water, sewer, basic cable, and exterior maintenance &mdas
Key facts
- Community pool
- Spacious layout
- 2 parking spots
Tags
Neighborhood map
What this means for you Summary
Snapshot
- This is a 3-bed/2.0-bath condo listed at $175k.
Deal economics
- At list price, monthly cash flow is $-500 ($-6k/yr) — negative.
- The deal already cash-flows at list — no discount required.
- To meet the 1% rule (rent ≥ 1% of price), the offer needs to be $162k (7.5% below list).
- Recommended offer: $162k (7.5% below list) — sets the bar for 1% rule.
Location & tenants
- Location reads 73/100 on livability (#39 in SC) — a middle-class / working-renter tenant base. Strengths: housing A+, cost of living A, employment A-; Watch: crime D, amenities F, commute F.
- Richland 01 (urban): math 26% / reading 36% proficiency, ranked #54 of 80 in SC (top 68%) — families likely to look elsewhere, expect single-tenant / working-renter base with shorter leases; 64% free/reduced lunch — lower-income household profile, screen leases tightly.
- Zoned schools: Bradley Elementary (math 22% / reading 32%, grade F, #421 of 597 statewide, top 73%, 437 students, 100% FRL); A. C. Flora High (math 42% / reading 92%, grade B, #73 of 196 statewide, top 41%, 1,352 students, 100% FRL) — zoned schools average 100% FRL vs 64% district-wide (36 pts higher); higher-poverty schools than district average — tighter screening recommended.
- Zoned-school proficiency averages 47% at this address vs 31% district-wide (+16 pts) — the actual schools serving this property are materially stronger than the Richland 01 average implies; a family-tenant draw the district grade alone would hide.
- Market conditions: Rents rising fast (+4.8%/yr); 115 active listings in the ZIP; 13 comparable units currently listed for rent nearby; rentals at typical pace (median 25d on market — plan ~3-4 weeks tenant-placement turnaround); solid renter incomes; 3,472 units permitted in Richland County in 2024 (1,096 in 5+ unit buildings).
Forward outlook
- Local home prices are declining (-3.0%/yr); year-one equity from $1k of loan paydown is wiped out by about $5k of value loss. Plan a longer hold.
- Richland County population projected at +30% by 2050 — long-run rental-demand tailwind backs the buy-and-hold thesis.
Negotiation context
- Only 5 days on market — expect competitive offers; lowballing is unlikely to land.
- Current owner paid $60k; list at $175k implies a 192% gain — meaningful room to come down on a strong offer.
Risks & watch-outs
- Watch-outs: HOA is 46% of rent.
- Climate carrying-cost: major wind risk, 68% chance of damaging wind over 30y; extreme-heat days projected 7→16/yr by 2055 (HVAC capex compounding) — expect insurance premiums to compound above CPI over the hold.
Questions for the listing agent
- What do current leases actually rent for vs. the listed asking? Can we see a recent rent roll and the last 12 months of T-12 income?
- Built in 1963 — when were the roof, HVAC, electrical panel, plumbing, and water heater last replaced?
- What does the HOA fee cover, when was the last increase, and are there any pending special assessments or reserve-fund shortfalls?
- Any open or pending special assessments — roof, HVAC, plumbing, elevator, façade? What's the per-unit balance and payoff schedule, and is the seller paying it off at close or rolling it to the buyer?
- Is there a deadline driving the sale (1031 exchange, divorce, estate, relocation)? That informs how much negotiation room exists.
- Schools are A-rated — typically a magnet for longer-tenancy family renters. What's the average tenant stay here, and is there a school-zone premium baked into asking?
- Crime grade is D in this area — have there been break-ins, vandalism, or insurance claims at this property in the last 3 years? What carrier currently insures it and at what premium?
- The area grade is low — what's the realistic commute time and amenity access for the typical tenant pool here? Any planned neighborhood developments (good or bad) we should know about?
- What's the average days-on-market for RENTAL listings here right now (not sales)? A rising rental-DOM trend means longer vacancies and softer asking-rent achievability than the comps imply.
- What's the recent tenant-quality profile in this submarket — average credit score on applications, eviction rate, late-payment / NSF rate, and stable-employment percentage? A property-management company in the area should have these aggregated.
- How much new apartment / multifamily construction is in the pipeline within 1–3 miles? Heavy new supply (>2% of stock underway) typically softens rents 12–24 months out; light construction supports rent growth.
Investment metrics
- 1% rule
- 0.93% ✗
- Cap rate
- 2.87%
- Cash-on-cash
- -12.23%
- DSCR
- 0.46
- GRM
- 9.0
CMA / ARV
No comps found within radius.
Projected returns pro-forma
-3.0% appreciation · 4.8% rent growth · sell at horizon
- IRR
- -35.2%
- Equity multiple
- -0.16×
- Total profit
- $-56,817
- Equity at exit
- $26,093
- IRR
- -30.4%
- Equity multiple
- -0.56×
- Total profit
- $-76,217
- Equity at exit
- $15,131
Cash invested: $49,000 (down + closing). Projections, not guarantees.
Landlord ↔ Tenant lean methodology
- Overall (STATE)
- 90 Strongly Landlord-Friendly
- State South Carolina
- 90 Strongly Landlord-Friendly · R+6
- County
- — inherits STATE
- City
- — inherits STATE
ZIP-level market 29206
- Rents YoY
- 4.8%
- Active inventory
- 115
- Price-to-rent
- 9.0×
Monthly cashflow live
- Estimated rent
- $1,619 high interval (Pro) →
- Mortgage (P&I)
- −$918
- Tax from tax record
- −$51 /mo · $616/yr
- Insurance
- −$73
- HOA est. from 1 same-building comp
- −$737
- Vacancy / Maint / Mgmt
- −$340
- Net cashflow
- $-500
Break-even live
Sensitivity live
| Price | -10% $-401 | -5% $-450 | +0% $-500 | +5% $-549 | +10% $-599 |
|---|---|---|---|---|---|
| Rent | -10% $-628 | -5% $-564 | +0% $-500 | +5% $-436 | +10% $-372 |
| Rate | -1.0pp $-411 | -0.5pp $-455 | base $-500 | +0.5pp $-545 | +1.0pp $-591 |
UW: 25.0% down · 7.5% · 30yr · 1.5% tax · 5.0% vac · 8.0% maint · 8.0% mgmt
Financing live
Cash to close
- Down payment
- $43,750
- Closing costs
- $5,250
- Reserves months
- —
- Total cash needed
- —
Loan-product check · same deal, 3 products live
Conventional
25% down · 7.5% · 30yr
- Down + closing
- —
- Monthly P&I
- —
- Monthly cashflow
- —
- DSCR
- —
- Eligible?
- —
Personal DTI + credit; lowest rate.
DSCR
20% down · 8.5% · 30yr
- Down + closing
- —
- Monthly P&I
- —
- Monthly cashflow
- —
- DSCR
- —
- Eligible?
- —
No personal income docs; deal must DSCR.
Hard money
10% down · 12.0% · 12mo
- Down + closing
- —
- Monthly P&I
- —
- Monthly cashflow
- —
- DSCR
- —
- Eligible?
- —
Short-term bridge; refi at stabilization.
Rent comps 13 comps
| Address | Beds | Baths | Sqft | Rent | $/sqft | DOM | Units | Dist |
|---|---|---|---|---|---|---|---|---|
| 1800 Cherry Laurel Dr Unit 18005 Columbia, SC | 2.0 | 1.0 | 960 | $895 | $0.93 | 24d | 1 | 0.32mi |
| 1821 Atascadero Dr Columbia, SC | 3.0 | 2.0 | 1520 | $2,000 | $1.32 | 24d | 1 | 0.36mi |
| 2050 N Beltline Blvd Columbia, SC | 1.0–2.0 | 1.0–1.5 | 831 | $1,042 | $1.25 | 15d | 6 | 0.45mi |
| 151 Renaissance Way Columbia, SC | 3.0 | 2.0 | 1200 | $1,400 | $1.17 | 24d | 1 | 0.57mi |
| 4215 Bethel Church Rd Columbia, SC | 1.0–3.0 | 1.0–2.0 | 962 | $1,395 | $1.45 | 24d | 1 | 0.69mi |
| 3431 Covenant Rd Columbia, SC | 1.0–3.0 | 1.0–1.5 | 950 | $1,100 | $1.16 | 24d | 1 | 0.69mi |
| 4214 Bethel Church Rd Columbia, SC | 2.0–3.0 | 1.0–2.0 | 1068 | $1,429 | $1.34 | 12d | 9 | 0.77mi |
| 3040 Girardeau Ave Columbia, SC | 3.0 | 1.5 | 1400 | $2,150 | $1.54 | 15d | 1 | 0.82mi |
| 3040 Girardeau Ave Columbia, SC | 3.0 | 1.5 | 1400 | $2,150 | $1.54 | 24d | 1 | 0.82mi |
| 3117 Quitman St Columbia, SC | 3.0 | 2.0 | 1500 | $1,750 | $1.17 | 24d | 1 | 0.87mi |
| 4443 Bethel Church Rd #27 Columbia, SC | 3.0 | 2.5 | 1660 | $1,645 | $0.99 | 24d | 1 | 0.91mi |
| 2834 Keats St Columbia, SC | 3.0 | 2.0 | 921 | $2,250 | $2.44 | 15d | 1 | 1.03mi |
| 3111 Kline St Columbia, SC | 2.0 | 2.0 | 950 | $1,850 | $1.95 | 24d | 1 | 1.49mi |
HOA detail condo
- Monthly dues
- $0 · $0/yr
- Likely covers
- watersewerelectriccableexterior maint.
- Assessments
- None detected in remarks — confirm with the listing agent.
Listing history 5 events
-
2026-03-24status Pending
-
2026-03-19$175,000 Active
-
2015-03-04soldstatus $59,900
-
1996-06-28soldstatus $85,000
-
1985-06-01soldstatus $72,000
ⓘ Source: listings_history table (triggers on properties + properties_extension) + one-shot
backfill from property_details.listing_events for pre-trigger history.
Tax reassessment forecast SC · Resets to sale price
- Current annual tax
- $616 · $51/mo
- Projected year-2 tax
- $998 · $83/mo
- Expected delta
- +$382/yr (+$32/mo · 61.9%)
ⓘ Screening estimate from a state-policy table — verify with the county assessor before closing.
Climate risk First Street
- Flood 1/10 Low FEMA zone X (unshaded) · 0% chance over 30 yrs
- Wildfire 1/10 Low
- Heat 7/10 Severe 7 d/yr ≥109°F today · 16 d/yr by 30 yrs out
- Wind 6/10 Major 68% chance of damaging wind over 30 yrs
- Air quality 3/10 Moderate 2 unhealthy d/yr today · 2 by 30 yrs out
Nearby sold comps map
Loading sold comps map…
Walkable amenities ~0.75 mi
Loading nearby amenities…
Taxation est. · year 1
- Rental income
- $19,434
- − Mortgage interest
- −$9,803
- − Property taxes
- −$616
- − Insurance
- −$875
- − Repairs & maintenance
- −$1,555
- − Management
- −$1,555
- − HOA
- −$8,844
- − Depreciation
- −$5,091
- Taxable loss
- −$8,904
- Est. tax savings @ 24.0%
- +$2,137
- After-tax cash flow
- $-3,858/yr
For passive investors: Depreciation is non-cash, so a rental often shows a tax loss while cash-flowing — sheltering income. Rental losses are passive: they offset passive income freely, and up to $25,000/yr can offset ordinary (W-2) income if you actively participate and your MAGI is under $100k (phasing out to $0 by $150k); unused losses carry forward. On sale, claimed depreciation is recaptured at up to 25%, and gains may owe capital-gains tax (a 1031 exchange can defer both). Figures are a year-1 estimate at your 24.0% rate — not tax advice; consult a CPA.
Schools (NCES district)
- District
- Richland 01
- NCES district ID
- 4503360
- Math proficiency
- 26% ▼ -7.00%
- Reading proficiency
- 36% ▼ -5.00%
- Median HH income
- $38,931
- Composite
- 25.94/100
- National rank
- #7335
- State rank
- #54 of 80 in SC
Livability — Forest Acres
- Score
- 73/100
- State rank
- #39
- US rank
- #5064
Category grades
Schools grade is shown separately in the Schools card above.
Census & demographics
- Census place
- Forest Acres, SC
- County
- Richland County · 389,530 people
- City population
- 20,054
- Metro
- Columbia, SC
- Population (ZIP)
- 19,759
- Household income
- $91,847
- Rent vs Own
- Severe rent burden
- 697.0
Population outlook (Richland County) Hauer SSP2
- Today (2025)
- 459,667 people
- By 2030
- 487,524 · +6.1%
- By 2040
- 542,035 · +17.9%
- By 2050
- 595,371 · +29.5%
- By 2075
- 732,998 · +59.5%
- By 2100
- 820,415 · +78.5%
Race, ethnicity, and origin ACS 2023
- Neighborhood character
- Predominantly White (74%)
- Race & ethnicity
- White 74% Black 14% Two or more races 6% Hispanic / Latino 5% Asian 1%
- Common ancestry
- Italian 5% Serbian 4% Slovak 4%
- Foreign-born
- 3% · Canada, Guatemala, South Korea
- Languages at home
- 97% English-only · Spanish 1% Other Indo-European 1%
Political lean MEDSL · Richland
- 2024 margin
- Solid D (+34.6) · D 66.4% · R 31.8% · Other 1.8%
- 2008→2024 swing
- +5.7pp toward D · 2008: 28.9pp · 2024: 34.6pp
- All cycles
- 2024: D+34.6 2020: D+38.3 2016: D+32.9 2012: D+33.3 2008: D+28.9
Not yet ingested
- Civics
- —
Market trends
- HPI YoY
- ▼ -325.76%
- Current HPI
- 224.5418
- Rent YoY
- ▲ 4.80%
- Metro
- Columbia, SC
- State GDP YoY
- ▲ 4.51%
- F500 in state
- 2
Industry mix (Fortune 500 HQ in SC)
| Industry | F500 HQs | Revenue |
|---|---|---|
| Packaging | 1 | $7B |
|
||
Price history
+143.1% since first listed5 events — show timeline
- 2026-03-24 Pending — Consolidated MLS
- 2026-03-19 Listed $175,000 Consolidated MLS
- 2015-03-04 Sold (Public Records) $59,900 Public Records
- 1996-06-28 Sold (Public Records) $85,000 Public Records
- 1985-06-01 Sold (Public Records) $72,000 Public Records
Property tax history
-13.2%/yrLatest (2025): $616 · +3.9% YoY. Source: county tax records.
Cash-flow waterfall
monthlySold comps — $/sqft
last 12 mo · ≤1 miLoading sold comps…