650 S Rancho Santa Fe Rd #167 · San Marcos, CA
Flood risk 1/10 · Minimal
- FEMA flood zone
- X (unshaded)
- Chance of flooding over 30 yrs
- 0.0%
- Est. flood insurance / yr
- $507 – $1,088
Fire risk 1/10 · Minimal
- Est. fire insurance / yr
- $659 – $1,223
Heat risk 4/10 · Minor
- Hot days now (above 93°F)
- 7 days/yr
- Hot days in 30 yrs
- 22 days/yr
Wind risk 1/10 · Minimal
- Chance of severe wind over 30 yrs
- —
Air-quality risk 4/10 · Minor
- Unhealthy air days now
- 4 days/yr
- Unhealthy air days in 30 yrs
- 4 days/yr
Risk factors via First Street. Map © Google.
Why this score? — see what drove the D grade
The composite is a weighted blend of 9 inputs, each scored 0–100. Each bar is that input's sub-score; the figure is the points it added to the 100-point composite (weight × sub-score).
- Cash flow +17.7/30.0
- DSCR +5.5/10.0
- Schools +5.4/10.0
- 1% rule +4.8/10.0
- Livability +3.9/5.0
- Rent growth +2.6/5.0
- Condition / age +2.5/5.0
- ARV discount +0.0/15.0
- Appreciation +0.0/10.0
$349,000
🖨 Deal sheet 📄 Offer letter ✓ Due diligence
Listing remarks MLS
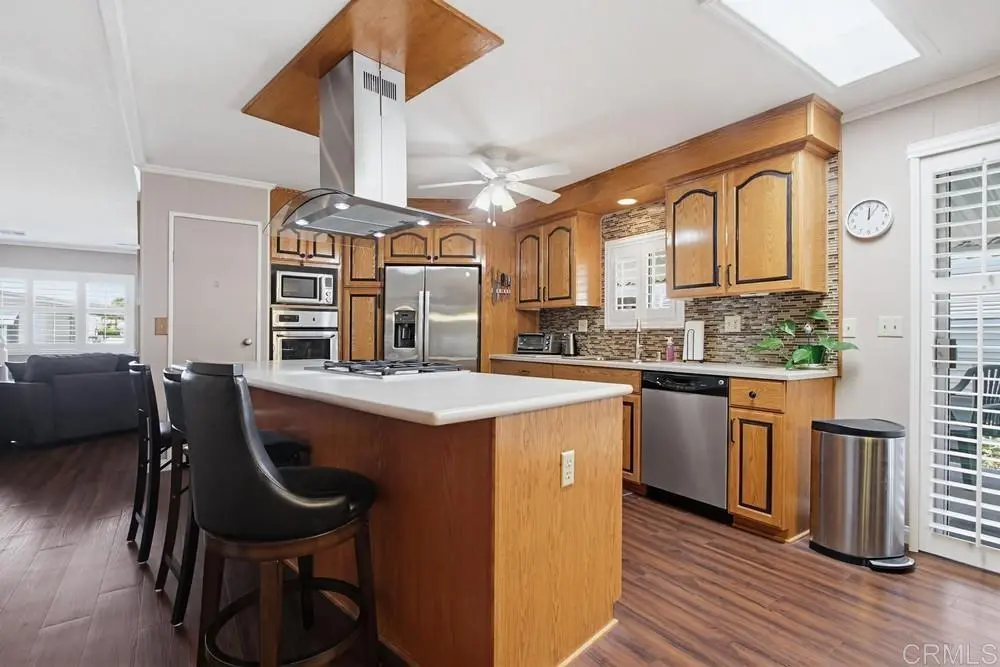
Top of the line rental park. Great 2BR/2BA home. New carpet. Great condition. Close to all shopping and banking. Buyer to verify sf prior to COE. Owner looking for quick escrow.
Key facts
- Remodeled kitchen
- Plantation shutters
- Plank vinyl flooring
Tags
Property features AI
Finance
- Other: Living area per public records; Lot size estimated
- HOA & community: Senior community; Community dog park; Land lease of $630
Exterior
- Parking: 2 parking spaces; 2 carport spaces
- Utilities: Public sewer
- Home design: Manufactured/mobile home (24' x 56') remains on property; Single-story; Located in a senior community; Located in Palomar Estates East
- Construction: Mobile/manufactured construction
- Exterior features: Association pool; Level lot with street access
Interior
- Bedrooms: Primary bedroom on main floor
- Bathrooms: 2 full bathrooms
- Heating & cooling: Forced air heating; Central cooling
- Interior features: One-level home; Front door entry; Main floor primary bedroom; All bedrooms on ground floor
- Laundry & utility: Laundry in its own room
Neighborhood map
What this means for you Summary
Snapshot
- This is a 2-bed/2.0-bath manufactured listed at $349k.
Deal economics
- At list price, monthly cash flow is $280 ($3k/yr) — positive.
- The deal already cash-flows at list — no discount required.
- To meet the 1% rule (rent ≥ 1% of price), the offer needs to be $341k (2.4% below list).
- Recommended offer: $341k (2.4% below list) — sets the bar for 1% rule.
- Cap rate 7.3% vs local median 2.5% in San Marcos — top-decile yield for the area; either an underpriced asset or a hidden risk that comps aren't pricing in. Stress-test before assuming the spread holds.
Location & tenants
- Location reads 77/100 on livability (#80 in CA, #3,074 nationally) — a middle-class / working-renter tenant base. Strengths: amenities A+, commute A+, employment A+; Watch: health & safety D+, cost of living F.
- San Marcos Unified (suburban): math 52% / reading 67% proficiency, ranked #249 of 1,400 in CA (top 18%) — acceptable for families but not a draw, mixed tenant base, ~2y average lease.
- Market conditions: Rents flat; 232 active listings in the ZIP; 18 comparable units currently listed for rent nearby; rentals at typical pace (median 24d on market — plan ~3-4 weeks tenant-placement turnaround); 44% of comp listings sitting > 30 days — soft ceiling on asking rent; high-income renter base; 11,759 units permitted in San Diego County in 2024 (7,244 in 5+ unit buildings).
- This rent runs 34% of the median local income ($120k/yr) — at the standard rent-burdened threshold; future hikes will face affordability resistance.
Forward outlook
- Local home prices are declining (-3.0%/yr); year-one equity from $2k of loan paydown is wiped out by about $10k of value loss. Plan a longer hold.
- San Diego County population projected at +20% by 2050 — long-run rental-demand tailwind backs the buy-and-hold thesis.
Negotiation context
- Only 13 days on market — expect competitive offers; lowballing is unlikely to land.
- 4 sale attempts since 19y ago; this cycle's ask has dropped $20k (5%) from the opening price — seller is motivated, your offer sets the floor, not the list.
- Current owner paid $60k; list at $349k implies a 482% gain — meaningful room to come down on a strong offer.
Questions for the listing agent
- Built in 1976 — when were the roof, HVAC, electrical panel, plumbing, and water heater last replaced?
- Is there a deadline driving the sale (1031 exchange, divorce, estate, relocation)? That informs how much negotiation room exists.
- The area grade is low — what's the realistic commute time and amenity access for the typical tenant pool here? Any planned neighborhood developments (good or bad) we should know about?
- What's the average days-on-market for RENTAL listings here right now (not sales)? A rising rental-DOM trend means longer vacancies and softer asking-rent achievability than the comps imply.
- What's the recent tenant-quality profile in this submarket — average credit score on applications, eviction rate, late-payment / NSF rate, and stable-employment percentage? A property-management company in the area should have these aggregated.
- How much new for-sale + rental construction is in the pipeline within 1–3 miles? Heavy new supply typically softens prices + rents 12–24 months out; constrained supply supports both.
Investment metrics
- 1% rule
- 0.98% ✗
- Cap rate
- 7.26%
- Cash-on-cash
- 3.44%
- DSCR
- 1.15
- GRM
- 8.5
CMA / ARV
- ARV (on-the-fly)
- $279,552
- Comps found
- 12
Show comp detail 12 sales within ~0.75 mi
| Address | Dist | Beds/Ba | Sqft | Sold | Price | $/sf | Match |
|---|---|---|---|---|---|---|---|
| 650 S Rancho Santa Fe Rd #312 | 0.00mi | 2/2.0 | 1,344 (0%) | 1mo | $267,000 | $199 | 100 |
| 650 S Rancho Santa Fe. Rd #294 | 0.01mi | 2/2.0 | 1,344 (0%) | 2mo | $228,500 | $170 | 98 |
| 650 S Rancho Santa Fe Rd #54 | 0.00mi | 2/2.0 | 1,248 (-7%) | 2mo | $260,000 | $208 | 86 |
| 3535 Linda Vista Dr #50 | 0.38mi | 2/2.0 | 1,368 (+2%) | 1mo | $358,000 | $262 | 78 |
| 3535 Linda Vista Dr #321 | 0.38mi | 3/2.0 (+1) | 1,344 (0%) | 1mo | $275,000 | $205 | 76 |
| 1930 W San Marcos Blvd #425 | 0.37mi | 3/2.0 (+1) | 1,344 (0%) | 2mo | $320,000 | $238 | 76 |
| 650 S Rancho Santa Fe Rd #118 | 0.00mi | 2/2.0 | 1,153 (-14%) | 2mo | $213,000 | $185 | 75 |
| 1930 W San Marcos Blvd #374 | 0.37mi | 2/2.0 | 1,440 (+7%) | 1mo | $385,000 | $267 | 70 |
| 3535 Linda Vista Dr Spc 29 | 0.38mi | 2/2.0 | 1,440 (+7%) | 1mo | $250,000 | $174 | 69 |
| 2010 W San Marcos Blvd #54 | 0.56mi | 3/2.0 (+1) | 1,344 (0%) | 1mo | $684,999 | $510 | 69 |
| 1930 W San Marcos Blvd #191 | 0.37mi | 2/2.0 | 1,488 (+11%) | 1mo | $310,000 | $208 | 64 |
| 1930 W San Marcos Blvd #437 | 0.37mi | 3/2.0 (+1) | 1,531 (+14%) | 2mo | $475,000 | $310 | 53 |
Match score weights: distance 35% · size 25% · config 20% · recency 20%. Top-matched comps best support the ARV.
Projected returns pro-forma
-3.0% appreciation · 0.35% rent growth · sell at horizon
- IRR
- -13.9%
- Equity multiple
- 0.51×
- Total profit
- $-47,508
- Equity at exit
- $52,037
- IRR
- -10.0%
- Equity multiple
- 0.46×
- Total profit
- $-52,628
- Equity at exit
- $30,175
Cash invested: $97,720 (down + closing). Projections, not guarantees.
Landlord ↔ Tenant lean methodology
- Overall (STATE)
- 18 Strongly Tenant-Friendly
- State California
- 18 Strongly Tenant-Friendly · D+13
- County
- — inherits STATE
- City
- — inherits STATE
ZIP-level market 92078
- Rents YoY
- 0.3%
- Active inventory
- 232
- Price-to-rent
- 8.5×
Monthly cashflow live
- Estimated rent
- $3,408 high interval (Pro) →
- Mortgage (P&I)
- −$1,830
- Tax est. 1.5%
- −$436 /mo · $5,235/yr
- Insurance
- −$145
- HOA
- −$0
- Vacancy / Maint / Mgmt
- −$716
- Net cashflow
- $280
Break-even live
UW: 25.0% down · 7.5% · 30yr · 1.5% tax · 5.0% vac · 8.0% maint · 8.0% mgmt
Financing live
Cash to close
- Down payment
- $87,250
- Closing costs
- $10,470
- Reserves months
- —
- Total cash needed
- —
Loan-product check · same deal, 3 products live
Conventional
25% down · 7.5% · 30yr
- Down + closing
- —
- Monthly P&I
- —
- Monthly cashflow
- —
- DSCR
- —
- Eligible?
- —
Personal DTI + credit; lowest rate.
DSCR
20% down · 8.5% · 30yr
- Down + closing
- —
- Monthly P&I
- —
- Monthly cashflow
- —
- DSCR
- —
- Eligible?
- —
No personal income docs; deal must DSCR.
Hard money
10% down · 12.0% · 12mo
- Down + closing
- —
- Monthly P&I
- —
- Monthly cashflow
- —
- DSCR
- —
- Eligible?
- —
Short-term bridge; refi at stabilization.
Rent comps 18 comps
| Address | Beds | Baths | Sqft | Rent | $/sqft | DOM | Units | Dist |
|---|---|---|---|---|---|---|---|---|
| 830 S Rancho Santa Fe Rd San Marcos, CA | 1.0–2.0 | 1.0–2.0 | 826 | $3,150 | $3.81 | 2d | 5 | 0.27mi |
| 3919 Las Cruces Ave San Marcos, CA | 3.0 | 2.0 | 1100 | $3,200 | $2.91 | 4d | 1 | 0.33mi |
| 1643 Rue de Valle San Marcos, CA | 2.0 | 1.5 | 1086 | $3,222 | $2.97 | 17d | 1 | 0.38mi |
| 910 S Rancho Santa Fe Rd Unit 1 San Marcos, CA | 2.0 | 2.0 | 950 | $2,900 | $3.05 | 24d | 1 | 0.38mi |
| 2010 W San Marcos Blvd San Marcos, CA | 2.0 | 2.0 | 1288 | $4,000 | $3.11 | 43d | 1 | 0.42mi |
| 603 Beverly Pl San Marcos, CA | 2.0 | 1.5 | 1068 | $3,150 | $2.95 | 43d | 1 | 0.42mi |
| 3815 La Rosa Dr San Marcos, CA | 3.0 | 1.0 | 1014 | $3,700 | $3.65 | 12d | 1 | 0.56mi |
| 658 Las Flores Dr San Marcos, CA | 3.0 | 1.0 | 1284 | $3,650 | $2.84 | 43d | 1 | 0.58mi |
| 3834 La Rosa Dr Unit A San Marcos, CA | 2.0 | 1.0 | 1014 | $4,200 | $4.14 | 43d | 1 | 0.59mi |
| 1029 Martina Ct San Marcos, CA | 2.0 | 2.0 | 1200 | $2,995 | $2.50 | 43d | 1 | 0.65mi |
| 1560 Circa Del Lago Unit D302 San Marcos, CA | 2.0 | 2.0 | 1030 | $4,500 | $4.37 | 43d | 1 | 0.77mi |
| 1560 Circa Del Lago Unit D304 San Marcos, CA | 2.0 | 2.0 | 1030 | $4,500 | $4.37 | 24d | 1 | 0.77mi |
| 1241 W San Marcos Blvd San Marcos, CA | 1.0–2.0 | 1.0 | 883 | $2,400 | $2.72 | 43d | 1 | 0.86mi |
| 1635 Creek St San Marcos, CA | 1.0–2.0 | 2.0 | 1047 | $3,450 | $3.29 | 14d | 3 | 0.90mi |
| 1510 Calle Devanar San Marcos, CA | 3.0 | 2.0 | 1222 | $3,595 | $2.94 | 4d | 1 | 1.16mi |
| 1604 Via Inspirar San Marcos, CA | 3.0 | 2.0 | 1222 | $3,850 | $3.15 | 43d | 1 | 1.17mi |
| 420 Smilax Rd San Marcos, CA | 2.0 | 2.0 | 896 | $2,445 | $2.73 | 2d | 3 | 1.40mi |
| 1257 Armorlite Dr San Marcos, CA | 2.0 | 1.0–2.5 | 1189 | $4,330 | $3.64 | 1d | 24 | 1.41mi |
Listing history 9 events
-
2026-06-18days on market $349,000 Active 13 DOM
-
2026-06-17pricedays on market $349,000 Active 12 DOM
-
2026-06-16days on market $369,000 Active 11 DOM
-
2026-06-15days on market $369,000 Active 10 DOM
-
2026-06-13days on market $369,000 Active 8 DOM
-
2026-06-09days on market $369,000 Active 4 DOM
-
2026-06-08days on market $369,000 Active 3 DOM
-
2026-06-07remarks 699-char remark
-
2026-06-07$369,000 Active 2 DOM
ⓘ Source: listings_history table (triggers on properties + properties_extension) + one-shot
backfill from property_details.listing_events for pre-trigger history.
Climate risk First Street
- Flood 1/10 Low FEMA zone X (unshaded) · 0% chance over 30 yrs
- Wildfire 1/10 Low
- Heat 4/10 Moderate 7 d/yr ≥93°F today · 22 d/yr by 30 yrs out
- Wind 1/10 Low
- Air quality 4/10 Moderate 4 unhealthy d/yr today · 4 by 30 yrs out
Nearby sold comps map
Loading sold comps map…
Walkable amenities ~0.75 mi
Loading nearby amenities…
Taxation est. · year 1
- Rental income
- $40,892
- − Mortgage interest
- −$19,549
- − Property taxes
- −$5,235
- − Insurance
- −$1,745
- − Repairs & maintenance
- −$3,271
- − Management
- −$3,271
- − Depreciation
- −$10,153
- Taxable loss
- −$2,333
- Est. tax savings @ 24.0%
- +$560
- After-tax cash flow
- $3,922/yr
For passive investors: Depreciation is non-cash, so a rental often shows a tax loss while cash-flowing — sheltering income. Rental losses are passive: they offset passive income freely, and up to $25,000/yr can offset ordinary (W-2) income if you actively participate and your MAGI is under $100k (phasing out to $0 by $150k); unused losses carry forward. On sale, claimed depreciation is recaptured at up to 25%, and gains may owe capital-gains tax (a 1031 exchange can defer both). Figures are a year-1 estimate at your 24.0% rate — not tax advice; consult a CPA.
Schools (NCES district)
- District
- San Marcos Unified
- NCES district ID
- 0634880
- Math proficiency
- 52% ▲ 1.00%
- Reading proficiency
- 67% ▲ 2.00%
- Median HH income
- $64,752
- Composite
- 53.67/100
- National rank
- #3093
- State rank
- #249 of 1400 in CA
Livability — San Marcos
- Score
- 77/100
- State rank
- #80
- US rank
- #3074
Category grades
Schools grade is shown separately in the Schools card above.
Census & demographics
- Census place
- San Marcos, CA
- County
- San Diego County · 3,178,799 people
- City population
- 100,940
- Metro
- San Diego-Chula Vista-Carlsbad, CA
- Population (ZIP)
- 53,605
- Household income
- $120,268
- Rent vs Own
- Severe rent burden
- 1594.0
Population outlook (San Diego County) Hauer SSP2
- Today (2025)
- 3,678,185 people
- By 2030
- 3,856,546 · +4.8%
- By 2040
- 4,171,407 · +13.4%
- By 2050
- 4,421,607 · +20.2%
- By 2075
- 4,831,599 · +31.4%
- By 2100
- 4,832,502 · +31.4%
Race, ethnicity, and origin ACS 2023
- Neighborhood character
- Diverse neighborhood (Simpson 0.62)
- Race & ethnicity
- White 53% Hispanic / Latino 28% Two or more races 17% Asian 10% Black 1%
- Hispanic origin (detail)
- Mexican 23%
- Common ancestry
- Italian 3% Slovak 3% Romanian 2%
- Foreign-born
- 19% · Canada, China, Vietnam
- Languages at home
- 73% English-only · Spanish 18% Other Indo-European 3% Chinese 1%
Political lean MEDSL · San Diego
- 2024 margin
- D (+16.8) · D 56.9% · R 40.1% · Other 2.9%
- 2008→2024 swing
- +6.6pp toward D · 2008: 10.2pp · 2024: 16.8pp
- All cycles
- 2024: D+16.8 2020: D+22.8 2016: D+17.8 2012: D+5.1 2008: D+10.2
Not yet ingested
- Civics
- —
Market trends
- HPI YoY
- ▼ -351.55%
- Current HPI
- 358.3294
- Rent YoY
- ▲ 0.35%
- Metro
- San Diego-Chula Vista-Carlsbad, CA
- State GDP YoY
- ▲ 3.21%
- F500 in state
- 116
Industry mix (Fortune 500 HQ in CA)
| Industry | F500 HQs | Revenue |
|---|---|---|
| Technology | 27 | $1,492B |
|
||
| Financial Services | 3 | $174B |
|
||
| Retail | 3 | $44B |
|
||
| Insurance | 3 | $26B |
|
||
| Media / Entertainment | 2 | $115B |
|
||
| Pharmaceuticals / Biotech | 2 | $62B |
|
||
Price history
+373.1% since first listed7 events — show timeline
- 2026-06-05 Listed $369,000 CRMLS
- 2008-01-17 Sold (MLS) $60,000 CRMLS
- 2007-10-19 Listed $60,000 CRMLS
- 2007-05-23 Listing Removed — SDMLS
- 2007-05-23 Listing Removed — CRMLS
- 2007-01-19 Listed $78,000 SDMLS
- 2007-01-19 Listed $78,000 CRMLS
Cash-flow waterfall
monthlySold comps — $/sqft
last 12 mo · ≤1 miLoading sold comps…